Sharif University of Technology
Scientia IranicaTransactions A: Civil Engineering www.scientiairanica.com
Pile head displacements with dierent cross sectional
shapes under lateral loading and unloading in granular
soils
P. Vahabkashi
and A. Rahai
Department of Civil Engineering, Amir Kabir University of Technology, Tehran, Iran. Received 12 March 2013; received in revised form 24 June 2014; accepted 25 October 2014
KEYWORDS Soil-pile interaction; Lateral load; Loading and unloading; Pile head displacements; Cross sectional shapes;
Dissipated energy.
Abstract. Piles in structural foundations that are used to load transmissions from the main structure to the bed are generally subjected to lateral loads. In order to study the eect of concrete pile geometry on its structural behavior, several models with dierent shapes and dimensions were selected and analyzed, assuming nonlinear behavior for soil. The behavior of the pile models was studied, evaluated and tabulated using numerical analysis under dierent conditions, such as changes in the pile geometry and shape, and soil properties. Therefore, the displacements of pile heads situated in granular soil, with dierent compaction levels, under a lateral load, were studied in loading and unloading cycles. The dissipated energy was calculated based on pile head displacements in dierent load steps in the rst and second cycles of loading. The \performance index" is dened as the ratio of dissipated energy to the maximum pile head displacement, and these two factors eects on dierent pile model behavior were compared, concurrently. It was observed that piles with rectangular cross sections and smaller width have the maximum dissipation of energy, and the minimum displacement occurs in dense soil.
c
2015 Sharif University of Technology. All rights reserved.
1. Introduction
Pile behavior under lateral loads should be investi-gated, considering those parameters which inuence it eectively, such as pile geometry and rigidity, pile connections to caps whether hinged or xed, and soil properties. Stress distribution in soil surrounding the pile under lateral loads is not uniform, and its formation also depends on the soil behavior model.
Gazetas and Gerolymos (2005) [1,2] studied the results of comparing the 4-spring Winkler model and the nite element method, for both rigid and exible caisson foundations, and recommended the Winkler
*. Corresponding author. Mobile: +98 912 1432893; Fax: +98 21 66509003
E-mail addresses: [email protected] (P. Vahabkashi); [email protected] (A. Rahai)
model, due to its simplicity and generalization capa-bility for inelastic soil. Reese and Van Impe (2001) [3] studied pile behavior assuming ve dierent conditions and methods: both pile and soil in continuous elastic, pile in elastic behavior and soil in semi-innite space, pile under rigid conditions and soil under non-elastic conditions, the CLM (Characteristic Load Method) and the p y curve method. Brown and Shie (1990, 1991) [4,5] and Trochanis et al. (1991) [6] conducted a series of 3D FEM studies on the behavior of a single pile and a pile group with the elasto-plastic soil model. These researchers used interface elements to consider pile-soil interaction.
According to research by Greimann et al. (1987) [7], performed on SPI (Soil-Pile Interaction) in the abutment of single span bridges, an analytic algorithm was used, based on a developed non-linear nite element method, to compute the stresses and
internal forces in piles. In this analysis, to model the pile, beam-column elements with nonlinear geometry and materials were used. Also, to model the soil, nonlinear springs were applied and a modied model was introduced to dene a tangential stiness in non-linear spring elements. Several numerical examples are presented for evaluating the validity of the mentioned model. In 2001, another survey was performed by Ellis and Springman [8] in which the eect of soil-pile interaction on the behavior of soil-piles under the abutment of a single span bridge in plane-strain state was studied. In this study, a series of geotechnical experiments were carried out on some piles situated in soft clay. The test results were compared with the above-mentioned numerical analysis. The structural behavior of some elements (especially piles) did not match the plane strain assumptions, hence, some other methods were proposed, and their validity was examined by experiment. Finally, it was demonstrated that side abutments and the soil around them should also be modeled in 3D space.
Several analytical methods have been developed to analyze the response of laterally loaded piles, in-cluding the elastic continuum [9,10], nite element [11], elastic subgrade reaction [12-14], and p y [15,16] methods. The choice of a constitutive model depends on several factors, but, in general, it is related to the type of analysis that the user intends to undertake the expected precision of predictions and knowledge of the soil [17].
In a study by Movemen (2005) [18], a pile model was analyzed, based on the displacement control method, using FLAC 3D software, to evaluate the pile response and the lateral pressure caused by the slope of the soil surface around the abutment in a transitional failure mode. The soil under the surface layer had low strength as a liqueed soil layer. This study included investigation of kinematic loads and soil 3D displacement eects on the responses of pile or pile groups [22] subjected to lateral pressure. The results prove that the proposed displacement method can be used for designing the piles which are under lateral soil displacement or can be applied to the analysis of soil-pile stability. Analytical results show the important eect of soil and pile parameters and the relative stiness between soil and pile on failure models.
Piles are often embedded in layered soils, such as a clay layer overlying the rock. The stiness of soil can vary with depth, such as in sand and sedimentary rock, or remain constant with depth, such as in clay. Although the solutions proposed by Davisson and Gill (1963) [14] and Pise (1982) [10] can be used for piles in layered soils under small service loads, the stiness of soil is still required to be constant with depth for each layer. This may not suciently represent the actual soil proles, especially when soil stiness varies with
depth. The pile stress distribution depends eectively on the surrounding soil properties. Regarding soil-pile interaction and the eect of soil behavior on pile, more accurate elasto-plastic models, such as Mohr-Coulomb or Drucker-Prager, are more suitable. Also, due to the fact that Mohr-Colomb parameters can be obtained from simple tests and are usually available, they are frequently used for initial calculation of pile bearing capacity [19].
Ashour et al. (2004) [20] studied the lateral behavior of pile groups in layered soils. They used the strain wedge model, which was developed to analyze the response of a long exible pile inuenced by a hor-izontal uniform load at the top of the pile and layered soil (sand and/or clay). Pile reaction is characterized by three-dimensional soil-pile interaction, which is then transformed into its equivalent one-dimensional beam on an elastic foundation and the related parameter (modulus of subgrade reaction, Es) variation along the
pile length. In a pile group, the interaction between piles is based on the geometry and interaction of the mobilized passive sections of soil adjacent to the piles related to the pile spacing. Furthermore, in a group, the overlap of shear zones between piles diers along the length of the pile and changes from one soil layer to another in the soil prole.
Pile exibility, which causes energy dissipation during an earthquake, is dependent on the pile head displacement that should be limited to provide appro-priate conditions for the structure leaning on the piles. Therefore, the separate study of dissipated energy and pile head displacement does not show the proper behavior of piles. In this study, we have endeavored to investigate the energy dissipation and displacement of the pile head concurrently to nd the most suitable cross section, having maximum energy dissipation and minimum pile head displacement.
2. Analysis method
In this study, several models of circular and rectangular piles with dierent geometries in granular soil with various compactions have been investigated, and the analysis results are presented based on the assumptions below:
1. The nonlinear analysis of 3D models is performed using the Mohr-Coulomb criteria for soil behavior and soil-pile interaction.
2. The behavior of pile material is modeled as elastic isotropic.
3. The behavior of the soil surrounding the piles, which has 100 mm thickness, is modeled using the \Interface Element". FLAC 3D provides interfaces that are characterized by Coulomb sliding. Friction angle and cohesion parameters are dened in order
Figure 1. Gridding of piles and surrounding soil.
to calculate the values of sliding, penetration or separation of two surfaces. These parameters are considered as 67 percent of the main values, based on previous studies [21,22].
4. To minimize boundary condition eects in analysis, the geometry of soil meshes surrounding the piles is modied based on stress variation in boundary zones. The nite dierence mesh is shown in Figure 1.
5. 3D numerical analysis of piles is performed under incremental cyclic loading with two loading and unloading cycles. For some models, the increment load in the rst cycle is 31.25 kN, and in the second cycle is 62.5 kN. Also, maximum load is 125 kN in the rst cycle and 250 kN in the second cycle. For other models, the increment load is 62.5 kN in the rst cycle, and 125 kN in the second cycle. Maximum load is 250 kN and 500 kN in the rst and second cycles, respectively. More details of dierent model characteristics are shown in Table 1.
6. In order to minimize the analysis process, only half of each model is analyzed, due to the symmetry.
7. The analysis is performed based on the nite dierence method using FLAC 3D software. In order to obtain an appropriate grid space value in the vertical direction, which has a signicant impact on the numerical analysis results, an initial value of 900 mm (equal to 1/10 pile's length) has been chosen, and with its reduction in sequential analyses, a proper grid space of 150 mm has been acquired.
3. The validity of the analytical method
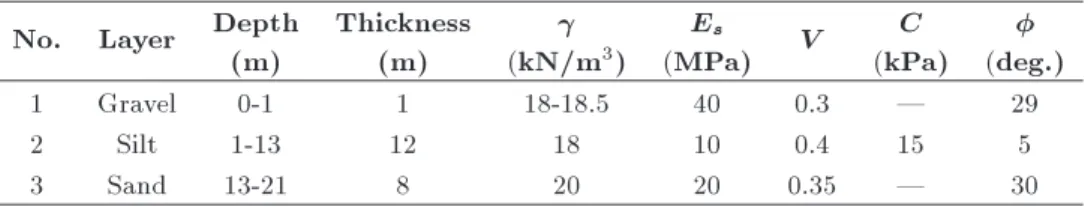
To validate the analytical procedure, the experimental results for pre-casted piles, used and tested under lateral static cyclic loading in the Fajr II site, are chosen and analyzed with numerical models. The aforementioned site is located in Mahshahr, Khuzestan Province, near the Persian Gulf, southwest Iran, where the Fajr II petrochemical site is located. The results of the lateral load test of pile No.12, which is shown in Figure 2, have been considered in this study. Further information is available in a case study investigat-ing driven pile behavior by Hosseinzadeh Attar and Fakharian (2013) [23]. These circular hollow section concrete piles have an outer diameter of 450 mm, a thickness equal to 90 mm, and a length of 21 m. The compressive strength and elastic modulus of concrete are 80 MPa and 44000 MPa, respectively. The region's soil is layered and its characteristics are listed in Table 2. Lateral static loading results are also shown in Figure 3.
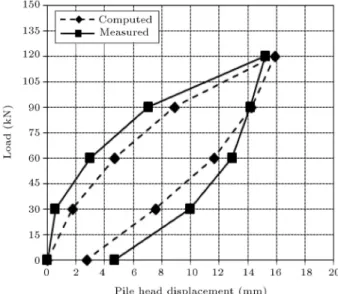
The resulting values for lateral displacement of pile heads in 3D analysis, under the rst cycle of loading and unloading, are shown and compared with the experimental real scale data in Figure 4. As shown in this gure, the analytical and experimental results have acceptable agreement. The relative dierence between numerical analysis and experimental results has been calculated for various steps of loading. Results show a 4.2% dierence in maximum load case, and the average dierence in various loading steps is 30%. This is due to the fact that the beginning of nonlinearity in soil behavior occurs under lower steps of loading, relative to analytical results. As the aim of this study is to compare pile behavior in various models, and the absolute values of results in the middle steps of loading have not been considered, the existing dierence has no major impact on the conclusion and when making inferences.
4. Specications of the numerical models This study is performed using pile models with cross-shaped, circular and rectangular cross sections, as shown in Figure 5. Pile length is 9 meters, and the diameter or width of cross sections are 600 mm
Table 1. Fajr II site's soil layer characteristics. No. Layer Depth
(m)
Thickness (m)
(kN/m3)
Es
(MPa) V
C (kPa)
(deg.)
1 Gravel 0-1 1 18-18.5 40 0.3 | 29
2 Silt 1-13 12 18 10 0.4 15 5
3 Sand 13-21 8 20 20 0.35 | 30
: Specic weight; Es: Modulus of Elasticity;
Figure 2. Location of test pile no.12 in Fajr II site, Mahshahr, Iran.
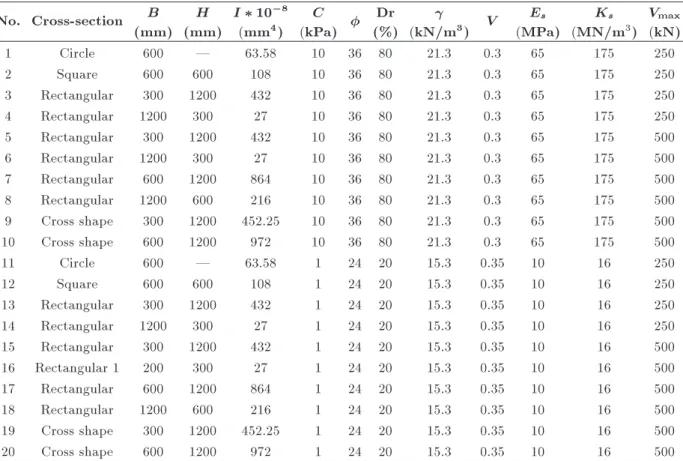
Table 2. Specications of pile models and the soil around them; Ks= Coecient of horizontal subgrade reaction.
No. Cross-section B (mm)
H (mm)
I 10 8
(mm4)
C
(kPa) Dr(%)
(kN/m3) V
Es
(MPa)
Ks
(MN/m3)
Vmax
(kN)
1 Circle 600 | 63.58 10 36 80 21.3 0.3 65 175 250
2 Square 600 600 108 10 36 80 21.3 0.3 65 175 250
3 Rectangular 300 1200 432 10 36 80 21.3 0.3 65 175 250
4 Rectangular 1200 300 27 10 36 80 21.3 0.3 65 175 250
5 Rectangular 300 1200 432 10 36 80 21.3 0.3 65 175 500
6 Rectangular 1200 300 27 10 36 80 21.3 0.3 65 175 500
7 Rectangular 600 1200 864 10 36 80 21.3 0.3 65 175 500
8 Rectangular 1200 600 216 10 36 80 21.3 0.3 65 175 500
9 Cross shape 300 1200 452.25 10 36 80 21.3 0.3 65 175 500
10 Cross shape 600 1200 972 10 36 80 21.3 0.3 65 175 500
11 Circle 600 | 63.58 1 24 20 15.3 0.35 10 16 250
12 Square 600 600 108 1 24 20 15.3 0.35 10 16 250
13 Rectangular 300 1200 432 1 24 20 15.3 0.35 10 16 250
14 Rectangular 1200 300 27 1 24 20 15.3 0.35 10 16 250
15 Rectangular 300 1200 432 1 24 20 15.3 0.35 10 16 500
16 Rectangular 1 200 300 27 1 24 20 15.3 0.35 10 16 500
17 Rectangular 600 1200 864 1 24 20 15.3 0.35 10 16 500
18 Rectangular 1200 600 216 1 24 20 15.3 0.35 10 16 500
19 Cross shape 300 1200 452.25 1 24 20 15.3 0.35 10 16 500
20 Cross shape 600 1200 972 1 24 20 15.3 0.35 10 16 500
and 1200 mm. Soil is assumed to be homogeneous and is modeled in X, Y and Z directions up to a 15 m distance from the pile head. These models have been completed in low compacted and high compacted granular soil. The soil properties mentioned in Table 1
are obtained from the test results of 2 dierent regional soils. Other geometrical and mechanical properties are also presented in Table 1.
Loading is applied as a uniform horizontal stress on the pile head joints at every step of load increase,
Figure 3. Results of the lateral static cyclic loading.
Figure 4. Comparison of pile head displacement in analytical and experimental models in rst loading cycle.
Figure 5. Pile cross section shapes.
and is performed by applying a primary stress on the pile head.
In order to have the same compaction of the soil against piles with dierent geometric shape, the width or diagonal of the load conveying surface should be chosen as equal. Obviously, in this case, pile stiness would not be similar. However, due to the same load, by comparison of pile head displacement in the load direction under various states, the stiness of the set of soil and pile would be comparable.
5. Result and discussions
The area under the loading and unloading curve presents the value of dissipated energy, which is pro-duced due to nonlinearity in the soil behavior, and it is used to compare pile behavior.
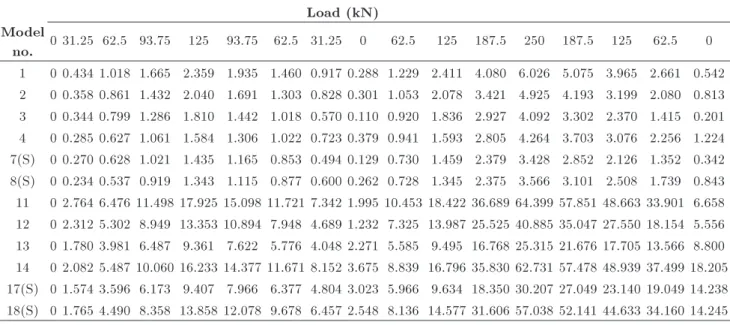
The dissipated energy is obtained based on pile head displacements at dierent load steps of the rst and second cycles of loading (Tables 3 and 4, Figure 6). To compare the pile behavior under 250 kN and 500 kN loads, and to study the eect of replacing a 600*1200 mm pile with two of 300*1200, the displace-ments of the 600*1200 mm pile under 500 kN loads are scaled by a factor of 0.5. The numbers of scaled models are accompanied by an index of \s".
According to the soil type (low or high com-pacted) and the maximum load value (250 kN and 500 kN), four groups are classied: group one includes models 1 to 4 and scaled models 7 and 8; group two contains models 5 to 10; group three contains models 11 to 14 and scaled models 17 and 18; and nally, group four contains models 15 to 20. The comparison results are shown in Figure 6. Despite the fact that more displacement in the pile and soil increases the dissipation of transmitting energy from the bed to the main structure, large displacement of pile head causes large displacement and serious problems for the main structure. So, piles which dissipate more energy with smaller displacements have more appropriate behavior. For a concurrent com-parison of maximum pile head displacement and the dissipation of energy in dierent models, the \per-formance index", \k", is dened as the ratio of dissipated energy to maximum displacement. The greater \performance index" shows the more appropri-ate behavior of the pile. These values are presented in Tables 5 and 6, and also in Figures 7(c), (d) and 8(c), (d).
According to the analytical results, in models of the rst group, the maximum dissipation of energy is obtained for models #1 and #3. The maximum pile head displacement of model #1 is 41% greater than model #3. Thus, model #3 has better behavior in this group.
A comparison of scaled models #7 and #8 with models #3 and #4 shows that using piles with larger dimensions results in better behavior. For example, increasing the rectangular pile dimension from 300 to 600 mm caused an increase in the performance index from 7.5% to 53%.
In groups (2) and (4), with maximum horizontal force of 500 kN, it is shown that the maximum value of dissipated energy, both in low and high compacted soil, occurs in rectangular cross section piles with dimension ratios of 0.25. But, due to the large pile head displacement in low compacted
Table 3. Values of pile head displacement (mm) for dierent cross sections under cyclic loading with a maximum horizontal force of 250 kN and increment loads of 31.25 kN in the rst cycle and 62.5 kN in the second cycle.
Load (kN) Model
no. 0 31.25 62.5 93.75 125 93.75 62.5 31.25 0 62.5 125 187.5 250 187.5 125 62.5 0 1 0 0.434 1.018 1.665 2.359 1.935 1.460 0.917 0.288 1.229 2.411 4.080 6.026 5.075 3.965 2.661 0.542 2 0 0.358 0.861 1.432 2.040 1.691 1.303 0.828 0.301 1.053 2.078 3.421 4.925 4.193 3.199 2.080 0.813 3 0 0.344 0.799 1.286 1.810 1.442 1.018 0.570 0.110 0.920 1.836 2.927 4.092 3.302 2.370 1.415 0.201 4 0 0.285 0.627 1.061 1.584 1.306 1.022 0.723 0.379 0.941 1.593 2.805 4.264 3.703 3.076 2.256 1.224 7(S) 0 0.270 0.628 1.021 1.435 1.165 0.853 0.494 0.129 0.730 1.459 2.379 3.428 2.852 2.126 1.352 0.342 8(S) 0 0.234 0.537 0.919 1.343 1.115 0.877 0.600 0.262 0.728 1.345 2.375 3.566 3.101 2.508 1.739 0.843 11 0 2.764 6.476 11.498 17.925 15.098 11.721 7.342 1.995 10.453 18.422 36.689 64.399 57.851 48.663 33.901 6.658 12 0 2.312 5.302 8.949 13.353 10.894 7.948 4.689 1.232 7.325 13.987 25.525 40.885 35.047 27.550 18.154 5.556 13 0 1.780 3.981 6.487 9.361 7.622 5.776 4.048 2.271 5.585 9.495 16.768 25.315 21.676 17.705 13.566 8.800 14 0 2.082 5.487 10.060 16.233 14.377 11.671 8.152 3.675 8.839 16.796 35.830 62.731 57.478 48.939 37.499 18.205 17(S) 0 1.574 3.596 6.173 9.407 7.966 6.377 4.804 3.023 5.966 9.634 18.350 30.207 27.049 23.140 19.049 14.238 18(S) 0 1.765 4.490 8.358 13.858 12.078 9.678 6.457 2.548 8.136 14.577 31.606 57.038 52.141 44.633 34.160 14.245 Table 4. Values of pile head displacement (mm) for dierent cross sections under cyclic loading with a maximum horizontal force of 500 kN and increment loads of 62.5 kN in the rst cycle and 125 kN in the second cycle.
Load (kN) Model
no. 0 31.25 62.5 93.75 125 93.75 62.5 31.25 0 62.5 125 187.5 250 187.5 125 62.5 0 1 0 0.434 1.018 1.665 2.359 1.935 1.460 0.917 0.288 1.229 2.411 4.080 6.026 5.075 3.965 2.661 0.542 2 0 0.358 0.861 1.432 2.040 1.691 1.303 0.828 0.301 1.053 2.078 3.421 4.925 4.193 3.199 2.080 0.813 3 0 0.344 0.799 1.286 1.810 1.442 1.018 0.570 0.110 0.920 1.836 2.927 4.092 3.302 2.370 1.415 0.201 4 0 0.285 0.627 1.061 1.584 1.306 1.022 0.723 0.379 0.941 1.593 2.805 4.264 3.703 3.076 2.256 1.224 7(S) 0 0.270 0.628 1.021 1.435 1.165 0.853 0.494 0.129 0.730 1.459 2.379 3.428 2.852 2.126 1.352 0.342 8(S) 0 0.234 0.537 0.919 1.343 1.115 0.877 0.600 0.262 0.728 1.345 2.3757 3.566 3.101 2.508 1.739 0.843 11 0 2.764 6.476 11.498 17.925 15.098 11.721 7.342 1.995 10.453 18.422 36.689 64.399 57.851 48.663 33.901 6.658 12 0 2.312 5.302 8.949 13.353 10.894 7.948 4.689 1.232 7.325 13.987 25.525 40.885 35.047 27.550 18.154 5.556 13 0 1.780 3.981 6.487 9.361 7.622 5.776 4.048 2.271 5.585 9.495 16.768 25.315 21.676 17.705 13.566 8.800 14 0 2.082 5.487 10.060 16.233 14.377 11.671 8.152 3.675 8.839 16.796 35.830 62.731 57.478 48.939 37.499 18.205 17(S) 0 1.574 3.596 6.173 9.407 7.966 6.377 4.804 3.023 5.966 9.634 18.350 30.207 27.049 23.140 19.049 14.238 18(S) 0 1.765 4.490 8.358 13.858 12.078 9.678 6.457 2.548 8.136 14.577 31.606 57.038 52.141 44.633 34.160 14.245 Table 5. The performance index values, k (kN), into the cycle of loadings with a maximum horizontal force of 250 kN.
Model
Cycle 1 2 3 4 7(S) 8(S) 11 12 13 14 17(S) 18(S)
1 17.74 20.24 24.99 11.33 24.04 14.34 25.14 17.75 35.44 21.15 33.54 30.95 2 42.60 40.31 60.36 22.15 55.93 34.6 74.91 55.15 89.39 60.15 90.36 84.61 Table 6. The performance index values, k (kN), into the cycle of loadings with a maximum horizontal force of 500 kN.
Model
Cycle 5 6 7 8 9 10 15 16 17 18 19 20
1 67.07 24.41 48.08 28.68 43.21 39.31 94.64 66.24 67.09 61.89 68.27 101.5 2 181.4 115.2 147.2 108.0 143.6 126.6 247.5 197.2 204.7 199.1 212.7 286.9
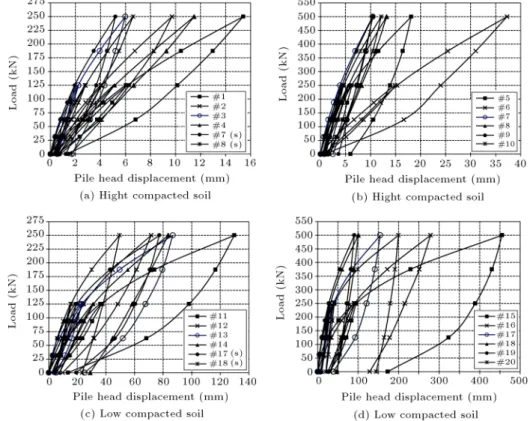
Figure 6. Pile head displacement with dierent cross sections in two cycles of loading with a maximum horizontal force of 250 kN (a,c) and 500 kN (b,d) in low and high compacted soil.
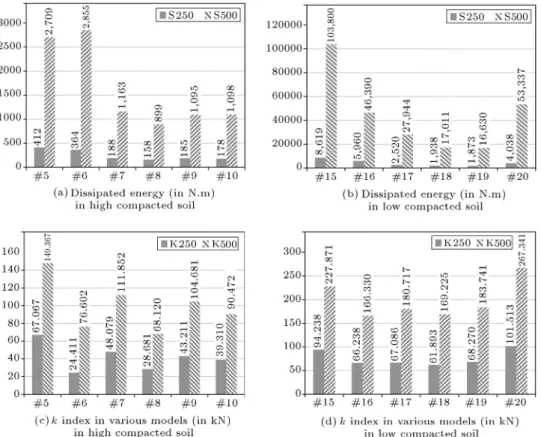
Figure 7. Comparison of the dissipated energy and performance index \k" in various models with dierent cross sections in two cycles of loading with a maximum horizontal force of 125 kN in the rst cycle and maximum horizontal force of 250 kN in the second cycle in high and low compacted soil.
Figure 8. Comparison of the dissipated energy and performance index \k" in various models with dierent cross sections in two cycles of loading with a maximum horizontal force of 250 kN in the rst cycle and maximum horizontal force of 500 kN in the second cycle in high and low compacted soil.
soil (314 mm), using them is not appropriate. The cross-shaped pile with a thickness of 600 mm shows the maximum performance index among the models with low compacted soil type. While the thickness of cross-shaped piles varies from 300 to 600 mm, the performance index in low compacted soil increases. However, the performance index dierences of these piles in highly compacted soil are not noticeable. This means that the high compacted surrounding soil between the anges acts as part of the pile cross section, and the performance dependence of the pile on its ange thickness decreases in this state.
In rectangular cross sections, when the perpen-dicular side to the force direction is the larger side, pile behavior is more exible, and the dierence between the performance indexes in low and high compacted soil has greater value. As an example, for a rectangular pile with 300*1200 mm cross sec-tional dimensions under a maximum lateral load of 250 kN, the dierence in performance index for high and low surrounding soil compaction reaches 170 per-cent.
The results of the models in the third group show that the maximum dissipation of energy is obtained for model #3, but there is no noticeable dierence between pile head displacements.
6. Conclusions
In this paper, the eects of the shape and geometry of piles on their behavior in granular soil under lateral loads are investigated using several numerical models. Incremental cyclic loading for the pile head are consid-ered. The pile head displacement and the dissipation of energy in the soil and the pile are measured and compared. To compare the analytical results, dierent piles are categorized based on soil characteristics and loading conditions, and the performance index is de-ned as the ratio of dissipated energy to displacement. According to the analysis results, the piles with a rectangular cross section where the loading is applied on the larger side of the cross section have the most suitable performance in compact soils. The dissipation of energy in dierent load cycles for low compacted soil is greater than for high compacted soil. The cross section shape is less inuential in low compacted soil because of large pile displacements. The comparison of rectangular piles performance with dierent widths in compact soils demonstrates that the combination of two rectangular piles with the small width make the new pile with larger width, where loading is applied along the smaller side of section, and causes consider-able improvement in pile performance. The maximum dissipation of energy with no consideration of soil
condition is produced in the thin rectangular piles, which are inecient because of large displacement on their heads.
The cross-shaped piles with 600 mm ange thick-ness show the most suitable performance and have the highest \performance index" in low compacted soil. Nevertheless, these piles seem to be inecient in com-pact soils. The pile performance dependence on ange thickness in low compacted soil is much more than that in high compacted soil. As an explanation, the high compacted soil conned between anges participates with the anges and performs as part of the pile, which causes a reduction in the dependency on ange thickness.
The eect of soil compaction on the performance of piles under dierent conditions is not the same. The largest dierence between the performances of the piles, located in compacted and loose soils, is related to rectangular piles with less width. This pile is under incremental lateral loading, with smaller maximum load along the width of the cross section. On the other hand, the soil compaction rate could be more eective on pile behavior in the case of exible piles with increased interface area. The models with low compacted soil show more dissipation of energy ratio in relation to the models with high compacted soil. References
1. Gerolymos, N. and Gazetas, G. \Development of Winkler model for lateral static and dynamic response of caisson foundations with soil and interface nonlin-earities", Soil Dyn. Earthq. Eng. (2005).
2. Gerolymos, N. and Gazetas, G. \Static and dynamic response of massive caisson foundations with soil and interface nonlinearities validation and results", Soil Dyn. Earthq. Eng. (2005).
3. Reese, L. and Van Impe, W.F., Single Piles and Pile Groups Under Lateral Loading, Balkema, Rotterdam (2001).
4. Brown, D.A. and Shie, C.F. \Numerical experiments into group eects on the response of piles to lateral loading", Comput. Geotech. (1990).
5. Brown, D.A. and Shie, C.F. \Some numerical exper-iments with a three-dimensional nite element model of a laterally loaded pile", Comput. Geotech, 12, pp. 149-162 (1991).
6. Trochanis, A.M., Bielak, J. and Christiano, P. \Three-dimensional nonlinear study of piles", J. Geotech. Eng., 117(3), pp. 429-447 (1991).
7. Greimann, L.F., Wolde-Tinsae, A.M. and Yang, P.S. \Finite element model for soil-pile interaction in inte-gral abutment bridges", Computers and Geotechnics, 4(3), pp. 127-149 (1987).
8. Ellis, E.A. and Springman, S.M. \Modeling of soil-structure interaction for a piled bridge abutment in plane strain FEM analyses", Computers and Geotech-nics, 28(2), pp. 79-98 (2001).
9. Poulos, H.G. \Behavior of laterally loaded piles; I: single piles", Journal of Soil Mech. and Found. Div., 97(5), pp. 711-731 (1971).
10. Pise, P.J. \Laterally loaded piles in a two-layer soil system", Journal of Geotech. Engrg., 108(9), pp. 1177-1181 (1982).
11. Randolph, M.F. \The response of exible piles to lateral loading", Geotechnique, 31(2), pp. 247-259 (1981).
12. Hetenyi, M., Beams on Elastic Foundations, University of Michigan Press, Ann Arbor, Mich (1946).
13. Reese, L.C. and Matlock, H. \Non-dimensional so-lutions for laterally loaded piles with soil modulus assumed proportional to depth", Proc. 8th Texas Conf. on Soil Mechanics and Foundation Engineering, Austin, Tex., pp. 1-23 (1956).
14. Davisson, M.T. and Gill, H.L. \Laterally loaded piles in a layered soil system", Journal of Soil Mech. and Found. Div., 89(3), pp. 63-94 (1963).
15. Matlock, H. \Correlations for design of laterally loaded piles in soft clay", Proc. 2nd Oshore Technology Conf., Houston, pp. 577-594 (1970).
16. Reese, L.C. and Welch, R.C. \Lateral loading of deep foundations in sti clay", Journal of Geotech. Engrg. Div., 101(7), pp. 633-649 (1975).
17. Obrzud, R.F. \On the use of the hardening soil small strain model in geotechnical practice", Numerics in Geotechnics and Structures (2010).
18. Movemen, G.R. and Martin Chen, C.Y. \Response of piles due to lateral slope", Computer & Structures, 83 (2005).
19. Eslami, A., Tajvidi, I. and Karimpour-Fard, M. \E-ciency of methods for determining pile axial capacity-applied to 70 cases histories in Persian gulf northern shore", IJCE, 12(1), pp. 45-54 (2014).
20. Ashour, M., Pilling, P. and Norris, G. \Lateral be-havior of pile groups in layered soils", Geotechnical and Geoenvironmental Engineering, 130(6), pp. 580-592 (2004).
21. Maleki, M. and Ansari, F. \Numerical analysis of interaction between tunneling excavation and Adja-cent structures' foundation in urban environments", Proceedings of the Sixth Iranian Tunneling Conference (2003).
22. Nourzad, R. and Saghaei, Ch. \Evaluation of bat-ter micropiles' seismic behavior", Proceedings of the Fourth National Congress on Civil Engineering (2008).
23. Hosseinzadeh Attar, I. and Fakharian, K. \Inuence of soil setup on shaft resistance variations of driven piles", Case study, International Journal of Civil Engineer-ing, Transaction B: Geotechnical EngineerEngineer-ing, 11(2), pp. 4-5 (2013).
Biographies
Pejman Vahabkashi received a BS degree in Civil Engineering, and MS and PhD degrees in Geotechnical Engineering, from Amir Kabir University of Technol-ogy (AUT), Iran, in 1995, 1998 and 2013, respectively. He was member of a specialized compilation committee of the Iran National Building Code (structural concrete design and construction specication) for two terms, and currently teaches civil engineering courses in
uni-versities and institutes. His research interests include pile behavior, soil and structure interaction and bearing capacity of shallow and deep foundations.
Alireza Rahai received a BS degree in Civil En-gineering, in 1975, from Amir Kabir University of Technology (AUT), Iran, an MS degree in Concrete & Prestressed Concrete Structures from CHEC, Paris, France, in 1977, and a PhD degree in Concrete Struc-tures from the University of Paris, France, in 1979. He is currently President of Tehran Polytechnic, Iran, and Professor in the Civil Engineering Department of that institution. His research interests include structural concrete elements behavior and nonlinear analysis and seismic performance of reinforced concrete members.