Contents lists available atScienceDirect
Marine Policy
journal homepage:www.elsevier.com/locate/marpol
Using collective intelligence to identify barriers to teaching 12
–
19 year olds
about the ocean in Europe
Géraldine Fauville
a,⁎, Patricia McHugh
b, Christine Domegan
c, Åsa Mäkitalo
a, Lene Friis Møller
d,
Martha Papathanassiou
e, Carla Alvarez Chicote
f, Susana Lincoln
g, Vanessa Batista
h,
Evy Copejans
i, Fiona Crouch
j, Susan Gotensparre
k aDepartment of Education, Communication and Learning, University of Gothenburg, Sweden bWhitaker Institute, National University of Ireland Galway, IrelandcMarketing Discipline, J.E. Cairnes School of Business & Economics, National University of Ireland Galway, Ireland dDanish Shellfish Centre, DTU Aqua, National Institute of Aquatic Resources, Denmark
eHellenic Centre for Marine Research, Greece fSUBMON, Spain
gCEFAS Centre for Environment, Fisheries and Aquaculture Science, United Kingdom hCiência Viva, Portugal
iFlanders Marine Institute, Belgium
jMarine Biological Association, United Kingdom
kDepartment of Biological and Environmental Sciences, University of Gothenburg, Sweden
A B S T R A C T
Since the degradation of the marine environment is strongly linked to human activities, having citizens who appreciate the ocean's influence on them and their influence on the ocean is important. Research has shown that citizens have a limited understanding of the ocean and it is this lack of ocean literacy that needs to change. This study maps the European landscape of barriers to teaching 12–19 year olds about the ocean, through the ap-plication of Collective Intelligence, a facilitation and problem solving methodology. The paper presents a meta-analysis of the 657 barriers to teaching about the ocean, highlighting how these barriers are interconnected and influence one another in a European Influence Map. The influence map shows 8 themes: Awareness and Perceived knowledge; Policies and Strategies; Engagement, formal education sector; the Ocean itself; Collaboration; Connections between humans and the ocean and the Blue Economy, having the greatest influence and impact on marine education.“Awareness and Perceived knowledge”in Stage 1, exerts the highest level of overall influence in teaching 12–19 year olds about the ocean. This map and study serves as a roadmap for policy makers to implement mobilisation actions that could mitigate the barriers to teaching about the ocean. Examples of such actions include free marine education learning resources such as e-books, virtual laboratories or hands-on experiments. Thus, supporting educators in taking hands-on the challenge of helping our youth realise that the ocean supports life on Earth is essential for education, the marine and human well-being.
1. Introduction
The ocean, covering more than 70 per cent of the Earth, plays several crucial roles that support the livelihood of humans, such as providing oxygen, food, pharmaceutical compounds, jobs and reg-ulating the Earth's climate[11]. The ocean supports life on Earth and is essential to human well-being. However, the ocean is showing sig-nificant signs of change as a result of human activities. The average temperature of the ocean is increasing, while its chemistry is modified by the large amount of CO2dissolving in seawater[26]. The majority of
fish stocks contributing tofish catch are either fullyfished or overfished [15]. Moreover, the increasing social and economic pressures from the exploding human population has led to important alteration of marine habitats [27] and eutrophication of ecosystems due to agricultural nutrient runoff[22].
The increasing modification, destruction and pollution of the ocean subsequently threatens humankind by putting at risk all the services and goods we benefit from and depend upon. In other words, as ex-pressed by Earle[12]“if the sea is sick, we’ll feel it. If it dies, we die. Our future and the state of the oceans are one”(p.xii). The degradation
https://doi.org/10.1016/j.marpol.2018.01.034 ⁎Corresponding author.
of the marine environment has direct impact on citizens and can be partially attributed to the lifestyle choices made by citizens. For this reason, marine environmental issues can be regarded as social issues [24]and citizen involvement is essential[16]. This role played by ci-tizens in relation to marine environmental issues was stated as such in the European Marine Board position paper.
“Preparing an entire community for a closer relationship with the sea is rewarding for the marine research community and science policy-makers as a more informed public will better understand and support investments in ocean science and be better aware of the need to sustainably manage vitally important marine ecosystems.” ([14], p. 179),
To foster and mobilise citizenry involvement in marine environ-mental issues, citizens are encouraged to understand the ocean's infl u-ence on them and their influence on the ocean. In other words, an ocean literate citizen can better understand the causes and consequences of marine environmental issues, make well-informed choices in their ev-eryday lives and contribute to public debate in a participative democ-racy[7].
Since the early eighties, a handful of researchers have been inter-ested infinding out how familiar students and other citizens are with the marine environment. Theirfindings provide evidence that citizens are often unfamiliar with ocean science and marine-related environ-mental issues (e.g[1,2,13,19,21,28].).
This lack of ocean literacy has been partially attributed to the lim-ited marine education taking place in schools[6,20,25]. Education has a key role to play in fostering our appreciation of the importance of the ocean, our understanding of our own responsibility in its destruction and our awareness of the relevance of its protection. Thus, it is key for education stakeholders to have a good understanding of the challenges encountered in education to implement marine science. The under-standing of the challenges is essential in order to develop strategies to overcome them and provide marine science with the place it deserves in our schools.
In this study, a Collective Intelligence (CI) methodology (see below) has been used in eight European countries to map the European barriers to teaching 12–19 year olds about the ocean. After running eight na-tional CI consultations, a meta-analysis was conducted and is reported in this paper. By contributing to improving education stakeholders’ awareness and understanding of the challenges of marine education, this paper provides tools for decision-makers to address this problem and develop applicable solutions to this education problem. This re-search is conducted in the context of the Sea Change project, funded by EU's Horizon 2020 Framework Programme for Research and Innovation. The Sea Change project is a 3-year project that aimed to establish a fundamental “Sea Change” in the way European citizens view their relationship with the sea, by empowering them, as Ocean Literate citizens, to take direct and sustainable action towards a healthy ocean, healthy communities and ultimately a healthy planet (see sea-changeproject.eu).
2. Method andfindings 2.1. Collective Intelligence
Collective Intelligence (CI), also known as Interactive Management, is a methodology gathering stakeholders around a given complex issue in order to develop a collective ground for thinking and working to-gether leading to the production of an effective framework for action [30,31]. Moreover, CI is a facilitation and problem-solving method that has been previously used to address issues, such as promoting world peace [8], improving tribal governance process in Native American communities[3,4]and reducing the threat of antibiotic resistance as a quality of life problem[10].
In the context of the Sea Change project, the CI methodology was
used to consult with education stakeholders. Together, these stake-holders established a deeper understanding of the barriers to teaching 12–19 year olds about the ocean, and identified solutions for over-coming these barriers (although the solutions are not discussed here as they are outside of the scope of this paper). The CI method used in this study is two-fold. First, national CI consultations took place in eight countries (Belgium, Denmark, Greece, Sweden, Ireland, Portugal, Spain and UK). Then, the data from the eight consultations underwent a meta-analysis. The national CI consultations and the European meta-analysis are described below.
2.2. Step 1: National CI consultations
In this study, a stakeholder is defined as“any group of individuals who can affect or is affected by creating an ocean literate population”. Three types of stakeholders were invited to join the consultation:
•
Incumbents (e.g. governmental departments of education),•
Regulating agencies (e.g. state bodies that sanctions the educationcurriculum)
•
Challengers (e.g. organisations offering informal education) [18,23].A total of 257 education stakeholders were involved in the eight European CI consultations.
Each consultation was run in the local language, while the national reports were written in English to allow for exchanges and meta-ana-lysis in a common language.
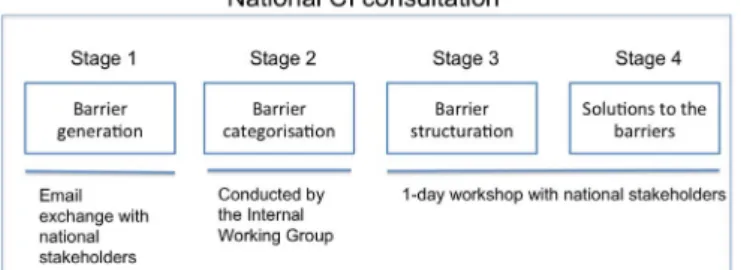
The national consultations included four stages (Fig. 1). The end-result was a roadmap of barrier aggravation pathways, their inter-connections and a range of options to solve the issues at stake. As previously mentioned this paper focuses on the barriers generated by stakeholders rather than on the solutions.
In Stage 1, the education stakeholders were invited to provide maximum five barriers - together with clarification sentences - via email, as a response to the trigger question“What are the barriers to teaching 12–19 year old students about the ocean?”. A number of starter phrases, (e.g. failure to, inability to, lack of) were provided to facilitate barrier generation. In total, the education stakeholders across the eight countries generated 657 barriers.
During Stage 2, the barriers were categorised. In each country, the national CI facilitation team started by placing eight of the collected barriers separately on boards or on walls. All the following barriers were compared with these initial eight barriers in a process called paired comparison. Barriers, which were conceived as similar to one another were grouped. As soon as a group included five barriers, it become a category that was named by the CI facilitation team. In total, 71 categories were generated across the eight countries.
Stages 3 and 4 took place during a one-day consultation workshop with the stakeholders involved in Stage 1.
In Stage 3, the stakeholders were re-acquainted with the barriers they individually came up with in Stage 1 and the categories created in stage 2. They were also given the opportunity to review barriers and
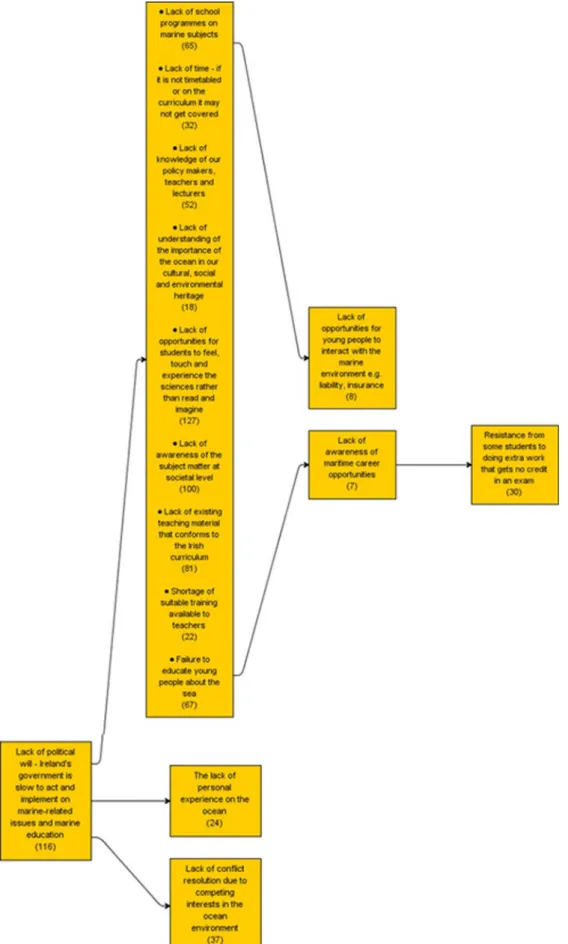
categories. If the stakeholders felt a barrier was better suited in another category then they were given an opportunity to move it. Although, any amendments had to be discussed and agreed upon within the group. This completed the categorisation process. Stakeholders then voted for the most important barrier in each category. In each national con-sultation, the barriers receiving the highest votes (15 in Ireland, 11 in Sweden, 12 in Belgium, 12 in Denmark, 12 in Greece, 11 in Spain, 11 in Portugal, and 11 in the United Kingdom) were entered into the Interpretive Structural Modelling (ISM) software. The software pro-duced a series of relational questions, such as “Does Barrier A sig-nificantly aggravate Barrier B?”that were asked to the stakeholders. A vote took place and the decision was entered in the software. This continued until all relational barriers were voted for and a structural map was generated. All the structural maps are provided inAppendix. Fig. 2, the Swedish structural map, illustrates how these maps should be read.
In Stage 4, the stakeholders were divided into smaller groups and asked to reflect over “What are the options for overcoming the bar-riers?”. The whole group reconvened in order to describe and comment the solutions created in each group. In total, 316 solutions were sug-gested (not described here). Finally, a vote took place by the stake-holders to highlight the most feasible and impactful solutions generated to overcoming barriers to teaching 12–19 year olds about the ocean in each category.
2.2.1. Findings from Step 1
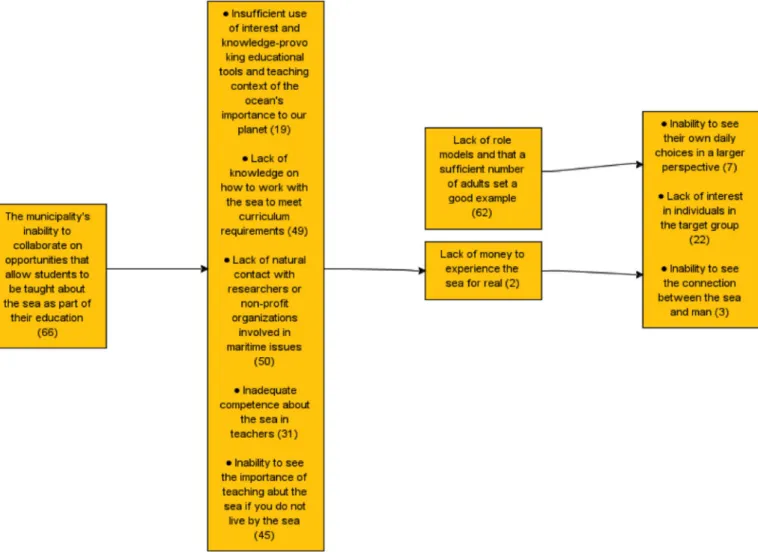
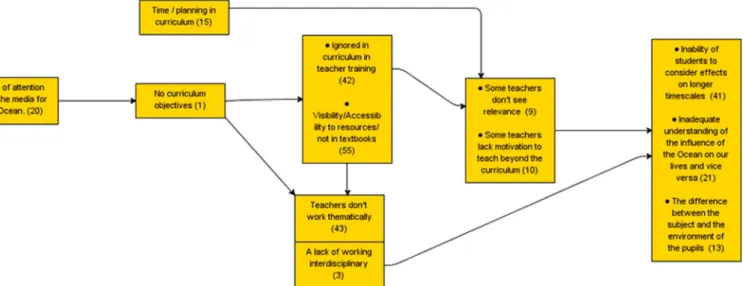
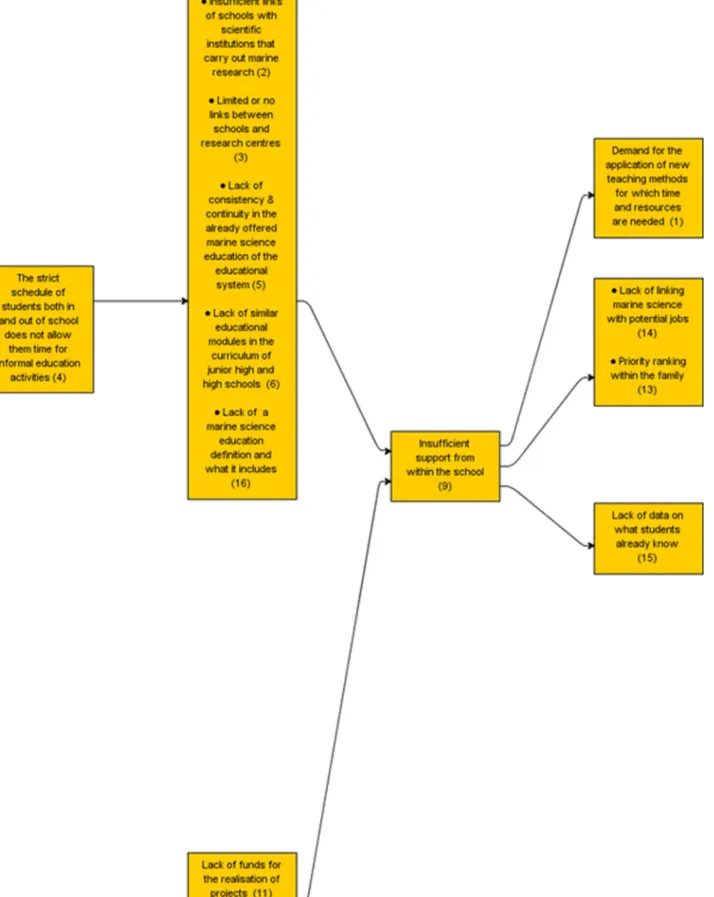
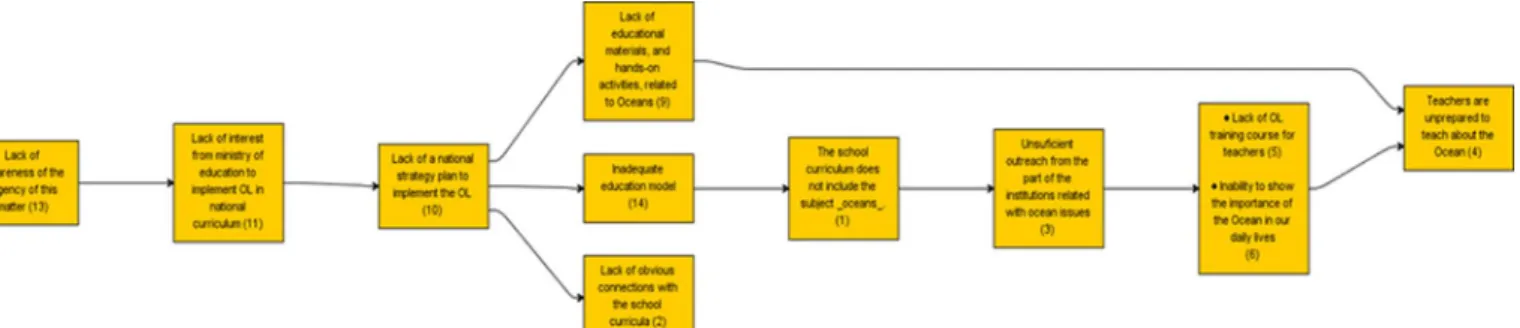
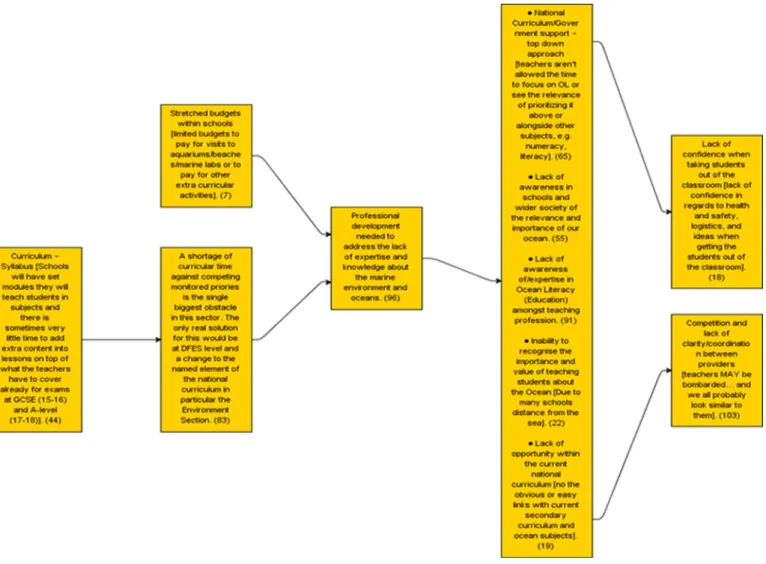
Each national CI consultations resulted in a structural map. The Swedish structural map (Fig. 2) is given as an example. The other structural maps are in theAppendix section.
The above structural map (Fig. 2) is read from left to right. The arrows indicate that the barriers on the left significantly aggravate (make worse) the barriers to the right. Barriers that are grouped to-gether in one box are reciprocally inter-related and they significantly aggravate one another. Two different barrier aggravation pathways can be followed in this map, with directional arrows indicating aggravating relations and both these pathways are described below.
In the first barrier aggravation pathway, the “municipality's in-ability to collaborate…”(barrier no 66) is the main aggravator and aggravates all of the remaining barriers in this path. The municipality's inability to collaborate significantly aggravates the barriers 19, 49, 50, 31, 45. These barriers go on to significantly aggravate barrier 2. While this barrier goes on to significantly aggravate a set of barriers (7, 22 and 3) which are reciprocally inter-related and significantly aggravate each other.
In the second barrier aggravation pathway, the barrier 62“Lack of role models and that a sufficient number of adults set a good example”
also significantly aggravates the reciprocally inter-related set of barriers 7, 22, and 3.
Fig. 2.Structural map from the Swedish CI consultation. The numbers in brackets represent the original number that the barrier received by the facilitation team as a way to track individual barriers more easily.
2.3. Step 2: Meta-analysis of the eight national consultations 2.3.1. Meta-categories and themes
Across the eight national consultations, 657 barriers were created. The researchers performed a paired comparison with all these barriers in order to find commonalities and create meta-categories and over-arching themes. Four or more barriers grouped together formed a meta-category1named by the researchers based on the ideas expressed by the barriers. In total, 26 meta-categories were created and a description sentence was provided for each meta-category (Table 2).
Afterwards, the meta-categories conveying similar meanings were clustered into another higher hierarchical level called themes. In total eight themes were formed. An average influence score was attributed to each of the eight themes, based on the individual influence score (see below) of each of the barriers belonging to the themes. The influence score of the themes allowed to create the influence map (see below).
In addition, the researchers analysed the eight national structural maps. As described above, each structural map showed the pathway of aggravation between the most voted barriers. In total, these eight structural maps included 95 barriers. For each of these barriers, a series of scores were calculated[5,9]:
•
Position: The barriers in the rightmost position received a position score of 1, while the position score of the other barriers increased by one along with a more left position.•
Antecedent: the number of barriers situated to the left of a particular barrier. This score is a measure of the number of barriers that ag-gravate this particular barrier.•
Succedent: the number of barriers situated to the right of a given barrier. This score is a measure of the number of barriers that it aggravates.•
Net succedent/antecedent (Net SA): calculated by subtracting the antecedent score to the succedent score.•
Influence (Position + Net SA): the sum of the position score and the Net SA.In order to illustrate these scores,Table 1provides the value for two barriers from the Swedish structural map. At the end of this process, each of the 95 barriers included in the national structural maps ended up with a series of scores similar toTable 1.
2.3.2. Findings from Step 2
2.3.2.1. Themes and Meta-categories. Table 2presents the eight themes, the meta-categories along with examples of barriers included in each of them.
The theme “Awareness and perceived knowledge” includes the meta-categories Ocean literacy andOcean knowledge. The 10 barriers referring to a lack of awareness of the concept of ocean literacy[7]or its relevance for our society were gathered in the meta-categoryOcean literacy. The 33 barriers gathered underOcean knowledgerelate to the lack of or partial knowledge about the ocean as reported also by several studies on the public's awareness of the ocean (e.g[19].;[29]).
The theme“Policies and strategies”includes two meta-categories, namelyFundingandGovernance. The meta-categoryFundingincludes 20 barriers related to the lack of money for resources and funds to ex-perience the marine environment. The 34 barriers falling under Governancerefer to the lack of support from local and national autho-rities to incorporate ocean issues in the school curriculum.
The theme “Engagement” includes four meta-categories Interest, Distractions,CommunicationandHands-on. The seven barriers inInterest refer to a lack of interest of ocean topics by teachers and students. In Distractionsare gathered 22 barriers related to the interferences coming from the social environment that distract students from the marine environment and affect their engagement toward it. The meta-category Communication includes 22 barriers associated with the difficulty to reaching out to the targeted audience in their own language and through the right channel. Finally, 15 barriers fall underHands-onas they address the lack of hands-on activity available to student.
The theme “Formal education sector” includes eight meta-cate-gories;Teaching,Field trip,Interdisciplinary,Equipment,School Culture, Curriculum, Time and Teaching material. A total of 75 barriers were gathered under the meta-categoryTeaching. These barriers address the problem linked to the inadequate teaching methods used to teach about the ocean, the shortage of teacher training courses and the lack of motivation and knowledge about the marine environment among tea-chers. The meta-category Field trip includes 26 barriers addressing concerns and difficulties experienced by teachers and students during field trips. Nine barriers were clustered in Interdisciplinarityas they highlighted the lack of interdisciplinary work among teachers. In Equipment, we can find 10 barriers related to the lack of adequate equipment in school, despite the demand for it. Thirteen barriers highlighted the obstacles originated from the school management and were thus gathered underSchool culture. The meta-categoryCurriculum congregate 63 barriers addressing the fact that curricula are restricted and do not include ocean topics. Time includes 30 barriers related to the scarcity of time available in the curricula to include ocean subjects. The last meta-category in this theme isTeaching materialand gather 36 barriers related to the fact that there is not enough teaching material and the material existing should be improved.
The theme“The Ocean itself”includes two meta-categories, Access andOcean Complexity. Thirty barriers referred to the access to the ocean and how the physical location along with socio-economic components influences one's possibility to reach the ocean. The 20 barriers included inOcean Complexityhighlight the complexity of the ocean and how this inherent complexity challenges people's ability to get an overview of the ocean system.
The theme“Collaboration”is comprised of the following three ca-tegories,External programmes,Informal educationandPartnerships. In the External programmesare clustered 17 barriers that addressed both the abundance and lack of external programmes offering marine education. The 13 barriers constituting the meta-categoryInformal educationrelate to the lack of marine activities offered in informal education and marine teaching centres. The last meta-category Partnerships, includes 14 barriers addressing the lack of connection between schools and scientific institutions.
The theme“Connections between humans and the ocean”includes Personal Experience, Culture and Everyday life as meta-categories. Personal Experience includes 13 barriers dealing with the lack of Table 1
Examples of scores calculated for two barriers from the Swedish structural map.
Barriers Position Antecedent Succedent Activity Net SA Influence
Lack of money to experience the sea for real 2 7 3 10 −4 −2
Inadequate competence about the sea among teachers 3 6 8 14 2 5
1A category gathers national barriers, created during Stage 2 of the national CI
con-sultation, which presented similarities. A meta-category gather barriers across the eight countries presenting similarities during the meta-analysis.
personal experience with the ocean. The meta-categoryCultureincludes 30 barriers pointing at the citizens’inability to understand the cultural and societal importance of the ocean. TheEveryday Lifemeta-category comprises 14 barriers addressing people limited ability to understand the importance of the ocean in their everyday life.
Finally, the theme “Blue Economy” is composed of the
meta-categories Marine CareersandIndustry. Marine careersis made of 19 barriers referring to the lack of awareness of the different potential career linked to the ocean such as marine educators. The meta-category Industryincludes 15 barriers dealing with competing interests in the ocean environment.
Table 2
This table present the eight themes with their average influence score. A description of the theme is provided along with the categories falling under each theme. For each meta-category a barrier is given as example. The asterisk next to the barrier means that this barrier was one of the most-voted ones. When the example given is not a more-voted one, it means that none of the barriers in the meta-category was part of the most-voted.
Theme Description of the theme Meta-categories Example of barriers Awareness and perceived
knowledge (avg. inf: 7)
Barriers that relate to the concept of Ocean Literacy (OL): either lack of understanding of the concept or some of the elements of OL.
Ocean Literacy Inability to recognise the importance and value of teaching students about the ocean.
Ocean Knowledge The sea is considered as an inexhaustible and unalterable resource for its use. It is only considered superficially, but its internal processes are unknown.
Policies and strategies (avg. inf: 6,31)
Policies and strategies affect how schools are run Funding Lack of money to experience the sea for real*
and the school budgets. Governance The municipality's inability to collaborate on opportunities that allow students to be taught about the sea as part of their education*
Engagement (avg. inf: 5,2) Barriers relating to the importance of engaging students and speaking their language to increase interest and awareness of the ocean.
Distraction Lack of linking marine science with potential jobs*
Communication Lack of role models and that a sufficient number of adults set a good example*
Interest Lack of awareness of the urgency of this matter*
Hands-on Lack of opportunities for students to feel, touch and experience the sciences rather than read and imagine* Formal education sector (Avg.
Inf. 3,43)
All of the barriers that originate from the formal education sector.
Interdisciplinarity A lack of working interdisciplinary*
Field trip Lack of opportunities for young people to interact with the marine environment e.g. liability, insurance*
Time Time / planning in curriculum*
Equipment Big demands for equipment*
Teaching Shortage of suitable training available to teachers*
Curriculum The school curriculum does not include the subject
“oceans”*
School culture Lack of consistency & continuity in the already offered marine science education of the educational system*
Teaching material Little visibility/accessibility to resources - not in textbooks*
The ocean itself (Avg. Inf.: 3,33)
The very nature of the ocean makes it difficult to experience or understand.
Access The sea (itself is a barrier)*
Ocean complexity Lack of systemic vision of the ocean Collaboration (Avg. Inf.: 2,2) Collaboration between different marine education
actors.
Informal education Insufficient support from within the school*
Partnerships Lack of funds for the realisation of projects*
External programmes Insufficient outreach from the part of the institutions related with ocean issues*
Connection between humans and the ocean (Avg. Inf.: −2,5)
It is about how the ocean matters to both individuals and society.
Personal experience The lack of personal experience on the ocean*
Everyday life Inability to show the importance of the Ocean in our daily lives*
Culture Failure to educate young people about the sea* Blue Economy (Avg. Inf.:−3) The barriers all relate to Blue Society, which is the
long-term strategy to support sustainable growth in the marine and maritime sectors as a whole.
Industry(imp: 11) Lack of conflict resolution due to competing interests in the ocean environment*
Marine career(mareer) (imp: 0)
Lack of awareness of maritime career opportunities*
2.3.2.2. European influence map of the barrier themes. The European influence map of barrier themes was generated to show the paths of influence across the eight higher-order themes (Fig. 3). The influence score of the eight themes were computed. The influence map should be read from left to right –with themes to the left having more overall influence, in comparison to the themes to the right[9]influence on teaching 12–19 year olds about the ocean.
The European influence map present the eight themes from highest (stage 1) to lowest influence (stage 6). This means the“Awareness and perceived knowledge” theme (stage 1) exercises the highest level of overall influence to teaching 12–19 year olds about the ocean. The barriers within this category received an average influence score of 7.0, which means that these barriers are significant influencers on all of the remaining categories within the six stage influence map.“Awareness and perceived knowledge”is made up of two meta-categories,“Ocean Literacy”and“Ocean knowledge”(Table 2).
The theme that exercises the lowest level of influence for teaching 12–19 year olds about the ocean were“Connections between humans and the ocean”and“Blue economy”(stage 6). The barriers within the theme “Connections between humans and the ocean” received an average influence score of−2.5. A negative average influence score means that the category exerts no influence; therefore all of the barriers within the previousfive stages influence these barriers.“Connections between humans and the ocean” is made up of three categories;
“Personal Experience”,“Culture”and“Everyday Life”(Table 2). The barriers within the theme“Blue economy”received an average influence score of −3.0. Since the theme has a negative average in-fluence score it exerts no influence; therefore all of the barriers within the previousfive stages influence these barriers. There are two cate-gories within the Blue economy higher-order barrier themes;“Mareer” (Marine career) and“Industry”(Table 2).
3. Discussion
Research has shown that citizens around the world seem to present a limited understanding of the importance of the ocean and its func-tioning. This lack of knowledge has been partly attributed to the limited marine education effort taking place in schools[6,20,25]. In order for education stakeholders around Europe to address this challenge, they needfirst to have a strong understanding of the barriers marine edu-cation is facing. The objective of this innovative study was to draw a pan-European portrait of these barriers.
This study not only reveals the barriers to teaching 12–19 year olds about the ocean but also highlights how European education stake-holders envision how these barriers are connected and influence each other. This new understanding of the challenges faced by marine edu-cation and their potential solutions are drawn from the expertise held by the education stakeholders and their collaboration during the na-tional consultations. In other words, Collective Intelligence allowed the development of a holistic understanding of the problem, and the for-mulation a set of feasible solutions matched to the complexity of the problem and the national realities.
The influence map can serve as a roadmap for policy makers to implement successful mobilisation actions that will mitigate the bar-riers to teaching 12–19 year old about the ocean. Mitigation actions targeting the theme to the left of the influence map (e.g.“Awareness and perceived knowledge”) (Fig. 3) are more likely to have a stronger impact on the overall system of barriers, while relieving pressure on the barriers belonging to the themes on the right (e.g.“Blue economy”). This is due to the fact that the themes on the left of any given theme significantly aggravate the ones situated to the right side. Thus, mobi-lisation actions overcoming barriers in the“Awareness and perceived knowledge”theme, that is, to focus on“lack of awareness of the defi -nition of ocean literacy or its relevance for our society” could have considerable impact on more 12–19 year olds being taught about the
ocean and may have a positive effect on barriers located in themes toward the right of the map, such as“Policies and strategies”.
It is important to be aware that this influence map is not to be considered as an action plan, since other factors may come into play when deciding on actions to be taken. For instance, it is not necessary to address“Awareness and perceived knowledge”first, if there is an im-mediate opportunity, for example, to address the“Policies and strate-gies”theme (stage 2). The map suggests, however, the chance of suc-cessful policies might be greater if “Awareness and perceived knowledge” actions were implemented at the same time. No matter where the initial action is taken, the map can advise on the possible impact of mobilisation actions, as well as barriers that will have an effect on their success. The influence map constitutes an invaluable planning tool as it“portrays a complex, dynamic, and mutually inter-related set of barriers, reflecting pluralistic values, knowledge, experi-ences, and expertise”([9], p. v).
The European influence map in Fig. 3 shows that 8 themes: awareness and perceived knowledge; policies and strategies; engage-ment, formal education sector; the ocean itself; collaboration; connec-tions between humans and the ocean and the blue economy, have the greatest influence and impact on marine education.“Awareness and perceived knowledge” in Stage 1, exerts the highest level of overall influence in teaching 12–19 year olds about the ocean.
Awareness and perceived knowledge of the oceans can be addressed by teachers through the use and application of free marine education learning resources, such as e-books, virtual laboratories or hands-on experiments in their practices. However, addressing ‘Awareness and perceived knowledge’among teachers may incur challenges as teachers are limited by the curriculum, resources and time, each of which Sea Change and other marine organisations have considered and produced options and resources to overcome such limitations.
First, teachers require trustworthy resources for their teaching. For example, Sea Change's Ocean Edge Directory2provides a collection of vetted educational resources and activities that are either available as downloadable products or can serve as an inspiration to help share ocean knowledge to any type of audience. This database includes both formal and informal learning resources developed in the framework of European projects, or projects with a European involvement. Another important database is the Bridge Ocean Education Teacher Resource Center,3 which is a collection of vetted online marine education re-sources It provides educators with a source of accurate information on marine related topics.
Second, educators willing to bring ocean science into their class-room might lack the appropriate marine knowledge and thus feel un-prepared to implement the resources found online in their teaching. Sea Change's Massive Open Online Course“From ABC to ABSeas: Ocean Literacy for All”4 can help prepare the teachers by informing them about ocean literacy and helping them incorporate marine education into educational practices. The goal of the MOOC is to help educators become familiar with the concept of Ocean Literacy and be able to use different pedagogical approaches for marine education (e.g. inquiry-based, hands-on).
Third, it might be difficult for educators to take on the challenge of implementing marine education if they do not feel supported and part of a community. There are dedicated marine education communities such as the European Marine Science Educators Association (EMSEA5) that assist and empower teachers and educators in marine science. EMSEA can also help teachers to build and sustain a network of col-leagues interested in teaching students about the ocean, who together, can share the benefits and challenges of incorporating the marine into
2http://www.seachangeproject.eu/campaign/sea-change-database. 3http://www2.vims.edu/bridge/search/scuttle.cfm.
4https://platform.europeanmoocs.eu/course_from_abc_to_abseas_ocean_liter. 5http://emsea.eu.
their teaching practices[17]. Through its yearly conferences and net-work, EMSEA promotes sharing educational resources between mem-bers of the ocean literacy community.
4. Conclusion
This paper described the numerous barriers that inhibit teaching
12–19 year olds about the ocean. Tackling“Awareness and perceived knowledge” will have the highest level of influence and impact on marine education. As illustrated above, there are resources, courses and network communities allocated to marine education to empower edu-cators. These options help educators take on the great challenge of helping the youth realise that the ocean supports life on Earth and thus is essential to human well-being.
Appendix A SeeFigs. A1–A7
Fig. A1.Structural map from the Belgian CI consultation.
Fig. A5.Structural map from the Portuguese CI consultation.
References
[1] R. Ballantyne, Young students' conceptions of the marine environment and their role in the development of aquaria exhibits, GeoJournal (2004) 159–163. [2] M.J. Brody, An assessment of 4th-, 8th-, and 11th-grade students' environmental
science knowledge related to Oregon's marine resources, J. Environ. Educ. 27 (3) (1996) 21–27.
[3] B.J. Broome, Collective design of the future: structural analysis of tribal vision statements, Am. Indian Q. 19 (1995) 205–228.
[4] B. Broome, The role of facilitated group process in community-based planning and design: promoting greater participation in Comanche tribal governance, in: L.R. Frey (Ed.), Innovations in group facilitation: Applications in natural settings, Hampton Press, Cresskill, NJ, 1995, pp. 27–52.
[5] B.J. Broome, L. Fulbright, A multistage influence model of barriers to group pro-blem solving: a participant-generated Agenda for small group research, Small Group Res. 26 (1) (1995) 25–55.
[6] Z. Castle, S. Fletcher, E. McKinley, Coastal and marine education in schools: con-straints and opportunities created by the curriculum, schools, and teachers in England, Ocean Yearbook 24 (2010), pp. 425–444.
[7] F. Cava, S. Schoedinger, C. Strang, P. Tuddenham, Sci. Content Stand. Ocean Lit.: A Report. Ocean Lit. (2005) (Retrieved March 25, 2015, from),〈http://www. coexploration.org/oceanliteracy/documents/OLit2004-05_Final_Report.pdf〉. [8] A.N. Christakis, Systems profile: the club of Rome revisited, Syst. Res. 4 (1) (1987)
53–58.
[9] C. Domegan, M. Devaney, P. McHugh, M. Hogan, Towards a blue society: collective design for a sustainable marine ecosystem. D2.4 global analysis of the SFS con-sultation process from a social sciences perspective, EU Sea for Society Project, 2014.
[10] S. Duane, C. Domegan, P. McHugh, M. Devaney, A. Callan, Tomorrow's world: collaborations, consultations and conversations for change, in: W. Wymer (Ed.), Best practices in marketing and quality-of-life research. Springer, London, 2015.
UNEP, Cheltenham, UK, 2017.
[12] S.A. Earle, Sea Change: a message of the ocean, Putnam, New York, 1995. [13] T.D. Eddy, One hundred-fold difference between perceived and actual levels of
marine protection in New Zealand, Mar. Policy 46 (2014) 61–67. [14] European Marine Board, Navigating the future IV Position Paper 20. Ostend,
Belgium, 2013.
[15] FAO, The state of worldfisheries and aquaculture 2016. Contributing to food se-curity and nutrition for all, Food and Agriculture Organization of the United Nations, Rome, Italy, 2016.
[16] G. Fauville, Digital technologies as support for learning about the marine en-vironment: steps toward ocean literacy (Doctoral thesis), University of Gothenburg, Sweden, 2017.
[17] G. Fauville, Evy Copejans, F. Crouch, European marine educators, unite! Europe's quest for a more ocean-oriented society and economy, Mar. Biol. 1 (2013) 30–31. [18] N. Fligstein, D. McAdam, Toward a general theory of strategic actionfields, Sociol.
Theory 29 (1) (2011) 1–26.
[19] H. Guest, H.K. Lotze, D. Wallace, Youth and the sea: ocean literacy in Nova Scotia, Canada, Mar. Policy 58 (2015) 98–107.
[20] M. Hoffman, D. Barstow, Revolutionizing earth system science education for the 21st century, Cambridge, MA, 2007.
[21] R.L. Jefferson, I. Bailey, D. d.′A. Laffoley, J.P. Richards, M.J. Attrill, Public per-ceptions of the UK marine environment, Mar. Policy 43 (2014) 327–337. [22] R.P. Kelly, M.M. Foley, W.S. Fisher, R.A. Feely, B.S. Halpern, G.G. Waldbusser,
M.R. Caldwell, Mitigating local causes of ocean acidification with existing laws, Science 332 (6033) (2011) 1036–1037.
[23] R.A. Layton, Formation, growth and adaptive change in marketing systems, J. Macromarketing 35 (3) (2014) 302–319.
[24] S.B. Longo, B. Clark, An Ocean of troubles: advancing marine sociology, Social. Probl. 63 (4) (2016) 463–479.
[25] D.A. McManus, S. Walker, B. Cuker, P. Goodnight, S. Humphris, P. Keener-Chavis, D. Reed, V. Robigou, J. Schubel, Center for Ocean Sciences Education Excellence 20 (COSEE): the report of a workshop sponsored by the National Science Foundation. Fig. A7.Structural map from the Greek CI consultation.
D.J. Dokken, K.J. Mach, M.D. Mastrandrea, T.E. Bilir, M. Chatterjee, K.L. Ebi, Y.O. Estrada, R.C. Genova, B. Girma, E.S. Kissel, A.N. Levy, S. MacCracken, P.R. Mastrandrea, L.L. White (Eds.), Climate Change 2014: Impacts, adaptation, and vulnerability. Part A: Global and sectoral aspects. Contribution of working group ii to thefifth assessment report of the intergovernmental panel on climate change, Cambridge University Press, Cambridge, United Kingdom and New York, NY, USA, 2014, pp. 411–484.
[27] J. Rockström, W. Steffen, K. Noone, Å. Persson, F.S. Chapin, E.F. Lambin, J.A. Foley, A safe operating space for humanity, Nature 461 (2009) 472–475.
[28] B.S. Steel, C. Smith, L. Opsommer, S. Curiel, R. Warner-Steel, Public ocean literacy in the United States, Ocean Coast. Manag. 48 (2) (2005) 97–114.
[29] The Ocean Project. 2011. America and the ocean. Retrieved fromhttp:// theoceanproject.org/reports.
[30] J.N. Warfield, Societal systems: planning, policy, and complexity, World Scientific, New York, NY, 1976.
[31] J.N. Warfield, An introduction to systems science, World Scientific, Singapore, 2006.