Sharif University of Technology
Scientia IranicaTransactions A: Civil Engineering www.scientiairanica.com
Research Note
Eect of step geometry and water quality on eciency
of cascade aeration
V. Rathinakumar
a, G. Dhinakaran
b;and C.R. Suribabu
b a. School of Civil Engineering, SASTRA University, Thanjavur, 613401, India.b. Center for Advanced Research in Environment, School of Civil Engineering, SASTRA University, Thanjavur, 613401, India. Received 11 April 2015; received in revised form 1 July 2015; accepted 25 August 2015
KEYWORDS Aeration; Eciency; Step geometry; Dissolved oxygen; Cascade.
Abstract. In this paper, the eect of step geometry with ve dierent tread values from 0.40 m to 0.60 m with an increment by 0.05 m, and three dierent types of water, namely potable, non-potable, and recycled water, on aeration eciency of stepped cascade aeration was studied. Detailed experimental investigations were carried out for dierent hydraulic loading rates of 0.005 m2/s to 0.035 m2/s. All the experiments were conducted
for nappe ow condition. Results revealed that the overall aeration eciency at standard conditions (E20) approaches the maximum for t=h = 4, number of steps were 12 with a
hydraulic loading rate of 0.02 to 0.025 m2/s for potable and non-potable water. In the case
of recycled water, maximum eciency was achieved for t=h = 3:67. Results also revealed that stepped cascade aeration was a very suitable option for enhancing DO content in treatment of waste water before discharging it to water bodies to save aquatic life. © 2016 Sharif University of Technology. All rights reserved.
1. Introduction
Aeration was found to be one of the important tech-niques employed in water and wastewater treatment process, which enabled supply of oxygen from gaseous phase to liquid phase. In the case of nappe ow, the energy dissipation occurs by the break-up of jet in the air. In the case of skimming ow, the ow is in an organized stream supported by the recir-culation uid. It was found from experiments that skimming ow occurred when the ratio of critical depth to the height of the step (dc=h) was greater
than 0.8 and smaller values of dc=h caused nappe
ow [1]. In stepped cascade system, water is permitted to fall on series of steps and during this process,
*. Corresponding author. Tel. +91 9944082810; Fax: +91 4362 264120
E-mail addresses: [email protected] (V. Rathinakumar); [email protected] (G. Dhinakaran); [email protected] (C.R. Suribabu)
bubbles are formed which lead to dragging of air from the atmosphere. Stepped cascade system was used to remove color and taste caused by volatile oil, carbon dioxide, hydrogen sulphide, and volatile organic compounds such as chlorine and methane in the potable water treatment process [2]. Stepped cascade ow is characterized by its large residence time, vibrant mixing, and substantial air bubble en-trainment. Fluctuation in turbulence acts next to air-water free surface and causes the air bubble en-trainment which is responsible for continuous tapping and releasing of air. It was observed that ow due to gravity played a vital role in the air entrainment process [3]. Experiments were carried out on stepped cascade aeration system to investigate the eect of air entrainment [4] and hydraulics of nappe ow [5], predict transition from nappe to skimming ow [6], and propose the condition for nappe ow [7]. Previ-ous research works, conducted by [8-17], focused on hydraulic aspects of cascade system and the existence of relationship between ow rate and step geometry
on aeration was reported. Appreciable results were obtained in the experiments conducted for removing the pollutants from grey water using cascade aer-ation and bio ltraer-ation. Good removal eciency of ions concentration and COD is witnessed in the experiments [18]. Experiments were also conducted to study the combinational eect of stepped cascade system with limestone trickling lter in removal of toxic matters like Polychlorinated biphenyls (PCB's), Petroleum products and Phenols [19]. An attempt at numerical modeling of stepped cascade with end sill and high roughness is made using Volume Of Fluid (VOF) multiphase ow model [20]. The application of stepped cascade along with trickling lter lled with thermo-stone removed the concentration of toxic matters in the range 0.074 nm-0.156 nm [21]. The stepped cascade system has become very versatile in recent years because of its speedy construction. It is also proved that the system is a cost eective aeration system in replenishing dissolved oxygen. From the available literature, it is understood that previous studies focused on hydraulic properties of water and step geometry. Hence, in the present work, eect of stepped cascade aeration on water quality, especially waste water after post-treatment, was considered. The adaptability of the cascade system in such situations was also studied.
2. Materials and methods
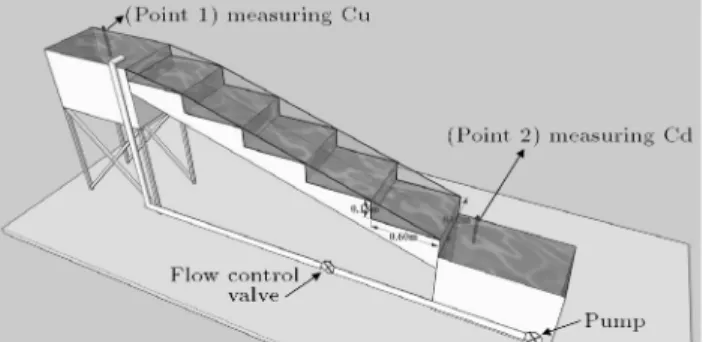
Experimental model for the rectangular stepped cas-cade aeration system consisted of two tanks, called stilling basin and collecting tank, tted on the up-stream and downup-stream sides, respectively. Both tanks were made up of steel. The size of the upstream tank was 0:60 m 1:20 m 1:0 m and downstream tank was 0:60 m 0:60 m 0:60 m. Both tanks were connected by a sloped waist arrangement made up of steel frame, on which RCC precast slab was placed to provide a rm base for construction of steps. Steps were constructed using brick masonry to reect the reality of the eld. Perspex sheets were used as side walls of the stepped cascade system to facilitate better visualization from outside when experiment was on. A 5 HP capacity monoblock pump was used to lift the water from the collection tank to the tank in the upstream side. A magnetic ow meter, capable of measuring 0.040 m3/s with an accuracy of 0.0001 m3/s,
was used to measure the rate of ow. Two dissolved oxygen meters (HANNA make - model HI 9146) were used to measure concentration of dissolved oxygen in the measuring locations (one at upstream tank and the other at downstream tank) of the stepped cascade system by inserting probes to a depth of 0.20 m [13]. The calibration of DO meters was daily done by air calibration method in ambient air conditions. Three
readings were taken at the upstream and downstream locations for each and every sample and average value was used for the analysis. The total height of the stepped cascade system used in the present work was 1.80 m. Experiments were conducted for three dierent qualities of water, namely Potable Water (PW), Non-Potable Water (NPW), and Recycled Water (RW). The water, collected from the Reverse Osmosis (RO) plant in SASTRA university campus, was designated as PW. The water quality parameters of PW were fullling its requirements. The water collected from the bore well of SASTRA university was named NPW. It had higher chloride content and total dissolved solids. However, BOD and COD of NPW were well within the permissible limit. The water collected from euent treatment plant was designated as Recycled Water (RW). It had higher values of water quality parameters exceeding permissible limit. For each and every type of water, readings were taken for two dierent heights of steps (0.15 m and 0.18 m) with ve dierent treads of steps (0.40 m, 0.45 m, 0.50 m, 0.55 m, and 0.60 m). In total, there were 210 trials performed in the present work. Potable and non-potable water was added with 10 mg/l of sodium sulte and 0.010 mg/l of cobalt chloride for the purpose of deoxygenation to maintain 1 mg/l of DO concentration. Since no reduction in DO concentration was observed in recycled water due to the addition of chemicals, no deoxygenation was performed as recycled water, collected from the euent treatment plant, contained higher TDS and surface agents. It retarded the process of deoxygenation even after the addition of Sodium Sulte. Figure 1 shows the experimental model used for the present research work. Table 1 lists the design parameters adopted in the experiment. Table 2 provides the chemical characteristics of dierent types of water used in conducted experiments. Taking the eect of temperature into account, the following equation was used to nd the aeration eciency at a standard temperature of 20C [22]. Table 3 provides the
calcu-lation of [dc=h] for the steps used in this experiment,
i.e. 0.15 m and 0.18 m for various hydraulic loading rates.
Figure 1. Experimental model for the laboratory stepped channel.
Table 1. Design parameters used in the experiment.
S. no Independent Range Dependent
01. Hydraulic loading rate (m2/s) 0.005, 0.01, 0.015, 0.02, 0.025, 0.03 and 0.035
Aeration eciency (E20)
02. Rise of each step (m) 0.15 and 0.18
03. Tread of each step (m) 0.60, 0.55, 0.50, 0.45 and 0.40 04. Width of the channel (m) 0.60
05. Total height of the system (m) 1.80 06. Number of steps 12 and 10 Table 2. Chemical properties of the used water. Parameter
Potable Water
(PW)
Non-Potable Water (NPW)
Recycled Water
(RW)
pH 7.5 8.77 9.2
Temperature (C) 26.2 28.2 29.3
TDS (mg/l) 30 1800 930
Salinity (mg/l) 102 670 1023
Chloride (mg/l) 81 385 120
DO (mg/l) 6.00 6.40 4.90
COD (mg/l) 10 12 170
BOD (mg/l) 0 2 65
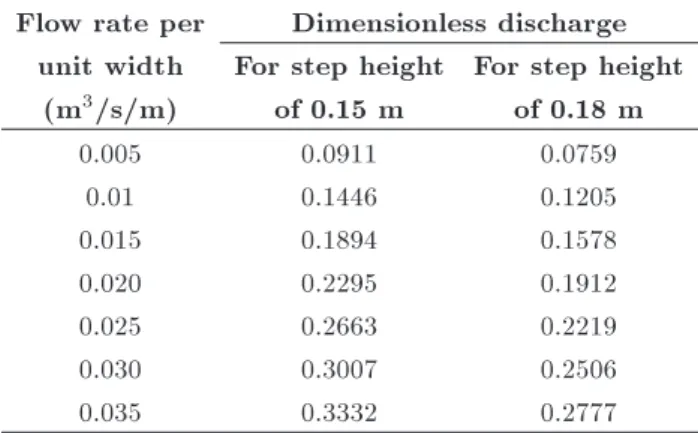
Table 3. Dimensionless discharges (dc=h) based on ow
per unit width and step height.
Flow rate per Dimensionless discharge unit width For step height For step height
(m3/s/m) of 0.15 m of 0.18 m
0.005 0.0911 0.0759
0.01 0.1446 0.1205
0.015 0.1894 0.1578
0.020 0.2295 0.1912
0.025 0.2663 0.2219
0.030 0.3007 0.2506
0.035 0.3332 0.2777
Oxygen transfer eciency (ET) for a hydraulic
structure at any temperature, T (C), was expressed
by the following equation: ET = [C[Cd Cu]
s Cu]; (1)
where:
ET Transfer eciency at actual water
temperature;
Cd Concentration of DO in the
downstream (mg/l);
Cu Concentration of DO in the upstream
(mg/l);
Cs Saturation concentration (mg/l).
E20=
h
1 (1 E)f1
i
; (2)
where E20is aeration eciency for 20C; f is exponent
described by:
1 + 0:02103(T 20) + 8:261x10 5(T 20)2; (3)
and T is ambient temperature inC.
Chanson (2002) proposed an equation for nappe ow condition, which was followed in the present research work and is given below:
dc
h
0:89
h L
; (4)
where: dc
h Dimensionless discharge; dc=
q2
w
g 1
3
Critical depth in a rectangular channel (m);
qw Hydraulic loading rate (discharge per
unit width)(m2/sec);
h Height of steps (m); L Length of steps (m).
3. Results and discussion 3.1. Eect of step geometry
The variations of overall aeration eciency (E20) with
respect to a non-dimensional parameter (dc=h) are
depicted in Figures 2-4 for the height of step = 0.15 m, and in Figures 5-7 for the height of step = 0.18 m, respectively. The variation of aeration eciency E20
with a non-dimensional parameter (dc=h) increases
with increase in (dc=h) up to certain values beyond
which it has shown reverse trend. It was applicable for both the heights of step of 0.15 m and 0.18 m. It might be due to the following reasons. A decline trend was observed in the aeration eciency when the ow was subjected to increased hydraulic loading rate and
Figure 2. Aeration eciency of potable water with respect to dc=h for 0.15 m of rise.
Figure 3. Aeration eciency of non-potable water with respect to dc=h for 0.15 m of rise.
Figure 4. Aeration eciency of recycled water with respect to dc=h for 0.15 m of rise.
Figure 5. Aeration eciency of potable water with respect to dc=h for 0.18 m of rise.
this could be due to transition from nappe to skimming ow and width of the channel. It was also seen that for a particular height of step, size of tread played a role in deciding about aeration eciency. Higher eciency was observed for smaller values of tread.
Figure 6. Aeration eciency of non-potable water with respect to dc=h for 0.18 m of rise.
Figure 7. Aeration eciency of recycled water with respect to dc=h for 0.18 m of rise.
Figure 8. Eect of step geometry on the overall aeration eciency.
Further increase of tread values showed a reverse trend in eciency. From the eect of step geometry, it was understood that increase in height of step from 0.15 m to 0.18 m resulted in reduction in eciency. It was due to increase in number of steps for lesser height of 0.15 m. Since more number of steps was used for 0.15 m height of step, aeration eciency got accelerated and was very much eective.
To understand the eect of step geometry on overall aeration eciency of stepped cascade aeration system, a typical example is explained in the following lines by taking the result of potable water. The results are discussed for a step tread of 0.60 m with heights of 0.15 m and 0.18 m, respectively, as shown in Figure 8. The results were compared for almost closer values of dc=h. For a ow rate of 0.009 m3/s, the aeration
eciency with step height of 0.15 m was found to be 0.62, whereas for step height of 0.18 m, it was found to be 0.28. This dierence in aeration eciencies due to step geometry is signicant. However, for the highest dc=h value, the eect of step geometry pronounces less
due to increase in hydraulic loading rate where ow is subjected to transition stage.
3.2. Eect of water quality
For potable water, the maximum eciency of 62% was observed for t=h = 4 with dc=h = 0:189 for 0.15 m
height of a step. It was also observed that for a hydraulic loading rate from 0.005 to 0.025 m2/s, the
aeration eciencies were good and further increase of ow led to transition zone; hence, there was a reverse trend. There was not much variation in aeration eciency from t=h = 4 to 3.33 and further reduction of these values showed a higher reduction in eciency which was due to decrease in tread values below 0.45 m where sucient space was not available for aeration process. In a similar sense, for t=h = 3 with a hydraulic loading rate of 0.005 m2/s, a minimum eciency of 15%
was observed. As the turbulence, directly related with velocity and spreading of water on step, was like thin lm over the larger area, the performance of cascade system for low hydraulic loading rate was found to be very low. In general, ow with lower velocity will lead to greater residence time of the cascade and will result in greater air transfer. But, the geometry of the cascade was unable to produce greater turbulence and hence lesser eciency. Improved performance of cascade systems was observed for hydraulic loading rate 0.01 m2/s and 0.015 m2/s. It was due to formation of
hydraulic jump within the tread and ultimately yielded sizable quantity of aeration. However, the eciency of cascade aeration signicantly improved when hydraulic loading rate increased to 0.02 m2/s and 0.025 m2/s.
By further increase in hydraulic loading rate to 0.03 and 0.035 m2/s, the eciency was found to be low
when compared with eciency for hydraulic loading rates of 0.02 m2/s and 0.025 m2/s. With increased
velocity of ow on the cascade, the residence time and aeration eciency decreased. It was evident from the above results that step geometry was optimized based on hydraulic loading rate and considered to be the main governing parameter in the design stage.
In the case of non-potable water with a height of step = 0.15 m, more aeration eciency was achieved for t=h = 4 and for other t=h values, the eciency was found to be less. Increase in dc=h up to 0.266
increased the aeration eciency for all t=h values and further increase in dc=h showed a reverse trend. It was
due to increased hydraulic loading rate. Also, similar trend was observed for a height of 0.18 m. Maximum eciencies of 56% and 47% were observed for heights of steps 0.15 m and 0.18 m, respectively.
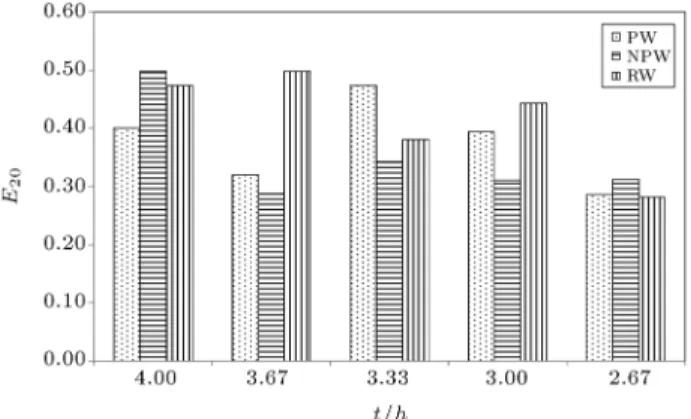
Figure 9. Eect of water quality on the overall aeration eciency.
Also, similar trend was seen in recycled water as non-potable water, but there was no much variation among eciencies of dierent t=h values. Except t=h = 2:22, for all the other t=h values, aeration eciency was above 30% and maximum eciency was 63% for a height = 0.18 m. For a height of step = 0.15 m, these values were falling between 46 and 57%. Hence, it was inferred that stepped cascade aeration system was eective in recycled water with addition of no chemicals and it was the eld reality. The aeration eciency of recycled water was found to be a little bit less than eciency of potable and non-potable water; it might be due to the reason that recycled water has sediments, whereas potable and non-potable water does not have this. To understand the eect of water quality on the overall aeration eciency, Figure 9 depicts the results of aeration eciency with respect to t=h values for a hydraulic loading rate of 0.03 m2/s. It was understood
from the results that water quality had eect on aeration eciency and was ranging from 10 to 20%, except for t=h = 2:67 (tread = 0.40 m and height = 0.15 m). It was also inferred that aeration eciency of recycled water under stepped cascade aeration system attracted considerable attention.
3.3. Eect of chemical properties of water on aeration eciency
From Table 2, it was observed that Total Dissolved Solids (TDS) and Salinity of the NPW and RW were high. Comparing the aeration performances of cascade systems for enhancing DO content of dierent types of water, potable water was found to be better than the non-potable and recycled water. It might be due to the reason that potable water was free from TDS and salinity, and hence it had better aeration. In case of PW, the minimum and maximum aeration eciencies were found to be 32 and 62%, respectively, which give an idea about the eectiveness of cascade system in enhancing DO. In case of NPW, these values ranged from 19% to 47% and reduction in eciency was due to higher values of TDS and salinity with dissolved
organic matter. In RW, the dierence between max-imum eciency (63%) and minmax-imum eciency (17%) was found to be more signicant than those in other two types of water. Better aeration eciency was achieved as no deoxygenation was performed for RW before the start of experiment. The initial DO concentration of RW ranges from 4 to 5 mg/l, whereas in cases of PW and NPW, the DO concentration has been set to a value from 1 to 2 mg/l by deoxygenation.
3.4. Comparison of the present results with earlier research
The predictive equation given by Nakasone [23] with combination of fall height, discharge, and tail water depth to analyze the aeration eciency was compared with our present work. Good agreement in results was not observed. This is due to the hydraulic properties adapted to that equation. The results of the present study were also compared with the results of an earlier study by Moulick et al. It was inferred from their results that aeration eciency was very high (from 0.8 to 0.9) compared with the present study and it might be due to the dierence in quality of water used and scale eect. Moulick et al. (2010) [15] studied a 3 m high stepped cascade system with step height value of 0.6 m, whereas in the present study, the total height of stepped cascade was restricted to 1.8 m with heights of 0.15 m and 0.18 m. Another equation, given by El-Monayeri (2011) [24], was also compared with the present study, which did not establish a good rapport with our results due to higher value of COD.
3.5. Statistical analysis
A regression analysis was made to analyze the results of the experiments, i.e. parameters like dc=h and
r=Cs, to calculate the aeration eciency (E20). All
the parameters considered in this equation are non-dimensional parameters, which will be useful to balance the equation E20. The measured aeration eciency was
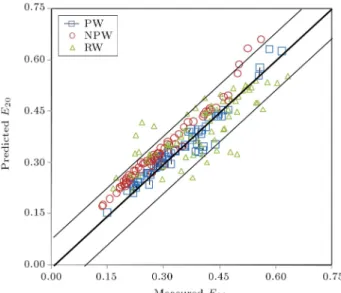
compared with values of Eqs. (5)-(7). Good agreement was found between the observed values and predicted values form the developed equation. In addition, condence level in the correlation was seen in Figure 10. It was also indicated in the comparison of measured and predicted values that they fell well below the upper and lower bound (10% of peak values) lines and hence results were found to be reliable.
From the obtained data for all the three types of water, keeping E20 as a dependent variable and
function of dc
h and Crs, the following equations were
developed for PW, NPW, and RW, respectively:
E20P W = 0:0119 + 0:0880dhc + 1:06Cr
s; (5)
E20NP W = 0:0175 + 0:0436dhc + 1:05Cr
s; (6)
Figure 10. Comparison of the measured and predicted E20 values.
E20RW = 0:0146 + 0:440dhc + 0:829Cr
s; (7)
dc
h = 0:04 to 0:44; and r
Cs = 0:80 to 1:10:
The above equations could be used to predict the aeration performance of the cascade system by slightly varying the geometry and hydraulic loading rates. From the detailed study, it was understood that the aeration eciency was governed by step geometry, hydraulic loading rate, and also quality of water. Stepped cascade aeration was found to be eective in enhancing DO in recycled water which has shown a positive sign for natural treatment of wastewater before discharging it to water bodies to save aquatic life.
4. Conclusions
From the detailed investigations carried out on rect-angular stepped cascade aeration system to study the eect of hydraulic loading rate, dc=h, height and tread
of step, and water quality, the following conclusions were obtained:
Increase of dimensionless discharge (dc=h) increased
the overall aeration eciency up to 0.266 and further increase showed a reverse trend which was due to the fact that ow approached transition condition with increased hydraulic loading rate;
The overall aeration eciency increased with in-crease in the number of steps in which better aeration process was on and vice versa;
The overall aeration eciency at standard condi-tions (E20) approached maximum for t=h = 4 and
number of steps were 12 with hydraulic loading rate of 0.02 to 0.025 m2/s for potable and non-potable
water. In the case of recycled water, maximum eciencies were achieved for t=h = 3:67 both for 0.15 m and 0.18 m as heights of step;
Overall aeration eciency was higher for recycled water among three types of water used. Hence it was concluded that stepped cascade aeration was very suitable for enhancement of DO content.
Acknowledgement
The authors wish to acknowledge the INCH division of Ministry of Water Resources, Government of In-dia, for the research funding it provided (Sanction No. 22/50/2010-R&D/405-414). Authors express their gratitude and sincere thanks to the Vice-Chancellor of SASTRA University for giving the permission to use the laboratory facilities in this research work.
Nomenclature
L Width of channel (m);
Cd Concentration of DO in downstream
(mg/l);
Cu Concentration of DO in upstream
(mg/l);
Cs Saturation concentration (mg/l);
dc Critical ow depth (m);
dc
h Dimensionless discharge; E Transfer eciency at water
temperature (%);
E20 Oxygen transfer eciency at 20C (%);
f Correction factor for temperature; g Acceleration due to gravity (m/s2);
h Height of the step (m);
KL Liquid lm coecient for oxygen;
Q Flow rate (m3/s);
qw Hydraulic loading rate (m3/m/s);
t Tread of the step (m); T Ambient temperature inC;
r Oxygen decit. Abbreviations
BOD Biological Oxygen Demand; COD Chemical Oxygen Demand; DO Dissolved Oxygen;
HP Horse Power; NPW Non-Potable Water;
pH Hydrogen ion concentration; PW Potable Water;
RW Recycled Water; TDS Total Dissolved Solids; VOC Volatile Organic Compounds.
References
1. Rajaratnam, N. \Skimming ow in stepped spillways", J. Hyd. Eng., 116(4), pp. 587-591 (1990).
2. Toombes, L. and Chanson, H. \Air-water mass transfer on a stepped waterway", J. Env. Eng., 131(10), pp. 1377-1386 (2005).
3. Chanson, H. \Hydraulic design of stepped spillways and downstream energy dissipaters", Dam Eng., 11(4), pp. 205-242 (2001).
4. Chanson, H. \Stepped spillway ow and air entrain-ment", Can. J. Civ. Eng., 20(3), pp. 422-435 (1993).
5. Chanson, H. \Hydraulics of nappe ow regime above stepped chutes and spillways", Aus. Civ. Eng., Trans. Inst. Eng., 36(1), pp. 69-76 (1994).
6. Chanson, H. \Prediction of transition
nappe/skimming ow on a stepped channel", J. Hyd. Res., 34(3), pp. 421-429 (1996).
7. Chanson, H. and Toombes, L. \Energy dissipation and air entrainment in stepped storm waterway-Experimental study", J. Irri. & Drge. Eng., 128(5), pp. 305-315 (2002).
8. Boes, R.M. and Hager, W.H. \Hydraulic design of stepped spillways", J. Hyd. Eng., 129(9), pp. 671-679 (2003).
9. Baylar, A. and Emiroglu, M.E. \Study of aeration eciency at stepped channels", Proc. Ins. Civil Eng., Water & Maritime Eng., 156(WM3), pp. 257-263 (2002).
10. Baylar, A. and Emiroglu, M.E. \Study of aeration performance of open channel chutes equipped with a ip bucket", Tur. J. Eng. & Env. Sci, 27, pp. 189-200 (2003a).
11. Baylar, A. and Emiroglu, M.E. \An investigation of eect of stepped chutes with end sill on aeration performance", Wat. Qual. Res. J. Can., 38(3), pp. 527-539 (2003b).
12. Baylar, A. and Emiroglu, M.E. \Self-aeration in smooth and stepped chutes", Int. J. Sci. and Tech., 1(2), pp. 105-113 (2006).
13. Baylar, A., Bagatur, T. and Emiroglu, M.E. \Aer-ation eciency with nappe ow over stepped cas-cades", Proc. Inst. Civ. Eng., Water & Maritime Eng., 160(WM1), pp. 43-50 (2007).
14. Baylar, A., Unsal, M. and Ozkan, F. \The eect of ow patterns and energy dissipation over stepped chutes
on aeration eciency", KSCE J. Civ. Eng., 15(8), pp. 1329-1334 (2011).
15. Moulick, S., Naresh, V.T., Singh, B.K. and Mal, B.C. \Aeration characteristics of a rectangular stepped cascade aeration system", J. Water Sci. & Tech., 61(2), pp. 415-420 (2010).
16. Rathinakumar, V., Dhinakaran, G. and Suribabu, C.R. \Assessment of aeration capacity of stepped cascade for selected geometry", Int. J. Chem. Tech. Research, 6(1) pp. 254-262 (2014).
17. Rathinakumar, V., Dhinakaran, G., Suribabu, C.R. and Velmurugan, P. \Experimental Investigation on performance of stepped cascade aeration", Asian J. App. Sci., 7(6), pp. 391-402 (2014).
18. Abbood, D.W., Mustafa, A.S. and Joudah, R.A. \Modication of grey water using combination of stepped cascade and bio ltration", J. Env. Sci. & Eng. B., 2, pp. 473-481 (2013).
19. Abbood, D.W., Baqer, A.M.T. and Jasim, E.A. \Marginal treatment using sludge recycling from com-bination of stepped cascade weir and Limestone trick-ling lter", World Academy of Sci. Eng. & Tech, Civ. and Env. Eng., 2(1) (2015).
20. Abbood, W.D. and Abood, H.H. \Multiphase ow model for 3D numerical model using ANSYS for ow over stepped cascade with end sill", World Academy of Sci. Eng. & Tech, Civ. and Env. Eng., 2(5) (2015).
21. Abbood, W.D., Baqer, A.T.M. and Jasim, E.A. \Re-moving of toxic matter from marginal water using combination of stepped cascade and trickling lter", World Academy of Sci. Eng. & Tech, Civ. and Env. Eng., 2(10) (2015).
22. Doiron, T. \20C - A Short history of the standard reference temperature for industrial dimensional
mea-surements", J. Res. Nat. Inst. of Stan. and Tech., 112(1), pp. 1-24 (2007).
23. Nakasone, H. \Study of aeration at weirs and cas-cades", J. Env. Eng. ASCE, 113(1), pp. 64-81 (1987)
24. Khalifa, A., Bayoumi, S. and El. Monayeri, O. \Math-ematical modeling of aeration eciency and dissolved oxygen provided by stepped cascade aeration", J. Water Sci. and Tech., 63(1), pp. 1-9 (2011).
Biographies
Vedhachalam Rathinakumar is a PhD candidate in the School of Civil Engineering at SASTRA University. He received his BE degree in Civil Engineering from SASTRA University and ME degree in Environmental Engineering from Anna University in 2005 and 2008, respectively. He works in the area of stepped cascade aeration.
Govindasamy Dhinakaran is a Professor in the School of Civil Engineering at SASTRA University. He received his BE in Civil Engineering from Bharathi-dasan University, ME degree from National Institute of Technology and PhD degree from Indian Institute of Technology Madras in Oshore Structures in 1988, 1990, and 2003, respectively. His research interests in-clude sustainable materials and materials in aggressive environment.
Conety Ravi Suribabu is a Professor in the School of Civil Engineering at SASTRA University. He received his BE degree in Civil Engineering from Bharathidasan University, ME degree from Anna University, Chennai, and PhD degree from SASTRA University in Water Resources Engineering in 1991, 1993, and 2006, respec-tively. His research interests include sustainable water resources development and environment.