R E S E A R C H
Open Access
Femtocell interference analysis based on the
development of system-level LTE simulator
Sueng Jae Bae
1, Young Min Kwon
1, Mi-Young Lee
2, Bon Tae Koo
2and Min Young Chung
1*Abstract
Although femtocell can confer various benefits to both operators and users, many technical issues, such as
interference coordination, network synchronization, self-configuration, and self-optimization must be considered to effectively deploy femtocells in real environments. In this article, we develop a system-level simulator in order to evaluate performance of long-term evolution (LTE)-femtocell systems. The simulator consists of five functional modules which realize packet scheduling and call admission control functionalities and model various wireless channel effects, real and non-real time traffics, and user mobility. These modules are managed by operational modules that follow event-driven programming. In addition, the simulator adopts a graphical user interface (GUI) that facilitates configuration, management, and observation of simulations in real time. Based on the simulator, we analyze effects of signal interference between macro- and femtocells under four scenarios. From the results, we confirm that the developed LTE-femtocell simulator can effectively support performance evaluation and analysis on various femtocell deployment scenarios.
Keywords: Deployment scenarios, Event-driven programming, Femtocell, Interference analysis, LTE, Simulator development
Introduction
Recently, demands of customers for wireless data com-munications in cellular networks are rapidly increasing as fascinating mobile devices, e.g., smart phone, tablet device, and ultra-mobile personal computer (UMPC), and mobile applications, e.g., mobile Internet protocol televi-sion (IPTV), high-definition video conference, and voice over IP (VoIP), have been introduced. For example, traf-fics for wireless data communications have increased by 5000% over the past three years in AT&T networks [1]. Moreover, customers expect to be provided with enhanced quality of services since they spend more com-munication expenses to telecomcom-munications companies for wireless data communications than they do for voice-only services.
In indoor environments, channel quality between the cellular base station and mobile node may be low due to many walls and obstacles. Thus, wireless communi-cation for indoor environments requires more wireless
*Correspondence: [email protected]
1College of Information and Communication Engineering, Sungkyunkwan University, Suwon, 440-746, Republic of Korea
Full list of author information is available at the end of the article
resources including time, bandwidth, and transmit power, to guarantee required service quality of customers. Never-theless, shortage of wireless resource in cellular networks will be accelerated, since more than 60% of voice traf-fic and 90% of data traffic are expected to be generated indoors [2].
It is undeniable that extra network infrastructure is required to expand the capacity of cellular networks. The use of femtocells, which are overlaid over the traditional macrocell based cellular networks is a key topic related to the deployment of new infrastructure in a cost-effective manner [3-5]. A femtocell is small-sized cellular base station with low-power and low-cost characteristics. It can be deployed wherever wired IP access is possible by either the service providers or the customers. Since this inexpensive femtocell is usu-ally deployed indoors and connected to the backhaul through generic IP access, such as digital subscriber line (DSL), cable modem, and fiber-to-the-home (FTTH), it can help cellular networks to cost-efficiently secure wire-less resources and customers to use wirewire-less data com-munications with low power and high data rates using
existing cellular devices. Despite these advantages, sev-eral technical issues should be considered for efficient femtocell deployment, e.g., signal interference coordina-tion, resource allocation and management, access strategy, network synchronization, self-organization and optimiza-tion, and handover between macro- and femtocells. Espe-cially, signal interference between macro- and femtocells should be analyzed and carefully coordinated, since fem-tocells are expected to share the same licensed bandwidth with traditional cellular networks for high frequency efficiency.
For research and performance evaluation of cellular net-works with femtocells, system-level simulation is one of the most useful methodologies [6]. In this article, we develop a system-level simulator for LTE (-Advanced) networks with femtocell using event-driven program-ming. The simulator includes resource management func-tionalities, such as packet scheduler and call admission control (CAC) schemes based on the 3GPP release 10 standard, and models of wireless channel effects, various real- and non-real time traffic patterns, and user mobil-ity. In addition, the simulator is equipped with a graphical user interface (GUI) to facilitate configuration, operations, and observations of the simulations.
We intensively analyze effects of signal interference between macro- and femtocells for downlink communica-tions utilizing the developed simulator. For the purpose, we define four scenarios that should be considered in fem-tocell deployment and evaluate capacities for both macro-and femtocells under the scenarios based on the simulator. The remainder of the article is organized as follows. Section ‘Preliminaries’ provides background for wire-less resources and femtocell networks in 3GPP LTE
(-Advanced) systems. In Section ‘Simulator design and development’, we introduce architecture, functionalities, components, and GUI for the proposed simulator. Then, we analyze interference between macro- and femtocells in the LTE system by utilizing the simulator in Section ‘Interference analysis’. Finally, Section ‘Conclusion’ gives a conclusion.
Preliminaries
In this section, we briefly introduce wireless resources and femtocell networks in 3GPP long term evolution (LTE) system, since we refer 3GPP release 9 (LTE) and 10 (LTE-Advanced) specifications [7-11] for development of the simulator.
General information on 3GPP LTE system
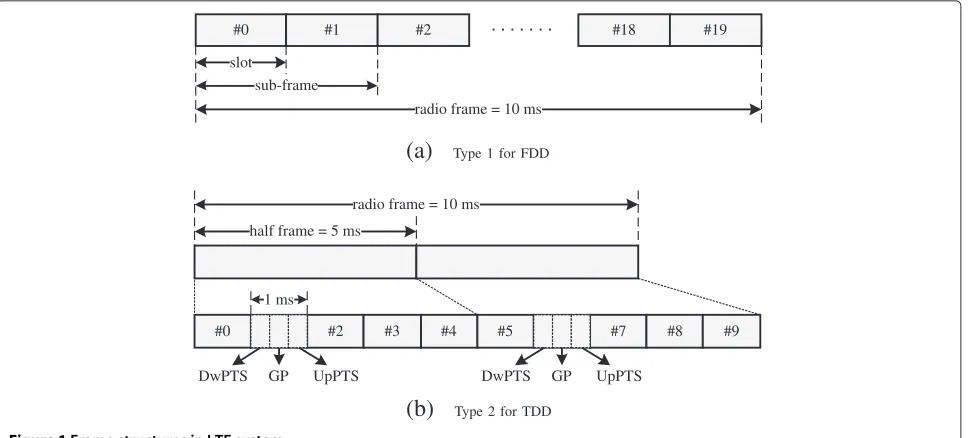
The LTE system adopts orthogonal frequency division multiple access (OFDMA) and single carrier-frequency division multiple access (SC-FDMA) for downlink and uplink communications, respectively, in order to effec-tively utilize wireless resources in both time and frequency domains [9,12]. In addition, for high scalability, the LTE system can use variable bandwidth, from 1.4 to 20 MHz, and support both time division duplexing (TDD) and fre-quency division duplexing (FDD). Figure 1 shows two types of frame structures for FDD and TDD defined in [8]. In FDD, both uplink and downlink use the type 1 frame structure in Figure 1a through different frequency bandwidths. In contrast, in TDD, sub-frames in the type 2 frame structure are alternatively used for uplink and downlink transmissions. For transition between uplink and downlink, sub-frames 1 and 6 contain downlink and
#0 #1 #2 #18 #19
DwPTS GP UpPTS DwPTS GP UpPTS
uplink pilot time slots (DwPTS and UpPTS) and guard period (GP), as shown in Figure 1b.
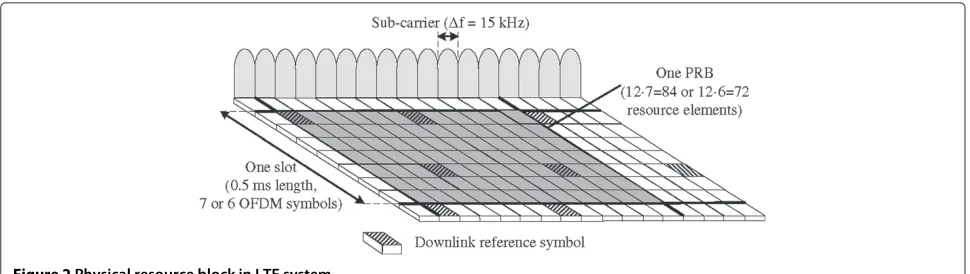
For efficient resource management and scheduling, the LTE system defines physical resource block (PRB), which consists of 12 sub-carriers in the frequency domain and one slot in the time domain as shown in Figure 2. In the case of using normal cyclic prefix (CP) and extended CP in the LTE physical layer, since a slot consists of seven and six OFDMA symbols, there are 84 (=12×7) and 72 (=12×6), respectively, resource elements in a PRB. Four resource elements in each PRB are used for downlink ref-erence symbols. By interpolating and averaging refref-erence symbols over multiple reference symbols, the user equip-ment (UE) can estimate the channel condition between the UE and the base station, so called evolved Node B (eNB). For individual UE, appropriate modulation and coding rates are applied to allocate data bits in PRBs in order to guarantee maximum allowable bit error rate (BER) based on the channel condition. This technique is termed adaptive modulation and coding (AMC). Because of AMC, functionalities for wireless resource manage-ment in LTE system, such as packet scheduler and call admission controller, should consider not only conven-tional metrics but also varying capacities of wireless links for UEs.
Femtocell networks and interference cases
Home evolved Node B (HeNB), which is a femtocell base station, and expanded evolved UMTS terrestrial radio access network (E-UTRAN) architecture are defined to support femtocells in the LTE-Advanced system [8]. HeNB includes most functionalities of eNB and is con-nected to cellular core networks through the existing Internet access and HeNB gateway.
In LTE system, wireless resources in both time and fre-quency domains can be commonly or separately allocated to macro- and femtocells. If macro- and femtocells are allocated to different wireless resources, there exists no signal interference between the macro- and femtocells. However, in this case, utilization of the wireless resources
may low, since the wireless resources should be segmented into small pieces. Therefore, many researchers consider reuse of wireless resources in macro- and femtocells in order to improve utilization of the expensive wireless resources [13].
When wireless resources are commonly utilized by macro- and femtocells, signal interference can occur between macro- and femtocells and between different femtocells. Figure 3 shows possible cases of cross-tier interference between macro- and femtocells. In downlink communications, HeNB interferes with signals transmit-ted from eNB to macrocell UEs (MUEs) ((1) in Figure 3a) while eNB interferes with those from HeNBs to femtocell UEs (FUEs) ((2) in Figure 3a). Conversely, in uplink com-munications, MUEs and FUEs, respectively, interfere with signals transmitted from FUEs to HeNBs and from MUEs to eNB as (3) and (4) in Figure 3a. Figure 3b shows possible cases of co-tier interference between different femtocells. In downlink communications, HeNBs give interference to signals transmitted from HeNBs to FUEs in other fem-tocells as (5) and (5’) in Figure 3b. On the other hand, in uplink communications, FUEs interfere with signals transmitted from FUEs to HeNBs in different femtocells as (6) and (6’) in Figure 3b.
Simulator design and development
In the developed system-level LTE simulator, we try our best to emulate various functions in the 3GPP LTE (-Advanced) standard. For this purpose, we include packet scheduling and call admission control (CAC) functional-ities based on [7,8]. In addition, we model wireless chan-nels with multi-path and shadowing effects, four kinds of real time and non-real time IP traffics, and mobility of UEs, in order to evaluate performance of femtocells under realistic environments. Moreover, the simulator adopts a GUI that helps operators of the simulator to set and update simulation parameters easily, to apply arbi-trary scenarios using a mouse or trackball, and to observe simulation status and results in real time.
Figure 3Possible cases of signal interference in LTE-femtocell networks.
The simulator is composed of operational and func-tional parts as shown in Figure 4. The operafunc-tional part initializes, manages, and finalizes simulations by utiliz-ing initialization, event processutiliz-ing, data management, and finalization modules. The functional part provides vari-ous functions and models that are used to emulate LTE network environments, including femtocells and UEs. For the purpose, the functional part consists of five modules that perform packet scheduling and call admission con-trol functionalities and model various wireless channel effects, real and non-real time traffics, and user mobil-ity. Functional modules are tightly integrated with the event process module in the operational part, and they are managed and used in an event-driven manner.
Functional part
Modules in the functional part can be classified into resource management modules and modeling modules. Resource management modules are used to emulate func-tionalities related to wireless resources in the LTE system. These resource management modules enable the simula-tor to evaluate capacity in macro- and femtocell networks. Conversely, modeling modules help the simulator to con-sider realistic network environments by modeling wireless channel, traffic patterns, and user mobility.
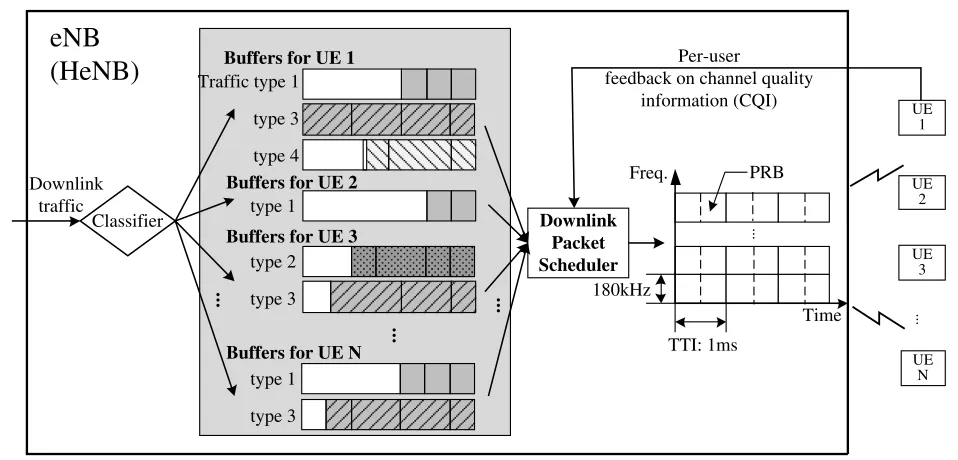
Packet scheduler module
Packets in the transmit packet buffers in a base station, e.g., eNB and HeNB, are scheduled into available PRBs
for wireless transmissions by using the packet scheduler module, as shown in Figure 5. Well-known packet scheduler algorithms, i.e., round robin (RR), proportional fair (PF) [14], and maximum carrier-to-interference ratio (MAX C/I) [15], are included in the simulator to evalu-ate performance under different types of packet sched-ulers. We use PF scheduler for packet scheduling in both eNB and HeNBs in the simulation results in this article.
For downlink packet transmissions, PF scheduler in a base station allocates PRBs to the associated UEs consid-ering conditions of wireless links from the base station to the UEs. Let SPRB = {k|1 ≤ k ≤ NPRB} denote a set of PRBs that can be allocated in a scheduling interval for the downlink transmissions, andSUE denote a set of associated UEs requiring packet scheduling. PF scheduler allocates a PRBk (∈ SPRB) to packets for UEi∗k (∈ SUE) asi∗k = arg maxi∈SUECi,k/Ai, whereCi,k andAirepresent currently achievable data rate with PRBkand average data rate, respectively, for UEi.
Call admission control module
Modeling modules
Figure 4Simulator architecture.
services, buffer state, and so on [7]. In the simulator, we include two CAC algorithms, one accepts a new call based on the estimation of wireless resources [16], and the other decides whether to accept or reject the new call considering the maximum allowed packet delays [17].
Channel modeling module
This module estimates changes in signal power transmit-ted through the wireless channel among eNBs, HeNBs, and UEs by utilizing path loss, multi path fading, and shadowing models. We adopt indoor and outdoor path
Downlink
(HeNB)
feedback on channel qualityPer-userinformation (CQI)
Buffers for UE 1
Buffers for UE 2
Buffers for UE 3
Buffers for UE N
Freq.
loss models defined in wireless world initiative new radio (WINNER) II project [18] to estimate path loss in macro-and femtocell, respectively, as follows:
PLoutdoor=32.68+35.74·log10d, (1)
PLindoor=37.78+36.8·log10d, (2)
wheredis distance from the transmitter to the receiver. In addition, the simulator is able to estimate outdoor-to-indoor (indoor-to-outdoor) path loss for transmission from eNB to FUEs (from HeNB to MUEs) utilizing Equations (1) and (2). We also consider multi-path fading with an exponential distribution of mean 1, and shadow-ing with a normal distribution of zero mean and standard deviation 8 [10].
From the received signal power obtained through the models, the channel modeling module calculates received signal to interference plus noise ratio (SINR) for each wireless link. In order to consider the AMC function in LTE system, the simulator includes discrete spectral effi-ciency lookup table indexed by SINR [11]. The lookup table defines 35 levels of frequency efficiencies (bps/Hz) according to the various modulation schemes, i.e., QPSK, 16 QAM, and 64 QAM, and the coding rates under the considerations of 1:2 MIMO, channel prediction, and HARQ. Based on the frequency efficiency determined from the lookup table for each wireless link, the simulator calculates the number of data bits which can be con-tained in a PRB for the link by multiplying the frequency efficiency with bandwidth (180 kHz) and time duration (0.5 ms) of the PRB.
Traffic generator module
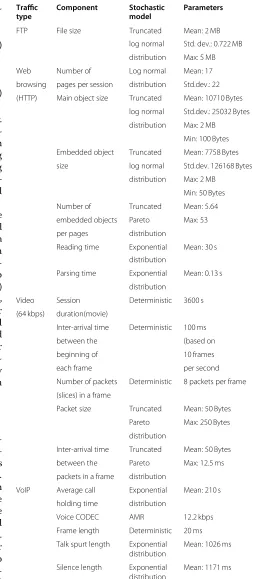
In real network environments, mobile users utilize a vari-ety of applications by using their mobile terminals. There-fore, various types of traffic with different characteristics should be transmitted through wireless communication. In the simulator, we build a traffic generator based on stochastic models of four kinds of real- and non-real time traffic types. For real time traffic types, we consider voice over IP (VoIP) for traffic flows of voice conservation and streaming service for those of real time video streaming. In addition, for non-real time traffic types, we consider file transfer protocol (FTP) and web services in order to model traffic flows for burst and intermittent data trans-missions, respectively. We refer stochastic models and related parameters in [19,20] to model the traffic types as shown in Table 1.
Upon execution of a service arrival event in Section ‘Service arrival event’, the traffic generator module
Table 1 Stochastic models for traffic types Traffic
type
Component Stochastic model
Parameters
FTP File size Truncated Mean: 2 MB
log normal Std. dev.: 0.722 MB distribution Max: 5 MB
Web Number of Log normal Mean: 17
browsing pages per session distribution Std.dev.: 22 (HTTP) Main object size Truncated Mean: 10710 Bytes
log normal Std.dev.: 25032 Bytes distribution Max: 2 MB
Min: 100 Bytes Embedded object Truncated Mean: 7758 Bytes size log normal Std.dev. 126168 Bytes
distribution Max: 2 MB Min: 50 Bytes Number of Truncated Mean: 5.64 embedded objects Pareto Max: 53 per pages distribution
Reading time Exponential Mean: 30 s distribution
Parsing time Exponential Mean: 0.13 s distribution
Video Session Deterministic 3600 s (64 kbps) duration(movie)
Inter-arrival time Deterministic 100 ms
between the (based on
beginning of 10 frames
each frame per second
Number of packets Deterministic 8 packets per frame (slices) in a frame
Packet size Truncated Mean: 50 Bytes Pareto Max: 250 Bytes distribution
Inter-arrival time Truncated Mean: 50 Bytes between the Pareto Max: 12.5 ms packets in a frame distribution
VoIP Average call Exponential Mean: 210 s holding time distribution
Voice CODEC AMR 12.2 kbps
Frame length Deterministic 20 ms Talk spurt length Exponential Mean: 1026 ms
distribution
Silence length Exponential Mean: 1171 ms distribution
the proposed simulator mainly focuses on the MAC layer functionalities, the higher layers beyond the MAC layer are considered as an abstraction.
Mobility management module
Consideration of user mobility is very important for realis-tic simulations, as we have mentioned in Section ‘Prelim-inaries’, since movement of UEs yields changes in overall capacity of wireless networks by changing link capacities for UEs. Thus, the simulator includes random walk and random way point mobility models for MUE and FUE, respectively, [21,22]. In the random walk model, an UE firstly determines coordinates of the destination based on randomly selected direction, velocity, and flight time, and it starts to move to the destination. This procedure is repeated whenever the UE reaches the destination. In the random way point model, UE is initially located at the random coordinates of the randomly selected room. Then it remains at the location for randomly distributed time durations. After the time duration, it repeats the same procedure.
Mobility management module is also responsible for CQI reports from moving UEs to their corresponding (H)eNBs. 3GPP LTE defines two types of CQI reports according to their reporting interval, i.e., periodic and aperiodic. In addition, according to the type of infor-mation contained in the report, it can be classified into wideband and sub-band CQI reports. The wideband CQI report contains a measurement referring to the entire sys-tem bandwidth, while the sub-band CQI report includes measurements for various sub-bands. For periodic packet scheduling based on PF scheduler which considers fre-quency efficiency of each sub-band, the simulator basi-cally adopts the periodic sub-band CQI report.
Event handling
The simulator was developed based on event-driven pro-gramming [23]. Event-driven propro-gramming is a program paradigm in which the flow of the program is determined by events. Since event-driven programming can reduce unnecessary loops and operations, it can enhance effi-ciency and performance of the program and is widely used in well-known network simulators such as OPNET, QualNet, and NS-2 [24-26].
According to event-driven programming,
event-processing module of our simulator, which is the main loop of the program, is divided into two sections, i.e., event selection and event handling. In addition, event queue based on a linked list data structure is defined to arrange generated events. In event selection, event located at the head of the event queue is loaded and the appropriate event handler is executed based on the type of the event. Consequently, the event handler processes
the event using functional modules, global variables, and information contained in the event. The event selection and handling are repeated until the simulation terminates. Five events are defined in the simulator to manage simulator operations, i.e., service arrival, packet arrival, scheduling, service departure, and handover events.
Service arrival event
This event indicates arrival of a new service for an UE. Whenever a service arrival event occurs, the event handler executes the CAC module. Then, the CAC module deter-mines whether to accept the service, based on the type of the new service and current system status. If the CAC module decides to accept the service, the simulator suc-cessively generates initial and second packet arrival and service departure events for the accepted service, and next service arrival event based on predefined service arrival rate (λ), and put those events into the event queue. Con-versely, if the CAC module declines the new service, the event handler only generates the next service arrival event and finishes handler operations after putting the event in the event queue.
Packet arrival event
The packet arrival event means the arrival of a new packet for a specific UE. Since the higher layers beyond MAC layer are considered as an abstraction, the packet arrival is expressed as a form containing attributes of a traffic type, i.e., VoIP, video streaming, FTP, and web service, and of traffic volume in bits. Upon arrival of the event, the event handler commands the traffic generator module to gener-ate an approprigener-ate packet for the service type of the UE. Then, the generated packet is inserted in the UE’s transmit packet buffer located at the base station in which the UE is currently connected. After packet generation, the event handler generates a new packet arrival event, based on the next packet arrival time, considering traffic characteristics of the service.
Scheduling event
time interval and places the event in the event queue after packet scheduling is completed. At this point, by adjusting execution time of the new scheduling event, the simulator can support various scheduling intervals, e.g., multiple of 1 ms.
Service departure event
The service departure event terminates the service that generated this event. For the purpose, the event han-dler commands the traffic generator module to initiate variables related to the service. Subsequently, the event handler deletes the packet arrival event for the service to stop packet generation.
Handover event
The handover event is used to manage mobility of UEs. The event is generated whenever an UE crosses the boundary of the currently located cell. Upon receiving the handover event, the event handler determines if the cor-responding UE has ongoing service. If the UE does not receive service, the event handler performs the cell res-election procedure and updates cell ID field in the UE information structure to a new cell ID. On the other hand, if the UE receives a service, the event handler commands the CAC module to determine whether to accept the han-dover or not. If the new cell cannot accommodate the UE, the service of the UE is terminated, as the same han-dling procedure for service departure event. However, if the handover of the UE is accepted, as the result of CAC, both cell ID fields in the UE information structure and the next packet arrival event are updated to the new cell ID.
Graphical user interface
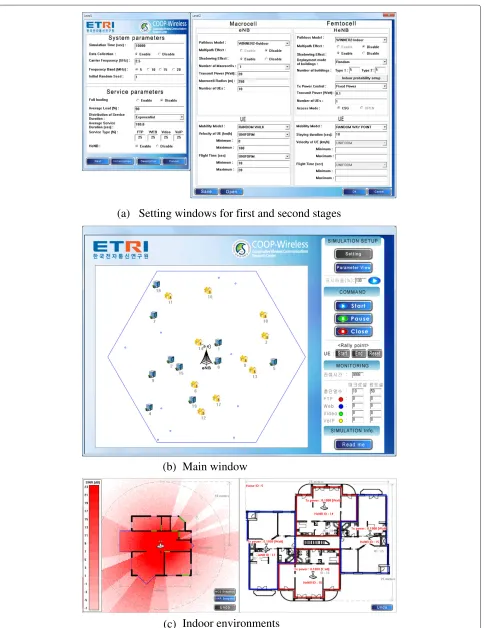
In order to effectively facilitate simulations, the simulator adopts the GUI developed through the Microsoft foun-dation class (MFC) libraries. By utilizing the GUI, simu-lation operators can set simusimu-lation environments, deploy femtocells, control operation of simulations, and observe simulation results in real time.
The simulator provides two stages for setting of simu-lation environments, as shown in Figure 6a. In the first stage, operators can set general system parameters, such as simulation duration, carrier frequency, frequency band, and random seed, and parameters related to traffic gen-eration, such as average load and service duration, dis-tribution of service duration, and portion of each service type. Detailed parameters for both macrocell and fem-tocell base stations and users, including channel effects, number of cells, cell radii, transmission power of eNB and HeNB, and mobility characteristics, can be controlled in the second stage. In addition, type, deployment mode, and transmission power control methods for HeNBs can also be selected in the second stage.
Figure 6b shows the main window of the simulator. Net-work topology and positions of UEs can be observed in real time on the left hand side, while the control of sim-ulation operations and monitoring statistics are enabled using interfaces on the right side of the main window. By clicking the house or building icon in the left hand side of the main window, we can see the indoor environment window for the femtocell as shown in Figure 6c. The floor plan, positions of UEs, and snapshots for SINR and mod-ulation and coding scheme (MCS) levels can be observed in the window.
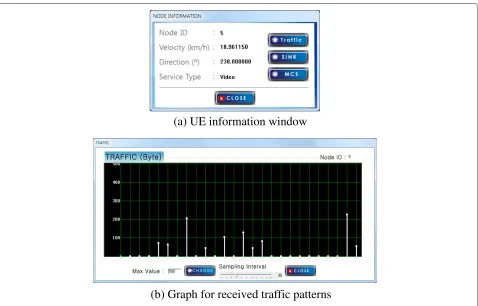
Brief information about the UE, i.e., ID, velocity, mov-ing direction, and type of ongomov-ing service, can be found by selecting moving UE at both main and indoor envi-ronments windows. In addition, by using buttons in the UE information window, received traffic patterns, SINR, and MCS level can be observed via real time graphs. Figures 7a, b show examples of the UE information and the graph on traffic patterns.
Interference analysis
Performance degradation caused by signal interferences from femtocells is one of the most important issues in femtocell deployments. As we have mentioned in Section ‘Preliminaries’, femtocells and macrocells may interfere with each other and performance of both networks can be decreased, since many telecommunication companies prefer reusing the frequency bandwidths of existing cellu-lar networks for femtocells due to the frequency efficiency and the cost.
In order to effectively mitigate the performance degra-dation, both cross-tier interference between macrocells and femtocells and co-tier interference between different femtocells should be analyzed. Thus, we utilize the simu-lator developed in this article to analyze performance of macro- and femtocell networks. For the analysis, we define four scenarios for different femtocell deployment cases to analyze effects of the distance between femtocell and MUE, the distance between femtocell and macrocell, the number of femtocells, and the distribution of femtocells. Since base stations including eNB and HeNB are major interferers due to their high transmission power, we focus on the downlink performance in the following analysis.
(a) Setting windows for first and second stages
(b)
(c)
Main window
(a) UE information window
(b) Graph for received traffic patterns
Figure 7Examples of UE information and graph on traffic patterns.
of HeNBs are fixed to a specific value (0, 10, and 20 dBm), while D-TPD and P-TPD determine transmission pow-ers of HeNBs based on the distances and the path losses among HeNB, MUE, and eNB, respectively, [28].
Assume that a HeNB has recently been installed at an arbitrary location and its power is turned on for the first time. In D-TPD, under the assumption that the HeNB knows distance from the closest eNB, the HeNB decides its transmission power (PHeNBdBm) based on the distance from eNB,deNB(meters) [28], as follows:
PHeNB= ⎧ ⎪ ⎪ ⎨ ⎪ ⎪ ⎩
20, 0<deNB≤85, 10, 85<deNB≤156,
0, 156<deNB≤289.
(3)
On the other hand, in P-TPD, HeNB first discovers the closest macrocell eNB and measures the reference signal received power (RSRP),ReNB, from the eNB to determine its transmission power. If we assume that a MUE near the
HeNB has similar RSRP to the HeNB, the received SINR for the MUE,S, can be estimated as
S=ReNB−
PHeNB−PL
dMUE , (4)
wheredMUE(meters) is a distance from the HeNB to the MUE, and PL(x) (dB) is path loss for the signal
inter-ference from the HeNB to the MUE which is x meters
apart from the HeNB. In this case, in order to guaran-tee more thanStarget dB SINR for MUEs located farther thandMUEtargetmeters, the HeNB determines its transmission power (PtargetHeNB) from Equation (4) as follows:
PHeNBtarget =min
PHeNBmax ,ReNB−Starget+PL
dtargetMUE
,
(5)
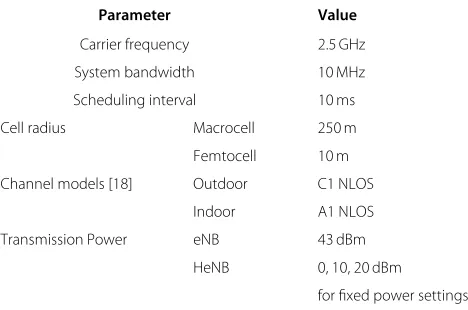
wherePHeNBmax is maximum transmission power of HeNB. In the simulations, we setPHeNBmax ,Starget, and PL(dMUEtarget)to 20 dBm,−6 dB, and 60 dB, respectively. Table 2 details the parameters used in the simulations.
Table 2 Simulation parameters
Parameter Value
Carrier frequency 2.5 GHz
System bandwidth 10 MHz
Scheduling interval 10 ms
Cell radius Macrocell 250 m
Femtocell 10 m Channel models [18] Outdoor C1 NLOS
Indoor A1 NLOS
Transmission Power eNB 43 dBm
HeNB 0, 10, 20 dBm
for fixed power settings
with signals transmitted from eNB to MUE. Moreover, as the MUE gets closer to HeNBs, performance degradation caused by cross-tier interference may increase due to the large RSRP from the HeNBs. In order to analyze effects of the distance between HeNB and MUE, we consider fem-tocell deployments and the moving path of an MUE as shown in Figure 8. In the scenario, the distance between eNB and MUE is fixed to 100 m, while shortest distance between HeNB and MUE varies from 0 to 20 m at intervals of 5 m.
Received SINR of MUE according to the movement of MUE in the first scenario is shown in Figure 9a. As shown in the figure, the received SINR increases as the distance
between MUE and HeNB increases and as the transmis-sion power of HeNB decreases. When D-TPD is used, since the distances between eNB and HeNBs approximate 100 m, 85 < deNB ≤ 156 and HeNBs set their transmis-sion powers to 10 dBm according to Equation (3). Thus, received SINR for D-TPD is close to that for fixed trans-mission power with 10 dBm. In P-TPD, RSRPs measured at HeNBs for signal from eNB (ReNB) are very high, since the HeNBs are closely located with the eNB (∼=100 m). Accordingly, HeNBs set their transmission powers to
PmaxHeNB (=20 dBm), as Equation (5). Therefore, SINR for P-TPD is similar to that for the case with 20 dBm fixed transmission power.
Figure 9b shows spectral efficiency (bps/Hz) according to the movement of the MUE in Scenario 1. Spectral effi-ciency is defined as the number of bits that can be trans-mitted through one Hertz during one second. Trends in Figure 9b are similar to those in Figure 9a, since the spec-tral efficiency is determined from received SINR accord-ing to the predefined spectral efficiency lookup table. In addition, we notice that the MUE cannot receive any bits when the MUE is located near HeNB 1, since spectral efficiencies for the MUE become zero due to the strong interference from HeNB 1.
Scenario 2: effects of the distance between eNB and HeNB Even though distance between MUE and HeNB is fixed, received SINR of an MUE may vary according to the
dmin HeNB 1
(dmin=0 m)
: Moving path of an MUE
HeNB 2
(dmin=5 m)
HeNB 3
(dmin=10 m)
HeNB 4
(dmin=15 m)
HeNB 5
(dmin=20 m)
100
m
Figure 9Performance of MUE as varying distance between HeNB and MUE.
distance between the eNB and the HeNB, since received SINR is ratio of received signal to the sum of interfer-ences and noises. In order to analyze the effects of the distance between eNB and HeNB, in the second scenario, we consider femtocell deployments and the moving path of an MUE in Figure 10. In the scenario, distance between eNB and MUE varies from 50 to 250 m at 50 m intervals, while the shortest distance from HeNB to MUE is fixed to 10 m.
Figure 11 shows performance of MUE and femtocells based on the location of the MUE. Received SINR and spectral efficiency of the MUE mostly decrease as the
: Moving path of an MUE
dmin=10 m 250 m
50 m
HeNB 1 HeNB
2 HeNB
3 HeNB
4 HeNB
5
Figure 10Femtocell deployments and moving path of MUE in Scenario 2.
powers while rest of HeNBs have transmission pow-ers between 10 and 20 dBm. Thus, received SINR and spectral efficiency of P-TPD are larger than those for 20 dBm fixed HeNB transmission power, while they are smaller than those for 10 dBm fixed HeNB transmission power.
Table 3 shows average throughput of femtocell as vary-ing the distance from eNB to HeNB. The average through-put of a femtocell is defined as the average of the sums of user throughputs for individual FUEs. When trans-mission powers of HeNBs are fixed, received interfer-ence from eNB to FUE decreases, while the RSRP from HeNB to FUE remains constant as the distance from eNB to FUE increases. Thus, average throughput of femto-cells increases as the distances between eNB and HeNBs increase, since the received SINRs of FUEs increase as the eNB recedes from the FUEs. Average throughput of fem-tocell decreases as the transmission power from HeNB decreases, for similar reasons.
In both D-TPD and P-TPD, when a HeNB is closely located with the eNB, it uses high transmission power to guarantee certain level of received SINR to its FUEs. On the other hand, if the HeNB is located far from the eNB, it reduces its transmission power to minimize inter-ference to MUEs. From these reasons, average femtocell throughput decreases when distance from the eNB to the
HeNB is larger than 150 and 100 m for D-TPD and P-TPD, respectively.
Scenario 3: effects of the number of HeNBs
In Scenario 3, we evaluate performance of an MUE as varying the number of HeNBs which are located in the vicinity of the MUE. For the purpose, we deploy femtocells and set trajectory of an MUE as shown in Figure 12. The MUE moves on a circle around the eNB in order to main-tain constant received power from the eNB. In addition, five groups having different numbers of femtocells (from one to five) are deployed along the path. The minimum distances from each group to MUE and to eNB are set to 20 and 120 m, respectively.
Figure 11Performance of MUE as varying distance between eNB and HeNB.
efficiency are better than those for fixed transmission power with 20 dBm.
Scenario 4: effects of the distribution of HeNBs
We evaluate performance of macro- and femtocells under sparse and dense femtocell distributions in Scenario 4. For sparse and dense femtocell distributions, we consider two types of indoor environments which have one and four HeNBs in a building of one story, respectively, as shown in Figure 6c. In addition, four FUEs share wireless resources for communications in each femtocell. In simulations for
Table 3 Average throughput of femtocell (Mbps) according to the distance between eNB and HeNB
Type 50 m 100 m 150 m 200 m 250 m
Fixed 0 dBm 2.18 2.85 5.42 6.46 6.82
10 dBm 3.14 8.14 11.12 12.18 12.62
20 dBm 8.09 13.53 14.73 14.6 14.7
D-TPD 7.78 8.26 11.21 6.36 7.09
Group 1
Group 2
Group 3
Group 4
Group 5
: Moving path of an MUE
120 m
100 m
dmin=20 m
Figure 12Femtocell deployments and moving path of MUE in Scenario 3.
both sparse and dense femtocell distributions, 50 build-ings and 50 MUEs are uniformly deployed in a macrocell. Each building includes one HeNB in sparse femtocell dis-tribution, while it includes four HeNBs in dense femtocell distribution, as shown in Figure 6c.
Table 4 shows average throughputs of macro- and femtocell for sparse and dense femtocell distributions. Throughput of a macrocell is defined as a sum of through-puts of all MUEs in the considered macrocell. If trans-mission powers of HeNBs are fixed, macrocell throughput decreases as transmission powers of HeNBs increase due to the interference from the HeNBs to the MUEs. In addition, average throughput of a macrocell for dense femtocell distribution is less than that for sparse fem-tocell distribution, since the total number of femfem-tocells in the dense femtocell distribution is four times larger than that in the sparse femtocell distribution. In compar-ison with D-TPD and P-TPD, HeNBs in D-TPD generally have lower transmission power than HeNBs in P-TPD, since HeNBs in D-TPD linearly reduces their transmis-sion power, regardless of path loss or channel environ-ments. Therefore, D-TPD has larger average macrocell throughput than P-TPD, because HeNBs with D-TPD less interfere with MUEs.
For HeNBs having fixed transmission powers, femtocell throughput increases as the transmission power increases,
since high transmission power improves received SINR and spectral efficiency for FUEs. In dense femtocell dis-tribution, femtocells in a building may interfere with each other, because they share the same frequency band-width. Thus, femtocell throughput in the dense femtocell distribution is lower than that in sparse femtocell dis-tribution. In comparison with D-TPD and P-TPD, as we have explained before, HeNBs with D-TPD generally have lower transmission power than those with P-TPD. Thus, P-TPD has larger femtocell throughput than D-TPD as shown in Table 4.
Figure 13Performance of MUE as varying the number of HeNBs.
from eNB, while HeNB with P-TPD determines its trans-mission power by considering path loss from the HeNB to an MUE expected to be existed near the HeNB. Due to this characteristic, HeNBs with D-TPD usually have lower transmission power than the HeNBs with P-TPD. Thus, average macrocell throughput for D-TPD is larger than that for P-TPD, and vice versa for the average femtocell throughput.
Conclusion
Despite the advantages of femtocells, effects of femto-cell deployments should be carefully analyzed before their
Table 4 Average throughput of macro- and femtocells (Mbps) under sparse and dense femtocell distributions
Type Macrocell Femtocell
Sparse Dense Sparse Dense
Fixed 0 dBm 6.2 5.25 5.52 4.31
10 dBm 5.38 3.76 9.89 6.74
20 dBm 3.49 1.81 12.69 7.87
Distance based 5.28 3.69 8.3 6.09
Figure 14Average throughput of macro- and femtocells as varying the number of femtocells per macrocell.
release, in order to minimize the risks and failures of fem-tocells in real markets. Thus, we introduced a system-level simulator that can facilitate various simulations for LTE systems with femtocells. For development of the simula-tor, we described five functional modules, including mod-els of wireless channmod-els, four kinds of IP traffics, and users’ mobility, to emulate realistic LTE systems and network environments. In addition, detailed operational events and graphical user interfaces for efficient simulator oper-ations were introduced. We intensively analyzed signal interference between macro- and femtocells under four femtocell deployment scenarios utilizing the developed
of femtocells based on the close cooperation between eNBs and HeNBs. In addition, various resource parti-tioning schemes, which statically or dynamically divide radio resources for femto- and macrocells in order to avoid interference and improve overall performance, will be addressed.
Competing interests
The authors declare that they have no competing interests.
Acknowledgements
This research was supported by the MKE (The Ministry of Knowledge Economy), Korea, under the ITRC (Information Technology Research Center) support program supervised by the NIPA (National IT Industry Promotion Agency) (NIPA-2012-(H0301-12-1005)) and by the LTE Femtocell research of ETRI (KI002109, 3GPP LTE based All-in-One Femtcell Base Station SoC Platform).
Author details
1College of Information and Communication Engineering, Sungkyunkwan University, Suwon, 440-746, Republic of Korea.2Electronics and
Telecommunications Research Institute (ETRI), Daejeon, 305-350, Republic of Korea.
Received: 19 October 2011 Accepted: 24 August 2012 Published: 18 September 2012
References
1. AT&T (2010). [http://www.att.com]. Accessed on 15 September (2010) 2. G Mansfield, inProceedings of the FemtoCells Europe Conference.
Femtocells in the US market-business drivers and consumer propositions, (London, UK, p. 2008)
3. V Chandrasekhar, JG Andrews, Femtocell networks: a survey. IEEE Commun. Mag.46(9), 59–67 (2008)
4. H Claussen, LTW Ho, LG Samuel, An overview of the femtocell concept. Bell Labs Tech J.13(1), 224–246 (2008)
5. D Calin, H Claussen, H Uzunalioglu, On femto deployment architectures and macrocell offloading benefits in joint macro-femto deployments. IEEE Commun. Mag.48(1), 26–32 (2010)
6. L Chen, W Chen, B Wang, X Zhang, H Chen, D Yang, System-level simulation methodology and platform for mobile cellular systems. IEEE Commun. Mag.49(7), 148–155 (2011)
7. E-UTRAN overall description state 2 (Release 9). 3GPP TS 36.300, V9.6.0 (2010)
8. E-UTRAN overall description: state 2 (Release 10). 3GPP TS 36.300, V10.2.0 (2010)
9. 3GPP physical channels and modulation (Release 9). 3GPP TS 36.211 V9.1.0 (2010)
10. Physical layer aspect for evolved universal terrestrial radio access UTRA. 3GPP TS 25.814, V7.1.0 (2006)
11. Radio frequency (RF) system scenarios. 3GPP TR 36.942, V9.2.0 (2009) 12. A Ghosh, R Ratasuk, B Mondal, N Mangavedhe, T Thomas, LTE-Advanced:
next generation wireless broadband technology. IEEE Wirel. Commun. Mag.17(3), 10–22 (2010)
13. D Lopez-Perez, A Valcarce, G Roche, Z Jie, OFDMA femtocells: a roadmap on interference avoidance. IEEE Commun. Mag.47(9), 41–48 (2009) 14. B Al-Manthari, H Hassanein, N Nasser, Packet scheduling in 3.5G
high-speed downlink packet access networks: breath and depth. IEEE Netw.21(1), 41–46 (2007)
15. HJ Zhu, RHM Hafez, Scheduling schemes for multimedia service in wireless OFDM systems. IEEE Wirel. Commun.14(5), 99–105 (2007) 16. SJ Bae, B Choi, JJ Lee, S Kwon, MY Chung, inProceedings of International
Conference on Computational Science and Applications (ICCSA 2009)A resource-estimated call admission control algorithm in 3GPP LTE system (Suwon, Korea, 2009)) pp. 250–260
17. SJ Bae, B Choi, JJ Lee, S Kwon, MY Chung, inProceedings of International Technical Conference of IEEE Region 10 (TENCON 2009). Delay-aware call admission control algorithm in 3GPP LTE system, (Singapore, 2009)) pp. 1–6
18. P Kyosti, et al., WINNER II channel models. IST-WINNER D1.1.2: V1.1 (2007)
19. WiMAX system evaluation methodology. WiMAX Forum: V2.01 (2007) 20. Next generation mobile networks radio access performance evaluation
methodology: V1.2 Next Generation Mobile Networks (NGMN) (2008) 21. T Camp, J Boleng, V Daview, A survey of mobility models for ad hoc
network research. Wirel. Commun. Mob. Comput.2(5), 483–502 (2002) 22. J Broch, DA Maltz, DB Johnson, YC Hu, J Jetcheva, inProceedings of ACM
Mobicom ’98. A performance comparison of multi-hop wireless ad hoc network routing protocols, (Dallas, Texas, USA, 1998)) pp. 90–100 23. S Ferg, Event-driven programming: introduction, tutorial, history. [http://
eventdrivenpgm.sourceforge.net]. Accessed on 29 January (2013) 24. Network Performance Management Solutions. [http://www.opnet.com].
Accessed on 19 September (2010)
25. Scalable Network Technologies:QualNet Network Evaluation Software. [http://www.scalable-networks.com]. Accessed on 29 January (2013) 26. The Network Simulator, NS-2. [http://www.isi.edu/nsnam/ns]. Accessed
on 22 September (2010)
27. C Chandrasekhar, M Kountouris, JG Andrews, Coverage in multi-antenna two-tier networks. IEEE Trans. Wirel. Commun.8(10), 5314–5327 (2009) 28. White paper: interference management in OFDMA femtocells. Femto
Forum (2010)
doi:10.1186/1687-1499-2012-287
Cite this article as:Baeet al.:Femtocell interference analysis based on
the development of system-level LTE simulator.EURASIP Journal on Wireless
Communications and Networking20122012:287.
Submit your manuscript to a
journal and benefi t from:
7Convenient online submission 7Rigorous peer review
7Immediate publication on acceptance 7Open access: articles freely available online 7High visibility within the fi eld
7Retaining the copyright to your article