OBESITY INDUCES METABOLIC ALTERATIONS OF T LYMPHOCYTES IN INFLUENZA VACCINATED ADULTS
William D. Green
A thesis submitted to the faculty of the University of North Carolina at Chapel Hill in partial fulfillment of the requirements for the degree of Master of Science in the Department of
Nutrition (Nutritional Biochemistry) in the Gillings School of Global Public Health.
Chapel Hill 2017
Approved By:
Melinda Beck
Rosalind Coleman
ABSTRACT
William D. Green: Obesity induces metabolic alterations of T lymphocytes in influenza-vaccinated adults
(Under the direction of Melinda Beck)
Obesity increases the risk for infection due to impairments in T cell activation and
function. Although the metabolic profiles of T cells dictates their function, what remains
unknown is if obesity alters T cell metabolism, thereby impairing function. This study examined
the metabolic profiles of T cells from healthy weight and obese white women. We demonstrated
that obesity alters the metabolic profile of quiescent and activated peripheral blood mononuclear
cells, and isolated CD4 and CD8 T cells. T cells from obese non-diabetic subjects exhibited
higher rates of aerobic glycolysis and mitochondrial respiration compared to obese
metformin-treated diabetic subjects. This ability of metformin to lower T cell metabolism in obese diabetics
to healthy weight levels, despite elevated serum glucose, suggests that metformin’s mechanism
of action directly impacts T cells. These results suggest that perturbations in T cell metabolism
To my girlfriend Natalie, my father David, and brother Joseph, these past two years would not have been possible without your love and support; and to my late-mother Patricia, losing you was
ACKNOWLEDGEMENTS
First, I would like to thank my mentor and advisor, Dr. Melinda Beck, for giving me the
opportunity to learn and work under her tutelage. This experience has truly been transformational
and I deeply appreciate the time and commitment it takes to support my efforts over the past two
years. Additionally, I would like to thank my committee members, Dr. Rosalind Coleman & Dr.
Stephen Hursting, for their continued support and guidance through this program and in this
project. I would like to thank Dr. Nancie MacIver of Duke University, along with her lab,
Amanda Nichols and Bill Eisner, for their technical support and guidance. Finally, I would like
to thank Kim Bartholomew, our flu study nurse and coordinator, Qing Shi, and Jenny Rebeles.
Without you, this experience and project would not have been possible. I would also like to
thank the cohort study subjects for their participation, contribution and sacrifice to science for
TABLE OF CONTENTS
LIST OF TABLES ... vii
LIST OF FIGURES ... viii
LIST OF ABBREVIATIONS AND SYMBOLS ... xi
CHAPTER I – BACKGROUND ...1
Introduction ...1
T cell metabolism supports cell survival and function ...3
Obesity impairs the immune response to infection ...5
Obesity alters the metbolome during infection ...6
Adipocytes in the obese state promote T cell activation through altered metabolism ...8
Adipocytes in the obese state promote T cell senescence ...9
Hypotheses ...11
CHAPTER II – JOURNAL MANUSCRIPT ...14
Summary ...14
Introduction ...15
Methods and Materials ...18
Results ...23
Discussion ...28
CHAPTER III – SIGNIFICANCE & FUTURE DIRECTIONS ...41
LIST OF TABLES
Table 1. Subject Demographics for PBMC metabolic profiling ...32
Table 2. Subject Demographics for CD4+ and CD8+ T cell metabolic profiling ...32
LIST OF FIGURES
Figure 1 - T cell metabolism and state of quiescent and activated T cells ...4
Figure 2 - Potential mechanisms of impairment of normal T cell signaling and
response to infection in obesity ...13
Figure 3. Quiescent and Concanavalin A activated PBMCs from healthy weight,
obese non-diabetic and obese metformin-treated diabetic adults ...33
Figure 4. Metabolic profile of quiescent CD4+ T cells in healthy weight, obese
non-diabetic and obese metformin-treated diabetic adults ...34
Figure 5. Metabolic profile of activated CD4+ T cells in healthy weight, obese
non-diabetic and obese metformin-treated diabetic adults ...35
Figure 6. Metabolic profile of quiescent CD8+ T cells in healthy weight, obese
non-diabetic and obese metformin-treated diabetic adults ...36
Figure 7. Metabolic profile of activated CD8+ T cells in healthy weight, obese
non-diabetic and obese metformin-treated diabetic adults ...37
Figure 8. Influenza specific HAI antibody titers for A/California/7/2009(H1N1)
from 2015-2016 and 2016-2017 vaccine years ...38
Figure 9. Metabolic profile of quiescent CD4+ T cells from influenza vaccinated
LIST OF ABBREVIATIONS AND SYMBOLS PBMC Peripheral blood mononuclear cell
TCR T cell receptor
ATP Adenosine triphosphate
IL-7 Interleukin-7 (naïve cell homeostasis cytokine)
IL-15 Interleukin-15 (memory cell homeostasis cytokine)
IL-2 Interleukin-2 (pro-growth, proliferation cytokine)
IL-10 Interleukin-10 (anti-inflammatory, repressor cytokine)
IFN-γ Interferon gamma Treg T regulatory cell
AMPK Adenosine-mono-phosphate kinase
mTOR Mammalian Target of Rapamycin
Bcl-2 B-cell lymphoma 2
HB Hepatitis B
HA Hepatitis A
LepRH-/- Hypothalamic Leptin Receptor knockout mouse
LepRHFlox/Flox Hypothalamic Leptin Receptor Flox mouse
Glut1 Glucose transporter 1
ATMs Adipose Tissue Macrophages
APCs Antigen presenting cells
MHCII Major histocompatibility complex II
Akt Protein kinase B (serine/threonine protein kinase)
Th2 T helper 2 subtype (CD4+ lineage)
Th17 T helper 17 subtype (CD4+ lineage)
VAT Visceral adipose tissue
CD4+ Cluster of differentiation 4 – helper T cell marker
CD8+ Cluster of differentiation 8 – cytotoxic T cell marker
CD153+ Cluster of differentiation 153 – TNFα ligand or CD30 ligand CD44+ Cluster of differentiation 44 – effector-memory T cell marker
PD-1 Programmed cell death protein 1
GAPDH Glyceraldehyde 3-phosphate dehydrogenase
OXPHOS Oxidative phosphorylation
OCR Oxygen consumption rate (pmoles/min)
ECAR Extracellular acidification rate (mpH/min)
OCR:ECAR OCR/ECAR
FBS Fetal bovine serum
RPMI-1640 Leukocyte culture media
FCCP Carbonyl cyanide-p-trifluoromethoxyphenylhydrazone
BPL B-propiolactone
H1N1 hemagglutinin 1 neuraminidase 1
H3N2 hemagglutinin 3 neuraminidase 2
OCT Organic Cation Transporter
ConA Conacanavalin A
ANOVA Analysis of variance
ILI Influenza-like illness
HAI Hemagglutination inhibition assay
CHAPTER I - BACKGROUND Introduction
Prevalence rates of obesity have exponentially increased within the past few decades [1].
This dramatic rise in cases of obesity increases the risk for a variety of chronic and infectious
diseases. Of particular note, obesity increases the risk of morbidity and mortality to influenza
virus infection independent of other co-morbidities [2]. In any given year, roughly 3,000 to
50,000 people die from influenza infection in the United States [3]. However, in pandemic years,
as was the case in 2009 with the pandemic H1N1 influenza outbreak, the number of incident
cases and resultant deaths from influenza infection greatly increases, especially in high risk
populations like children, the elderly and the obese.
The immune response to infection involves a complex orchestra of diverse cell types,
including dendritic cells, macrophages, natural killer cells, and B and T cells. As one of the most
prominent and critical players in the response to infection, subsets of T cells range in activity
from supporting the function and activation of other immune cells, as well as T cells themselves,
to producing pro and anti-inflammatory proteins. Furthermore, cytotoxic T cell subsets are
instrumental in the elimination of pathogen-infected host cells. This diversified set of
immunologically adaptive immune cells plays a critical and central role in combating pathogens.
A number of T cell knockout models have demonstrated that removal of any subset of T cells
during an infectious challenge often results in higher rates of morbidity and mortality. For many
years, T cell activation and function was believed to occur from a combination of antigen
studies have clearly demonstrated that the cellular metabolism of the T cell is also a key player
affecting differentiation, proliferation, function and its ultimate fate [6-11].
Recent publications of how metabolic fuels such as glucose, amino acids and fatty acids
elicit distinct metabolic profiles depending on cell state (naïve, effector or memory) and subtype
(Th1, Th2, Th17, Treg, etc.) [7,12-14], has led to a revolution in the understanding of T cell
driven immunity. Furthermore, these findings highlights the metabolic plasticity of T cells to
respond to the energetic and biosynthetic demands required to successfully fight infection. For
primers on T cell metabolism, refer to the excellent reviews by MacIver et al. [4] and Buck et al.
[5].
Although T cells respond to antigenic challenge by altering their metabolic state, what is
not as well understood is how metabolic dysfunction may alter their ability to function. One such
altered metabolic environment that may have a profound effect on T cell function is obesity.
Obesity has classically been characterized as a state of excess adiposity and is associated with
chronic inflammation and metabolic dysfunction such as hyperglycemia, hyperleptinemia and
hormone resistance [15]. These uncontrolled metabolic alterations can lead to the development
of chronic diseases such as type II diabetes, nephritis and/or chronic kidney disease,
cardiovascular disease and specific cancers [16]. However, recent data from our lab and others
demonstrate a link between obesity and increased incidences of infectious diseases, most likely
through impaired cellular and humoral immune responses [16,17].
Considering recent findings on how T cell metabolism drives cellular function and
survival, understanding how obesity impacts these processes in T cells remains critical. Here, we
examine the impact of obesity on lymphocyte metabolism, specifically CD4+ and CD8+ T cells,
high-throughput method to determine metabolic profiles of cells to explore possible mechanisms for T
cell impairment in the context of obesity. Given this exponential increase in the prevalence of
obesity over the past few decades, coupled with the increasing threat of influenza epidemics and
pandemics, understanding how the complex metabolic state of obesity influences immunity
warrants investigation.
T cell metabolism supports cell survival and function
T cells display metabolic flexibility unlike other cells in the body. Upon stimulation of
the T cell receptor (TCR) and costimulatory receptors, T cells undergo a dramatic metabolic shift
from a quiescent to an activated state, highlighted by a change from primarily catabolic to
anabolic metabolism (Figure 1) [7]. The shift from oxidative phosphorylation to glycolysis
produces ATP and supports the generation of nucleotides and amino acids for the production of
daughter cells necessary to mount an effective immune response [18]. Importantly, this
glycolytic shift supports effector functions, which vary depending on T cell subtype [6,14,19].
After clearance of the infection, the majority of effector T cells undergo apoptosis, with a small
subset remaining as long-lived memory T cells [20,21]. These memory T cells revert back to a
relatively quiescent catabolic state. However, unlike their naïve cell counterparts, memory T
cells quickly respond to antigenic challenge upon re-exposure through elevated metabolic
Figure 1: T cell metabolism and state of quiescent and activated T cells. Quiescent T cells utilize oxidative
respiration of glucose-derived pyruvate as well as fatty acids and amino acids to produce ATP through the TCA
cycle and electron transport chain. This energy production supports immune surveillance and homeostasis. Upon
stimulation of the T cell receptor (TCR) and costimulatory receptors, T cells upregulate glycolysis and glutamine
oxidation while reducing fatty acid oxidation to support cell growth, differentiation and the production of daughter
cells. Following clearance of the pathogen, the majority of T cells undergo apoptosis with a subset surviving as
memory T cells, which return to a quiescent state dependent on oxidative phosphorylation of fatty acids.
These distinct metabolic states of T cells require signaling molecules to support
homeostasis, effector function and survival. Cytokines such as IL-7 and IL-15 sustain the
catabolic survival functions of naïve and memory T cells, respectively [19,24,25]. Other
cytokines, such as IL-2, elicit proliferation [26], while interferon gamma (IFN-γ) promotes pro-inflammatory T cell subtypes like Th1 and cells of innate immunity [27]. T cell subsets also help
to down-regulate the inflammatory response once pathogen clearance has occurred. For example,
regulatory T cells (Treg) and the cytokine IL-10 help to suppress T cell activation and
Aside from cytokine and growth factor signals, nutrients and hormone signaling also
influence T cell metabolism [11,26,29]. These signals affect regulatory pathways controlled by
enzymes such as the mammalian target of rapamycin (mTOR) and AMP-activated protein kinase
(AMPK) to influence cell growth/proliferation or homeostasis [30,31]. In the absence of these
extrinsic signals, T cells lose their ability to maintain homeostasis and eventually succumb to
apoptosis through Bcl-2 mediated cell death [10,31].
Obesity impairs the immune response to infection
As of 2014, for the first time in recorded history, obese adults outnumber underweight
adults worldwide, with the global prevalence of obesity equaling 10.8% in men and 14.9% in
women [1]. In the United States, obese adults comprise 36.5% of the population [32]. Obesity
has been linked to increased incidences of infectious diseases, including periodontal infections,
influenza, bacterial pneumonia, nosocomial and surgical site infections, among others [2,16].
Furthermore, obesity has been shown to impair immunological responses in both adults and
children [33-35].
Following the first influenza pandemic of the 21st century, obesity was identified as an
independent risk factor for increased morbidity and mortality from pandemic H1N1 infection [2].
Our laboratory studied the response to influenza vaccination in obese adults and found that
increasing BMI was associated with greater declines in influenza-specific antibody titers
one-year post vaccination [34]. In addition, influenza-stimulated T cells from obese adults were less
functional and less activated compared with T cells from vaccinated healthy weight adults [36].
implicated in reduced function of Treg cells in obese patients with asthma [38]. Finally, growing
evidence suggests that obesity impairs immune responses to vaccines such as hepatitis B (HB),
hepatitis A (HA), rabies and tetanus, and that it increases risk of several bacterial infections [39].
Despite growing evidence supporting the notion that obesity impairs immunological
responses to infection, it is worth noting that some studies have found a protective effect of
obesity against infection. Roth et al., in their review of over 20 epidemiological studies, found
that obesity was associated with better outcomes from infections such as tuberculosis,
community-acquired pneumonia and sepsis [40]. They argue that aspects of the metabolic
syndrome often found in obesity provide an advantageous niche for immune cells to fight off
infection. While there is controversy between findings on obesity’s impact on the immune
response to infection, it is important to note that obesity is a multifactorial condition that impacts
a variety of tissue and organ systems.
Obesity alters the metabolome during infection
Studies using murine models of obesity have shown great similarity to obesity in humans,
providing a translational model to study this complex condition [41]. Recent studies have shown
altered metabolic profiles in diet-induced and genetically obese mice following influenza virus
challenge in vivo. Using 1H NMR and global liquid chromatography-mass spectrometry, Milner
et al. reported specific alterations in the metabolic profiles of influenza-infected diet-induced
obese mice when compared with infected lean mice in serum, liver, lung, mesenteric white
adipose tissue, urine, feces and bronchoalveolar lavage fluid [42,43]. Changes in metabolites
from obese mice compared to lean mice, correlating with increased lung damage and mortality
observed in the infected obese mice [43].
Notably, obese mice showed significant fold increases in glutamyl-proline,
tetrahydrocortisol, 3-hydroxybutyric acid and numerous acyl-carnitine metabolites in lung tissues
[43], suggesting that differential metabolism in these tissues may be driving immune
dysregulation in the influenza-infected lung. Additionally, diet-induced obese mice had a 55-fold
increase in p-cresol sulfate concentrations in lungs at 4 days post infection compared to lean
mice [43]. P-cresol sulfate, a metabolite produced by gut microbiota during secondary
metabolism of p-cresol, accumulates during kidney failure and can impact cell function [43].
This increase in secondary metabolites in obese mice suggests that the obese microbiome may
differ from lean, and thus contribute to differences in immune function.
In order to differentiate between the effects of diet vs. obesity, mice lacking hypothalmic
leptin receptors (LepRH-/-) were utilized in the influenza infection model. LepRH-/- knockout mice
were established by crossing fully floxed leptin receptor mice with Cre transgene expressing
C57BL/6J-Tg(Nkx2-1-cre)2S mice driven by the Nkx2.1 promoter. These transgenic mice
lacked leptin receptor signaling in hypothalamic neurons, resulting in obesity from excess
consumption of a low fat chow diet thereby removing the influence of high fat diet on immune
function. Compared to lean controls (LepRHFlox/Flox consuming an identical diet), obese mice that
gained weight on the chow diet exhibited altered metabolic profiles. Similar to high fat fed
diet-induced obese mice, the LepRH-/- obese mice had higher fatty acid, cholesterol and nucleic acid
metabolites in urine and lung tissues following influenza virus infection [43]. Again, these
variations in metabolites correlated with greater lung pathology and inflammation, as well as
lavage fluid during the immune response to influenza virus infection [43]. These studies suggest
that obesity itself, not the diet, alters metabolites both in circulation and in tissue specific regions
impacted by infection. This work supports the notion that obesity alters the metabolic landscape
of the host, thus impairing T cell function, leading to increased susceptibility to infectious
disease.
Adipocytes in the obese state promote inflammatory T cell activation through altered metabolism
Another theory as to how obesity impairs the T cell response to infection involves the
distorted cytokine and adipokine milieu brought about by excess adiposity. Leptin, a hormone
involved in energy homeostasis, has been shown to be essential for glucose uptake in effector T
cells [29]. Upregulation of Glut1 transporters by leptin signaling under normal conditions
represents a bioenergetic advantage for T cells to prevent suppressed proliferative and functional
responses when glucose concentrations become limited [10,26,29]. However, in obesity, when
leptin secretion becomes systemic and chronic, leptin signaling may lead to altered CD4+ T cell
differentiation. Leptin signaling has been shown to promote pro-inflammatory T cell subtypes,
Th1 and Th17 [29,44,45], suggesting leptin plays a critical role in the development of an
inflammatory adipose tissue microenvironment. Leptin’s role in modulating T cell repertoires,
leading to inflammatory adipose tissue microenvironments is further supported by the discovery
of pro-inflammatory CD8+ T cells precede adipose tissue macrophage (ATM) infiltration in
visceral adipose tissue, with marked declines in CD4+ helper T cell and Treg cell populations in
Infiltration of T cells in adipose tissue has received attention for its suggested role in the
development of insulin resistance [47]. Recent findings by Morris et al. identified a mechanism
by which ATMs function as antigen presenting cells (APCs) to regulate the activation of CD4+ T
cells in mice [48]. This finding, reproduced by Cho et al., identified a novel MHCII-dependent
activation loop between CD4+ T cells and ATMs which supports T cell driven metainflammation
in adipose tissue in mice [49].
However, large human adipocytes also activate CD4+ T cells through
MHCII-upregulation, thereby acting as APCs to stimulate T cell inflammatory effector functions [50].
This activation of adipose tissue associated T cells by MHCII-mediated APCs and leptin
costimulation supports the notion of an inflammatory microenvironment in obese adipose tissue.
These findings suggest the possibility that obesity leads to suppressed T cell response to
infection through altered T cell populations caused by premature activation to pro-inflammatory
T cell subtypes.
Adipocytes in the obese state promote T cell senescence
Senescence, typically associated with aging, is described as a fate in which cellular
proliferation becomes halted but metabolic activity and function remain [51]. This cell
phenotype represents a state of cellular exhaustion, with chronic activation of Akt and mTOR,
thereby supporting cytokine production but limiting proliferation [51,52]. Recently, obesity was
proposed to increase T cell senescence in visceral adipose tissue (VAT) of high fat fed obese
mice [53]. These mice displayed increased accumulation of CD153+PD-1+CD44+CD4+ T cells in
secretion and VAT inflammation [53]. Previously, osteopontin has been shown to be a Th1
promoting cytokine that supports pro-inflammatory function [54].
This increased production of PD-1 (programmed cell death-1), an exhaustion/tolerance
marker, [55], signals an exhausted state of visceral adipose T cells. This role of PD-1 as an
immune regulator of TCR activation in effector T cells is evidenced by the establishment of
PD-1 expressing CD8+ effector memory T cells, and not central memory T cells [56]. Furthermore,
strength of PD-1 expression is tied to signaling activation and effector function in T cells, such
that high expression of PD-1 is needed for cell exhaustion but only low levels are required to
disrupt some functions such as IL-2 or TNF-α secretion [57].
Finally, CD4+ T cell metabolism alters PD-1 expression in mice cultured with galactose
versus glucose [58]. This forced alteration in T cell metabolism from aerobic glycolysis to
oxidative phosphorylation (OXPHOS) resulted in differences in glyceraldehyde 3-phosphate
dehydrogenase (GAPDH) and PD-1 expression, correlating with impairments in IFN-γ
production [58]. Given aerobic glycolysis’ critical requirement in optimal IFN- γ production, this connection between aerobic glycolysis and PD-1 expression demonstrates a novel mechanism
through which T cell function is influenced by nutrition. How long-term exposure to obesogenic
conditions impacts gene expression remains unresolved. However, some recent studies suggest
that obesity can lead to the hypermethylation of lymphocyte DNA in humans and animals
[59,60], thereby implicating an epigenetic component that supports the conditions of obesity
Hypotheses
Despite the lack of direct evidence linking obesity and altered T cell metabolism with
impaired immune response to infection, foundations from several studies over recent years
support the hypothesis that obesity disrupts T cell metabolism, resulting in impaired function.
Altered metabolism of the obese host has been shown both in the steady state and during
infection. Hormone resistance, inflammation and alterations in nutrient levels all influence T cell
activation, function and survival. A surfeit of nutrients such as glucose and fatty acids, along
with excess leptin production in the obese state, may elicit the activation of T cells in the absence
of specific pathogens, thus, skewing naïve and memory cells towards inflammatory Th1 & Th17
subtypes, while reducing anti-inflammatory Treg repertoires (Figure 2). The response to infection
in an obese environment most likely would result in disrupted T cell metabolism through
increased glycolytic and oxidative flux and cause impaired T cell response by promoting
inflammation and reducing anti-inflammatory immune surveillance.
Here, we examined the immunometabolic profile of isolated peripheral blood
mononuclear cells (PBMCs) and T lymphocytes from adult white women vaccinated against
influenza virus. Using high-throughput extracellular flux analysis, we show that obesity induced
higher rates of aerobic glycolysis and mitochondrial respiration in PBMCs in both quiescent and
activated states. Furthermore, obesity alters basal respiration and basal glycolysis of quiescent
CD4+ and CD8+ T cells, with notably higher rates of OXPHOS compared to healthy weight
controls. Given the reliance of effector T cells on glucose metabolism to facilitate effector
functions, we hypothesized that obese non-diabetic subjects would differ from obese
metformin-treated diabetic subjects with insulin resistance and resultant glucose dysregulation. Interestingly,
that metformin treatment had not restored homeostatic glucose levels. However, CD4+ and
CD8+ T cells from obese metformin-treated subjects exhibited levels of basal respiration and
glycolysis similar to cells from healthy weight controls. This finding suggests metformin may
work to restore homeostatic metabolism of quiescent CD4+ and CD8+ T cells. Finally, activated
CD4+ and CD8+ T cells exhibited no differences in aerobic glycolysis or OXPHOS, but did
show differences in spare respiratory capacity, suggesting that elevated glucose levels do not
drive impairments in effector T cell function in the obese state.
Taken together, this investigation provides the first demonstration of obesity-driven
metabolic alterations of T cells. These observed alterations in quiescent and activated T cell
metabolism might account for impairments in T cell function. Furthermore, elevated glucose
levels did not account for differences in obese subjects; suggesting that other factors associated
with obesity, and not excess glucose, result in altered T cell metabolism. How chronic exposure
to excess nutrients like lipids, hormones and/or inflammation influences gene regulation and
immune function in lymphocytes remains unknown. However, trends from this work support the
notion that obesity is a complex and multifactorial condition, most likely influencing immunity
through a number of mechanisms. With the recent explosion in cases of obesity in the United
States and around the globe, understanding how this diverse metabolic state influences immune
responses to infection warrants further investigation.
The results of this investigation are expressed in Chapter 2 as a journal manuscript, with
Figure 2: Potential mechanisms of impairment of normal T cell signaling and response to infection in obesity.
Nutrients, leptin and inflammation signals cause a disruption of normal T cell metabolism, resulting in impaired
cellular functions. Long-term exposure to these extrinsic signals alters the metabolic profile of T cells, impacting
their feedback of cytokine secretion and functional response to infection. Whether or not long-term exposure results
in epigenetic changes, or metabolite influence from obese microbiota has yet to be determined. TCR, T cell receptor.
CHAPTER II – JOURNAL MANUSCRIPT
1Obesity induces metabolic alterations of T lymphocytes in influenza-vaccinated adults
Summary
An epidemic of obesity in both adults and children over the past three decades increases
the risk of chronic and infectious diseases. Within the past few years, obesity has been shown to
impair the adaptive immune response to infection through alterations in T cell functioning.
Importantly, obesity has been shown to increase morbidity and mortality from influenza
infection. Animal and human studies show that obesity impairs the activation and function of
influenza-specific T cell response. This diverse cell population relies heavily on glucose and
glutamine metabolism to support critical effector functions when pathogenically challenged.
Recent findings in the fields of obesity and T cell mediated immunity demonstrate a unique
relationship between altered mechanisms of T cell metabolic homeostasis and plasticity of
adaptive immune responses in the obese setting. Here, we show that obesity alters the quiescent
and activated metabolic profile of peripheral blood mononuclear cells, and more critically, CD4+
and CD8+ T cell lymphocytes in white women vaccinated against influenza virus. Furthermore,
T cells from obese non-diabetic subjects with no metabolic dysregulation of glucose exhibit
higher rates of aerobic glycolysis and mitochondrial respiration compared to obese
metformin-treated diabetic subjects. This restorative effect of metformin occurs in the absence of restored
therapeutic benefits beyond hepatic and peripheral glucose homeostasis. While results from this
study require further investigation to confirm its findings with larger sample sizes and in
populations other than white women, these results support growing evidence that perturbations in
T cell metabolism drive the impaired immune response of T cell lymphocytes, stemming from
chronic nutrient, hormone and adipokine dysregulation in the obese. Our findings may provide
the mechanistic link for obesity-driven impaired immune response to influenza infection and
vaccination.
Introduction
Currently, obesity ranks as one of the largest growing epidemics in the United States and
worldwide [61]. In the US alone, obese adults comprise 36.5% of the population with 15-20% of
children and youth classified as obese [32,61]. Obesity has been linked with higher incidences of
infectious diseases, including periodontal infections, influenza, bacterial pneumonia, nosocomial
and surgical site infections, among others [2,16]. Classically characterized as a state of excess
adiposity, obesity has been associated with chronic inflammation and metabolic dysfunctions
such as hyperglycemia, hyperleptinemia and hormone resistance [15]. These uncontrolled
metabolic conditions can lead to the development of chronic diseases such as type II diabetes,
kidney disease, cardiovascular disease and specific cancers [16]. However, recent data
demonstrates a link between obesity and increased incidences of infectious diseases, most likely
through impaired cellular immune responses [16,17].
Following the first pandemic influenza outbreak of the 21st century, obesity was
identified as an independent risk factor for increased morbidity and mortality from pandemic
in obese adults compared to healthy weight adults. Using influenza vaccination as a model to
study the immune response in obesity, our lab has demonstrated that increasing BMI was
associated with greater declines in influenza-specific antibody titers one-year post vaccination
[34]. Furthermore, when isolated peripheral blood mononuclear cells (PMBCs) from influenza
vaccinated healthy weight, overweight and obese adults were stimulated with H1N1 influenza
virus in vitro, CD4+ and CD8+ T cells from obese and overweight adults expressed fewer
activation and functional markers compared to healthy weight adults [36]. These impairments
included less expression of activation markers CD28, CD40 ligand, CD69 and IL-12R as well as
reduced expression of IFN-γ and granzyme B, critical cytokines produced by effector T cells involved in influenza clearance [36]. Additionally, no differences were seen in dendritic cell
activation or function, suggesting obesity impacts T cell activation and function independent of
antigen presentation. Given obesity’s numerous metabolic and micro-environmental effects
through long-term net positive caloric intake and resultant hormone/cytokine dysregulation,
understanding how these factors influence T cell function remains unresolved and critically
important.
For many years, T cell activation and function was believed to occur from a combination
of antigen recognition, subsequent signaling cascades and micro-environmental cues [4,5].
Within the past decade, cellular metabolism has been shown to critically influence T cell
differentiation, proliferation, function and ultimately their cellular fate [6-11]. Reports of how
metabolic fuels such as glucose, amino acids and fatty acids elicit distinct metabolic profiles
depending on cell state (naïve, effector or memory) and subtype (Th1, Th2, Th17, Treg, etc.)
[7,12-14], has led to a revolution in the understanding of T cell driven immunity. Furthermore,
energetic and biosynthetic demands required to successfully fight infection [8]. Although it is
known how T cells respond to antigenic challenge by drastically altering their metabolic state,
what is not as well understood is how altered metabolic conditions such as obesity may influence
T cell metabolic programming, thus impairing T cell function and response to infection.
In this investigation, a subgroup of white women age 35 to 65 were recruited from the
previously established prospective observational cohort study on influenza vaccination at the
University of North Carolina at Chapel Hill’s Family Medicine Center, Chapel Hill, NC.
Subjects were recruited following enrollment from the traditional influenza study cohort for a
one-time blood draw in March 2016 and February/March 2017. Subjects included three
demographic classes: healthy weight non-diabetics (BMI 18.5 to 24.9; fasting glucose <
100mg/dL), obese non-diabetic (BMI ≥ 30.0; fasting glucose < 100mg/dL) and obese metformin treated diabetics (BMI > 30.0; fasting glucose > 125mg/dL). PBMCs, CD4+ and CD8+ T cells
were isolated from each subject and metabolically profiled using high-throughput extracellular
flux analyzers (XF24 and XFe96). This technique provides a measure of aerobic glycolysis and
mitochondrial oxidative phosphorylation for cells types of interest, to allow for the rapid
metabolic characterization of cells.
Given that T cells predominately rely on glucose and glutamine metabolism for
homeostasis and effector functions, we hypothesized that obesity would increase the metabolic
profile of freshly isolated quiescent CD4+ and CD8+ T cells, thereby giving a snapshot of the
metabolic programming of these cell types within the host. Furthermore, upon stimulation in
culture, when these cells become highly glycolytic and require glucose and glutamine to support
proliferation, cell survival and effector function, we hypothesized that obesity would increase the
healthy weight subjects, suggesting that previously observed impairments in effector functions
may be due to alterations in metabolic programming of isolated T cells, stemming from the obese
environment. Finally, obese metformin-treated diabetics were included as a separate group to
determine the effect of a metabolic drug on T cell metabolism in an uncontrolled glucose
environment. Previous research has shown that metformin treatment facilitates memory T cell
formation and function, possibly through restored T cell metabolic activity [62,63]. Recent data
also suggests that metformin may be protective against cancer formation and beneficial also as a
cancer therapeutic [64].
Here we show altered metabolic profiles of CD4+ and CD8+ T cells isolated from
healthy weight, obese non-diabetic and obese diabetic subjects vaccinated against influenza
virus. These differences in metabolism present a novel mechanism through which T cell function
may be compromised due to non-optimal metabolic flux, supporting the notion of obesity
inducing pro-inflammatory T cell subtype differentiation and impairment of resting or quiescent
T cell populations. Furthermore, we demonstrate that influenza specific HAI antibody titers from
healthy weight, obese non-diabetic and obese metformin-treated diabetic adults respond to
vaccine at 30 days, but fall at six months post vaccination, with no differences between groups.
This data suggests that T cell mediated responses, and not antibody seroconversion or
seroprotection, should be considered when assessing for correlates of protection from influenza
infection.
Methods & Materials
Subjects. Participants were recruited from the prospective observational cohort study conducted
of North Carolina at Chapel Hill Family Medicine Center, Chapel Hill, NC [36]. Adult white
females age 35 to 65 vaccinated against influenza virus were recruited as a study cohort
subgroup following written informed consent under approval of the University of North Carolina
at Chapel Hill’s Biomedical Institutional Review Board. Venous antecubitual serum and plasma
was obtained using aseptic phlebotomy in overnight fasting subjects. Participants had previously
received either the 2015-2016 or 2016-2017 quadrivalent influenza vaccination (FLUARIX®
481035) from UNC-Family Medicine as part of their normal preventative care prior to enrolling
in the study subgroup.
The strains in the 2015-2016 influenza vaccine included: A/California/07/2009(pH1N1),
A/Switzerland/9715293/2013(H3N2), B/Phuket/3073/2013, and B/Brisbane/60/2008. The strains
in the 2016-2017 influenza vaccine included: A/Christchurch/16/2010 (H1N1) NIB-74XP (an
A/California/7/2009 (H1N1) pdm09-like virus), A/Hong Kong/4801/2014 (H3N2) NYMC
X-263B, B/Phuket/3073/2013, and B/Brisbane/60/2008. Exclusion criteria included:
immunosuppressive drugs or diseases like HIV, acute febrile illness, autoimmune disease,
medical history of immunotherapy for cancer, history of Guillain-Barre syndrome, and any
hypersensitivity to influenza vaccine components.
Subjects were recruited from March 2016 to March 2017, with blood draws no closer
than two months apart to ensure compliance with IRB approved procedures. Blood draws
occurred in two phases; the first in March 2016 for initial PBMC characterization (n=7),
followed by a second wave of blood draws in February/March 2017 (n=9). Height and weight
measurements were taken to calculate body mass index (BMI = (kg)/height(m)2), as well as
medical history to determine diabetes status and drug medications. Fasting glucose was
Neo). Three groups of participants were recruited: healthy weight with no history of diabetes
(BMI 18.5 – 24.9; fasting glucose < 100 mg/dl), obese non-diabetic (BMI ≥ 30.0; fasting glucose
< 100), and obese diabetic patients actively taking metformin (BMI ≥ 30.0; fasting glucose >
125). As part of the traditional influenza vaccine study, participants were monitored during flu
season for cases of medically confirmed influenza and influenza-like illness (ILI), defined as a
fever over 100oF and a cough in the absence of any other medical diagnosis [65]. Demographics
of subjects are displayed in Tables 1 & 2.
Cell Isolations & Stimulation. Peripheral blood mononuclear cells (PBMCs) were isolated from
fresh plasma using Histopaque-1077 (Sigma-Aldrich, St. Louis, MO) gradient separation as
previously described [36]. PBMCs were washed twice with Ca2+ and Mg2+ free HBSS before
being re-suspended in complete RPMI-1640 containing 10mM glucose, 2mM glutamine, 10%
FBS and penicillin/streptomycin (Sigma-Aldrich, St. Louis, MO) and counted using a
hemocytometer. PBMCs were cultured in complete RPMI-1640 for 72hrs at 37oC and 5% CO2
withor without treatment with a PBS control or 0.5µg/µL lectin mitogen, concanavalin A
(Sigma-Aldrich), per 1x10⁶ PBMCs. Isolated CD4+ and CD8+ T cells were obtained using
negative selection exclusion beads (StemCell Technologies, Vancouver, Canada) following
PBMC isolation. Isolated T cells were stimulated using anti-CD3/anti-CD28 magnetic beads (1:1
cell to bead ratio) and 30IU IL-2 (ThermoFisher Scientific, Waltham, MA) in complete
RPMI-1640 containing 10mM glucose, 2mM glutamine, 5% autologous plasma and
penicillin/streptomycin for 72hrs at 37oC and 5% CO2. Isolated T cells were cultured using
conditions of the host for each subject, thereby activating cells in their host milieu of fatty acid,
hormones, growth factors, etc.
Metabolic Assays. Mitochondrial stress tests were performed on cells using Agilent’s XF24 and
XFe96 flux analyzers. Unstimulated (control) and concanavalin A stimulated PBMCs were
assayed using the XF24 extracellular flux analyzer as previously described [6]. Cells were
counted, attached to culture plates via CellTak adhesion at 1.2x10⁶ cells per well in non-buffered
DMEM with 25mM glucose and 1mM glutamine (Sigma-Aldrich, St. Louis, MO). Oxygen
consumption rates (OCR) and extracellular acidification rates (ECAR) were measured at 37oC
under basal conditions and in response to 1µM oligomycin (an ATPase inhibitor), 0.5µM
fluoro-carbonyl cyanide phenylhydrazone (FCCP) (a mitochondrial uncoupling agent) and 0.75µM
rotenone (complex I inhibitor) and1.5µM antimycinA (complex III inhibitor) (Sigma-Aldrich, St.
Louis, MO).
Freshly isolated CD4+ and CD8+ T cells and 72hr CD3/CD28 + IL-2 stimulated CD4+
and CD8+ T cells were assayed using the XFe96 extracellular flux analyzer. Cells were plated as
previously described at 2x10⁵ cells per well in non-buffered RPMI-1640 with 10mM glucose,
2mM glutamine and 1mM pyruvate. Oxygen consumption rates (OCR) and extracellular
acidification rates (ECAR) were measured at 37oC under basal conditions and in response to
1µM oligomycin (an ATPase inhibitor), 1.5µM fluoro-carbonyl cyanide phenylhydrazone
(FCCP) (a mitochondrial uncoupling agent), 0.1µM rotenone (complex I inhibitor) and1.0µM
antimycinA (complex III inhibitor) (Sigma-Aldrich, St. Louis, MO).
Metabolic parameters were calculated as follows. Basal respiration (OCR (pmoles/min)
measurement before injection of oligomycin. Maximal respiration was determined as the peak
OCR (pmoles/min) following injection of FCCP, while spare respiratory capacity was calculated
as the Max OCR – Basal OCR. Finally, OCR:ECAR ratio was determined by dividing the basal
respiration by basal glycolysis. Non-mitochondrial respiration (OCR following
rotenone+antimycin A injection) was not subtracted from these observed readings, as commonly
reported in previous studies, in order to reduce variance from drug injection effects and reduce
differences in plate measurement between metabolic platforms, thus allowing for total
representation of all O2 consumption and H+ production by cells in these metabolic parameters.
Influenza Specific Antibody Determination. Serum was obtained for each subject by allowing
whole blood to clot at room temperature for 30mins prior to refrigeration at 4oC over night and
centrifugation at 800xg at 40C for 10mins. Serum antibody titers for A/California/7/2009(H1N1)
were determined via hemagluttination inhibition assay as previously described [66]. Samples
were assessed in duplicate and represent mean for each individual subject at day 0
(pre-vaccination), 30 days post vaccination, six months post vaccination and one year post
vaccination.
Statistical Analysis. Values for oxygen consumption (OCR) and extracellular acidification
(ECAR) from technical replicates were averaged for each well. Physiologically impossible
values for OCR or ECAR (values ≤ 0) were excluded. Biological medians ± standard error was reported as shown to reduce effect of skew from outliers. Data was assessed for significance by
one-way or two-way ANOVA followed by Tukey’s multiple comparisons where denoted.
groups. Correlation coefficients were determined by Spearman’s rank correlation. Data was
determined to be statistically significant when p < 0.05. All analyses were conducted in
Graphpad Prism 7.0 for Mac OS X.
Results
PBMCs from obese adults display altered metabolism compared to healthy weight adults. In
order to assess if obesity alters the global metabolism of circulating immune cells, peripheral
blood mononuclear cells (PBMCs) were isolated from healthy weight, obese non-diabetic and
obese metformin-treated diabetic subjects and assayed using the mitochondrial stress test with an
XF24 extracellular flux analyzer (Fig. 3). Quiescent (resting) PBMCs from both obese
non-diabetic and obese metformin-treated non-diabetic subjects had a ~1.5x higher basal respiratory rates
compared to healthy weight adults (Fig. 3C), with no differences in basal glycolysis (Fig. 3D).
No significant differences were observed in the cells spare respiratory capacity (SRC) between
groups, a measure of cellular ability to metabolically respond to energetic demands (Fig. 3E).
Additionally, no differences were seen in the ratio of basal oxygen consumption to basal
glycolysis (OCR:ECAR) (Fig. 3F). However, for both SRC and OCR:ECAR ratio, an upward
trend was seen in both obese groups compared to healthy weight.
PBMCs include a diverse set of leukocytes including lymphocytes (T cells, B cells, NK
cells) as well as monocytes and dendritic cells [67]. Upon treatment with concanavalin A (Con
A), a T cell specific lectin mitogen, antigen presenting cells (APCs) display Con A peptides to
CD4+ and CD8+ T cells causing global activation of PBMCs through a T cell mediated
mechanism [68]. When cells were treated with Con A (activated) as opposed to a PBS control
with Con A resulted in activation of these cells in culture, thus causing dramatic shifts in their
metabolic programming (Fig. 3A-B). Interestingly, obese non-diabetic and obese
metformin-treated diabetic subjects showed greater induction in basal OCR, with only obese non-diabetics
having higher basal ECAR, compared to healthy weight adults (Fig. 3C-D). Again no significant
differences between groups were observed in SRC or OCR:ECAR (Fig. 3E-F).
Quiescent CD4+ T cells display trends in elevated respiration in obese non-diabetic subjects,
with obese metformin-treated diabetics more like healthy weight. Freshly isolated CD4+ T cells
were subjected to a mitochondrial stress test using the XFe96 flux analyzer, measuring OCR and
ECAR in response to olgiomycin, FCCP, and antimycin A + rotenone (Fig. 4A-B). Similar
trends were seen in basal OCR, basal ECAR and SRC, with obese non-diabetic CD4+ T cells
exhibiting higher rates compared to healthy weight and obese metformin-treated diabetic CD4+
T cells (Fig. 4C-E). No differences in trends were seen in OCR:ECAR (Fig. 4F). Despite a lack
of significant differences between these measures, likely due to a low sample size, these trends
suggest that freshly isolated quiescent CD4+ T cells from obese non-diabetic adults have a
higher metabolic profile of aerobic glycolysis and mitochondrial respiration than healthy weight
or obese metformin-treated diabetic CD4+ T cells.
Activated obese non-diabetic CD4+ T cells display trends in elevated basal respiration and
SRC than healthy weight CD4+ T cells. Freshly isolated CD4+ T cells were activated using
anti-CD3 and anti-CD28 antibody coated beads for 72hrs in the presence of IL-2. Compared to
quiescent T cells (Fig 4.), activation of CD4+ T cells resulted in greatly increased rates of
stimulated CD4+ T cells’ glycolytic rates between groups, when these cells should be
predominately glycolytic. However, trends suggest that activated obese non-diabetic CD4+ T
cells have slightly higher rates of mitochondrial respiration compared to healthy weight and
obese metformin-treated diabetics. Furthermore, obese non-diabetic CD4+ T cells had elevated
levels of SRC, with obese diabetics falling slightly below but not quite returning to healthy
weight levels (Fig. 5E). No differences were seen in OCR:ECAR in stimulated CD4+ T cells
(Fig. 5F).
Quiescent CD8+ T cells display trends suggesting alterations in basal respiration, basal
glycolysis and spare respiratory capacity between healthy weight, obese non-diabetic and obese
metformin-treated diabetics. Quiescent CD8+ T cells display low levels of basal respiration and
glycolysis following isolation, typical of resting CD8+ T cells (Fig. 6A-B). Interestingly, CD8+
T cells from both obese non-diabetic subjects and obese metformin-treated diabetics had higher
trends in basal respiration (Fig. 6C). A negative trend in basal ECAR was observed with obese
non-diabetics and obese metformin-treated diabetics having lower rates of basal glycolysis
compared to healthy weight (Fig. 6D). Additionally, quiescent obese metformin-treated diabetic
CD8+ T cells had lower trends for SRC (Fig. 6E) and higher OCR:ECAR ratio (Fig. 6F),
signifying that obese diabetic CD8+ T cells were more respiratory in nature yet did not achieve
the same maximal respiration after treatment with FCCP.
Activated obese metformin-treated diabetic CD8+ T cells displayed higher trends for aerobic
glycolysis and suppressed SRC compared to healthy weight. As previously seen with activated
and ECAR (Fig. 7B) in all three demographic groups. However, obese metformin-treated
diabetic CD8+ T cells had ~1.5x higher basal ECAR than healthy weight (Fig 7D), with only
~1.2x higher basal OCR induction than healthy weight (Fig. 7C). Trends in obese non-diabetic
OCR (Fig. 7C) and ECAR (Fig. 7D) fell in between healthy weight and obese metformin-treated
diabetics. Additionally, obese metformin-treated diabetics had a ~3 fold lower rate for SRC. This
followed trends of quiescent obese metformin-treated diabetic CD8+ T cells, as they did not
reach similar levels of maximal respiration signifying activated obese metformin-treated diabetic
CD8+ T cells had suppressed metabolic potential for energetic demand following administration
of FCCP (Fig. 7E). Finally, no differences were observed in the ratio of basal OCR to ECAR
between groups (Fig 7F).
No significant differences between basal respiration and glycolysis for quiescent CD4+ T cells
in euglycemic versus diabetic glucose. Despite taking the metabolic drug metformin to restore
serum glucose levels, obese diabetic subjects still had elevated fasting glucose levels compared
to healthy weight and obese non-diabetic subjects (Table 2). To determine if high glucose levels
directly account for altered T cell metabolism, quiescent CD4+ T cells were assessed in
euglycemic (5mM or 90mg/dl) or diabetic level glucose media (10mM or 180mg/dl). No
significant differences were seen in basal OCR (Fig. 8A) or basal ECAR (Fig. 8B) for healthy
weight CD4+ T cells cultured in either 5mM or 10mM glucose media. Healthy weight CD4+ T
cells did exhibit higher maximal respiration and thus higher SRC in 10mM glucose, most likely
A/California/7/2009 antibody HAI titers increase following vaccination and decline at 6
months post vaccination. Influenza specific HAI antibody titers increased following vaccination
(Fig. 9A-B), regardless of weight or diabetic status for both 2015-2016 and 2016-2017 study
years. No differences were seen in seroconversion rates between demographic groups, defined as
a four-fold or greater increase in antibody titer following vaccination, confirming previously
reported seroconversion rates for influenza vaccination in healthy weight, obese and obese
diabetic subjects [66]. However, while not significant due to the small sample size, obese
non-diabetic subjects in for the 2015-2016 study year had a mean fold seroconversion rate of 4.25
compared to 7.5 fold increase for healthy weight subjects (Fig. 9A). Interestingly, influenza
specific HAI antibody titers declined at six months post-vaccination to similar levels as observed
at one year post-vaccination (Fig 9A). Additionally, there were no differences in influenza virus
specific levels of seroprotection between groups, deemed as having an antibody titer of 40 or
greater (Fig. 9A-B).
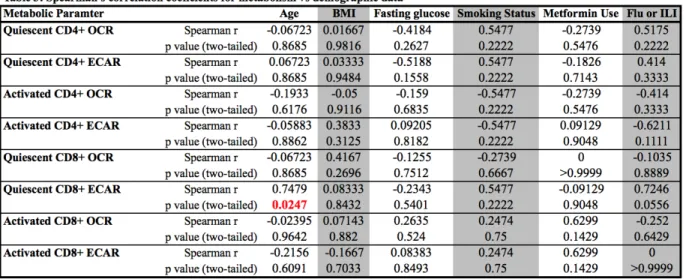
Age significantly correlates with quiescent CD8+ T cell basal ECAR, despite no significant
differences in age for subject group. Using our demographic and metabolic data, we found that
only age significantly correlated with quiescent CD8+ T cell basal glycolysis. However, there
were no significant differences in age among subjects between the three demographic groups.
Several measures approached significance, most notably quiescent CD8+ T cell basal glycolysis
and incidence of influenza or ILI (p = 0.0556) (Table 3). Other notably correlations included
incidence of Flu or ILI with activated CD4+ T cell ECAR (p = 0.111). Again, these correlations
Discussion
Previous studies in our lab demonstrated that compared to influenza vaccinated healthy
weight adults, T cells from obese adults vaccinated against influenza virus were impaired.
Specifically, CD4+ and CD8+ T cells from obese adults, when exposed to pH1N1 in vitro,
expressed less activation and functional markers. These impairments were shown to be
independent of antigen presentation, suggesting alterations in T cells from obese adults may be
due to their distorted metabolic environment [36]. Additionally, our lab has shown that,
compared to healthy weight adults, obese adults have greater declines in antibody titers at
one-year post vaccination [34]. Finally, we have shown that obese adults have twice the risk of
influenza or influenza like illness despite equivalent levels of seroconversion and seroprotection
from influenza vaccination (Neidich et al. 2017, under review). This recent finding challenges
the current standard for correlates of protection, suggesting that a T cell mediated response and
not antibody threshold is required to achieve vaccine protection in obese adults. Despite this
newfound understanding, the cause of T cell impairment in obesity remains elusive.
Recent attention identifying the importance of cellular metabolism for lymphocyte
function highlights a novel mechanism through which obesity may influence immunity.
Technological advancements in the assessment of cellular metabolism using high-throughput,
real-time measures allows for the diverse characterization of a wide array of cellular phenotypes
and pathologies. As our understanding of how metabolism is altered in a number of pathological
events such as infection or cancer, this rapid profiling of cellular metabolism offers tremendous
benefits for drug screening, pathogenic phenotyping and more. In the case of obesity, this
aerobic glycolysis and mitochondrial respiration in live cells, thus generating insights that can be
used to guide targeted assessments of metabolic and signaling pathways altered in obesity.
Here, compared to influenza vaccinated healthy weight adult white women, we report
differences in metabolic profiles for obese non-diabetic and obese metformin-treated diabetic
adults. Quiescent PBMCs from obese non-diabetic and obese metformin-treated diabetic subjects
demonstrated higher basal respiratory rates, suggesting global metabolic programming is altered
in obese adults compared to healthy weight adults. Additionally, upon stimulation with the T cell
specific mitogen, Concanavalin A, PBMCs from obese non-diabetic and obese metformin-treated
diabetic adults had higher respiratory rates but no differences in OCR:ECAR, indicating a greater
induction in both aerobic glycolysis and mitochondrial respiration upon stimulation. This global
dysregulation of metabolism in PBMCs from obese subjects towards a more glycolytic and
respiratory environment supports the hypothesis of hyperactive immune cells contributing to
obese-associated inflammatory environments. However, due to the diversity of cell types found
in circulating PBMCS, whether or not this global alteration in metabolism was due to differences
in T cells was unclear.
To better assess T cell specific metabolic differences between influenza vaccinated
healthy weight, obese non-diabetic and obese metformin-treated diabetic adults, freshly isolated
CD4+ and CD8+ T cells were further investigated. We found that compared to healthy weight,
quiescent obese non-diabetic CD4+ and CD8+ T cells tended to have higher basal respiration.
Additionally, CD4+ but not CD8+ T cells from obese non-diabetic subjects had higher trends in
basal glycolysis. Quiescent T cells are primarily oxidative in nature, utilizing glutamine and fatty
acid to drive catabolic metabolism in order to support homeostasis. Altered rates of OXPHOS
anabolic transition into effector T cells upon activation, thereby contributing to the impaired
response of T cells from obese individuals to influenza virus challenge.
Interestingly, in several cases, T cells from obese metformin-treated diabetic subjects
displayed metabolic profiles closer to T cells from healthy weight subjects than their obese
non-diabetic counterparts. This lower metabolic profile occurred in spite of persistent elevated serum
glucose in obese diabetic subjects. This restoration of T cell metabolism to “healthy” levels
signifies metformin’s direct action on T cell metabolism independent of its proposed
mechanisms of action through glucose homeostasis. Recent publications suggest that metformin
may work to restore T cells to a homeostatic quiescent state through blockage of mTOR cascade
signaling, thereby suppressing pro-growth metabolic signaling [63]. Treatment of T cells with
metformin promote the development of memory CD8+ T cells through induction of fatty acid
oxidation and suppression of glycolytic pathways via AMPK [63]. However, other studies show
metformin’s inhibition of mTOR’s pro-growth signaling and resultant metabolic switch from
catabolic to anabolic metabolism in CD4+ T cells occurs through an AMPK-independent manner
[62]. Regardless of direct or indirect action, our findings demonstrate trends suggesting a
restorative effect of metformin treatment in obese diabetic CD4+ and CD8+ T cells to their
homeostatic quiescent state.
Given the widespread use of metformin in type-2 diabetic patients, and its early evidence
of potential therapeutic benefit in the prevention and treatment of cancer [64], understanding
how metformin’s impact on T cell metabolism, especially in immune-compromised populations
such as the obese, remains a critical and unresolved question. Our data suggests that metformin
treatment may offer therapeutic benefits for obese adults by suppressing hyperactive metabolic
impairments in T cell function of influenza vaccinated obese adults, this finding has significant
public health implications as obese adults are at heightened risk of morbidity and mortality from
influenza infection. Furthermore, metabolic impairments in T cell function may exist in
early-onset or childhood obesity when immune development and vaccination efforts are at a critical
time period. Thus, therapeutic benefits of metformin treatment in obese children warrant further
study for the possible restorative metabolic effects on T cells, thereby influencing metabolic
impairment of T cell function for infections such as influenza.
While much of the data shown here does not meet significance due to the small sample
size, the trends suggest critical differences in both mitochondrial respiration and aerobic
glycolysis between our demographic groups. Using the largest variance observed in obese
non-diabetics, as this demographic had the largest variation in metabolic parameters compared to
healthy weight and obese metformin-treated diabetics, conservative power calculations would
require a sample size of 15 per group to adequately assess significant differences between
activated T cells, with quiescent T cells requiring a sample size of 9 per group. Even still, this
report offers the first identification of altered metabolic programming in obese adults compared
to healthy weight, suggesting obesity impacts T cell metabolism and function through altered
metabolic flux. The metabolic difference between healthy weight and obese adults warrants
further study as these highly metabolic cells play a critical role in supporting innate and adaptive
Figure 3. Quiescent and Concanavalin A activated PBMCs from healthy weight, obese non-diabetic
and obese metformin-treated diabetic adults. Quiescent (A) and ConA activated (B) PBMCs from
healthy weight (n=2), obese non-diabetic (n=2) and obese metformin-treated diabetic (n=3) adults exhibit changes in basal OCR and ECAR in response to 1.0 µM olgiomycin, 0.5µM FCCP, 1.5µM antimycinA and 0.75µM rotenone (A-B). Quiescent PBMCs had higher basal respiration (C) in obese non-diabetic and obese metformin-treated diabetic cells compared to healthy weight. Activated PBMCs had higher rates of basal respiration and glycolysis for obese non-diabetics (C-D), but only higher rates for basal ECAR in activated obese non-diabetics (D). Obese non-diabetic had higher trend of SRC in quiescent PBMCs compared to healthy weight (ns) (E), and saw an increasing trend in OCR:ECAR from healthy weight to obese non-diabetic and obese metformin-treated diabetic PBMCs (F). Data are biological medians. Two-way ANOVA with Tukey’s multiple comparisons.
Quiescent Activated 0 200 400 600 OCR (pmoles/min) Healthy Weight Obese Non-diabetic Obese Diabetic Quiescent Activated 0 2 4 6 8 10 12 ECAR (mpH/min) Healthy Weight Obese Non-diabetic Obese Diabetic Quiescent Activated 0 200 400 600 800
SRC (Max OCR - Basal OCR)
Healthy Weight Obese Non-diabetic Obese Diabetic Quiescent Activated 0 50 100 150 OCR/ECAR (pMoles/mpH) Healthy Weight Obese Non-diabetic Obese Diabetic 0 10 20 30 40 50 60 70 80 90 100
0 200 400 600 800 Time (min) OCR (pmoles/min) Healthy Weight Obese Non-diabetic Obese Diabetic Rotenone + AnitmycinA
FCCP Oligomycin
0 10 20 30 40 50 60 70 80 90 100
0 200 400 600 800 1000 Time (min) OCR (pmoles/min) Healthy Weight Obese Non-diabetic Obese Diabetic Rotenone + AnitmycinA
FCCP Oligomycin
A B
C D
Figure 4. Metabolic profile of quiescent CD4+ T cells in healthy weight, obese non-diabetic and
obese metformin-treated diabetic adults. Mitochondrial stress test of freshly isolated CD4+ T cells
from healthy weight (n=3), obese non-diabetic (n=3) and obese metformin-treated diabetic (n=3) subjects exhibits changes in OCR and ECAR in response to 1.0 µM olgiomycin, 1.5µM FCCP, 1.0µM antimycinA and 0.1µM rotenone (A-B) in non-buffered RPMI-1640 with 10mM glucose, 2mM glutamine and 1mM
pyruvate.Obese non-diabetics had higher trends in basal OCR (C), basal ECAR (D) and spare respiratory
capacity (E). No differences in trends were seen for OCR:ECAR (F). Data are median ± SE. No
significance, one-way ANOVA with Tukey’s multiple comparisons. Individual comparisons were made using Mann-Whitney sum rank test, no significance found.
0 10 20 30 40 50 60 70 80
0 20 40 60 80 100 Time (minutes) OCR (pmoles/min) Healthy Weight Obese Non-diabetic Obese Diabetic Olgiomycin FCCP Rotenone + AntimycinA
0 10 20 30 40 50 60 70 80
0 2 4 6 8 Time (minutes) ECAR (mpH/min) Healthy Weight Obese Non-diabetic Obese Diabetic Olgiomycin FCCP Rotenone + AntimycinA
Healthy Weight Obese Non-diabetic Obese Diabetic 0 5 10 15 20 25 OCR (pmoles/min)
Healthy Weight Obese Non-diabetic Obese Diabetic 0.0
0.5 1.0 1.5
ECAR (mpH/min)
Healthy Weight Obese Non-diabetic Obese Diabetic 0
20 40 60 80
SRC (Max OCR - Basal OCR)
Healthy Weight Obese Non-diabetic Obese Diabetic 0 5 10 15 20 OCR/ECAR (pMoles/mpH)
A B
C D
Figure 5. Metabolic profile of activated CD4+ T cells in healthy weight, obese non-diabetic and
obese metformin-treated diabetic adults. Mitochondrial stress test of anti-CD3/anti-CD28 + IL-2
stimulated CD4+ T cells from healthy weight (n=3), obese non-diabetic (n=3) and obese metformin-treated diabetic (n=3) subjects cultured in 5% autologous plasma exhibits changes in OCR and ECAR in response to 1.0 µM olgiomycin, 1.5µM FCCP, 1.0µM antimycinA and 0.1µM rotenone (A-B) in
non-buffered RPMI-1640 with 10mM glucose, 2mM glutamine and 1mM pyruvate.No differences in trends
were seen for basal OCR (C), basal ECAR (D) or OCR:ECAR (F). Obese non-diabetic and obese metformin-treated diabetic stimulated CD4+ T cells had higher trends in spare respiratory capacity (E). Data are median ± SE. No significance, one-way ANOVA with Tukey’s multiple comparisons. Individual comparisons were made using Mann-Whitney sum rank test, no significance found.
0 10 20 30 40 50 60 70 80
0 50 100 150 200 250 Time (minutes) OCR (pmoles/min) Healthy Weight Obese Non-diabetic Obese Diabetic Olgiomycin FCCP Rotenone + AntimycinA
0 10 20 30 40 50 60 70 80
0 20 40 60 80 Time (minutes) ECAR (mpH/min) Healthy Weight Obese Non-diabetic Obese Diabetic
Olgiomycin FCCP Rotenone + AntimycinA
Healthy Weight Obese Non-diabetic Obese Diabetic 0 50 100 150 200 OCR (pmoles/min)
Healthy Weight Obese Non-diabetic Obese Diabetic 0 20 40 60 80 ECAR (mpH/min)
Healthy Weight Obese Non-diabetic Obese Diabetic 0
20 40 60 80
SRC (Max OCR - Basal OCR)
Healthy Weight Obese Non-diabetic Obese Diabetic 0
1 2 3
OCR/ECAR (pMoles/mpH)
A B
C D