Jamming and geometry of two-dimensional foams
To cite this article: G. Katgert and M. van Hecke 2010 EPL 92 34002
View the article online for updates and enhancements.
Related content
Jamming of soft particles: geometry, mechanics, scaling and isostaticity M van Hecke
-Relaxation and flow in linearly sheared two-dimensional foams
M. E. Möbius, G. Katgert and M. van Hecke
-Non-affine response: Jammed packings vs. spring networks
W. G. Ellenbroek, Z. Zeravcic, W. van Saarloos et al.
-Recent citations
Global topology of contact force networks: Insight into shear thickening suspensions Lance E. Edens et al
-Mechanical metamaterials associated with stiffness, rigidity and compressibility: a brief review
Xianglong Yu et al
-Softening and yielding of soft glassy materials
-doi:10.1209/0295-5075/92/34002
Jamming and geometry of two-dimensional foams
G. Katgert1,2(a)and M. van Hecke1
1Kamerlingh Onnes Laboratorium, Universiteit Leiden - P.O. Box 9504, 2300 RA Leiden, The Netherlands, EU 2School of Physics, The University of Edinburgh, James Clerk Maxwell Building, The Kings Buildings
Mayfield Road, Edinburgh EH9 3JZ, UK, EU
received 29 July 2010; accepted in final form 13 October 2010 published online 18 November 2010
PACS 45.70.-n– Granular systems
PACS 82.70.Rr– Aerosols and foams
Abstract – We experimentally probe the vicinity of the jamming pointJ, located at a density
φ corresponding to random close packing (φrcp= 0.842), in two dimensional, bidisperse packings of foam bubbles. We vary the density of the foam layer and extract geometrical measures by image analysis. We confirm the predicted scaling of the average contact number Z with φ and compare the distribution of local contact numbers to a simple model. We further establish that the distribution of areasp(A) strongly depends onφ. Finally, we find that the distribution of contact forcesp(f) systematically varies with density.
Copyright cEPLA, 2010
Since the seminal work by Bolton and Weaire [1] soft frictionless discs or spheres have become the Ising model for the Jamming transition [2–4]. Jamming is believed to capture the transition between flow and arrest in a wide variety of disordered media such as foams, emulsions, granular media and (colloidal) suspensions, and this idea has lead to an upsurge of simulations revealing critical behaviour as a function of the distance to the critical point
J, which is reached precisely when the applied pressure vanishes [3,5,6]. While some of these predictions have been tested experimentally [7–10], many others still await experimental verification.
While the original incarnation of the soft sphere model explicitly makes the link to foams [2], this connection has not been explored in recent times. Nevertheless, foam bubbles, as well as emulsion droplets are the clos-est physical analogue of frictionless spheres. Their elas-tic interaction is close to that of a linear spring [11,12] and solid friction is absent. Under flow, only a velocity dependent viscous friction, that is now fairly well under-stood [5,6,13,14] acts on the bubbles.
In this letter we experimentally probe the behaviour of jammed packings near point J. We do this by generat-ing two-dimensional packgenerat-ings of foam bubbles. We vary the packing fraction, φ, and for each density gener-ate many distinct static packings of foam bubbles. We then extract various statistical and topological quanti-ties through image analysis and investigate whether these
(a)E-mail:[email protected]
measures signal an approach of the jamming transition at
φc as the density is varied.
First, we investigate the scaling of the average contact number per bubbleZ with the distance toφc. Our central
result is that the contact number scales like Z−Zc∼
(φ−φc)0.5. To this end, we first resolve the apparent
discrepancy between our findings and simulations by pointing out the differing ways of measuring φ between simulation and experiment. We find φc to be located
around φc= 0.84, in excellent agreement with previous
predictions [1,3,5,15], and obtain, for the first time, a quantitative experimental confirmation of critical scaling at pointJ in an appropriate experimental system.
Besides this global measure, we also investigate the distribution of contact numbers at the bubble scale as a function of global Z. We compare to a recent model [16] and find excellent agreement with no adjustable parame-ters, which is remarkable given that this theory was devel-oped for frictional packings.
The distribution of free available area per bubble,
G. Katgert and M. van Hecke
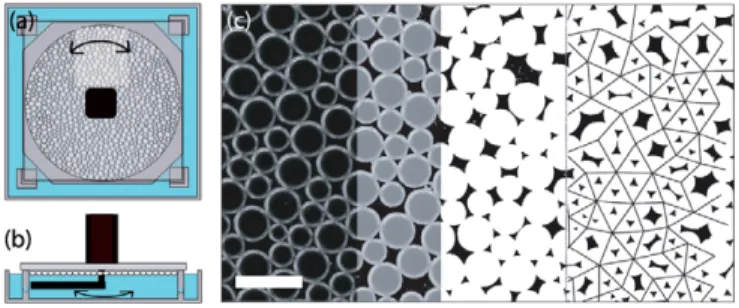
Fig. 1: (Color online) Top (a) and side (b) view of the setup. (a) Bubbles are contained in a circular reservoir and covered by a glass plate. Images are taken in the highlighted area. (b) A stepper motor drives a rod that stirs the bulk solution, thereby rearranging the packing. (c) From left to right: raw image, raw image with reconstructed bubble areas, reconstructed bubble areas, from whichφis calculated, and contact network, from whichZ is found. The scale bar denotes 5 mm.
Finally, our navigation map tiling allows us to extract the deformed interfaces between adjacent bubbles. These facets are proportional to the contact forces, and we thus extract the distribution of the contact forcesp(f). We find that its tail is close to exponential forφ close toφc, and
becomes steeper for largeφ[23].
Setup. – We prepare a surfactant solution consist-ing of 0.5% volume fraction Dawn dishwashing liquid and 15% glycerol in demineralized water (viscosity η= 1.8±0.1 mPa·s and surface tensionσ= 28±1 mN/m) in a large circular reservoir (r= 190 mm) of depth 30 mm, see fig. 1(a). A bidisperse (50 : 50 number ratio) bubble mono-layer is produced by flowing nitrogen through two syringe needles immersed at fixed depth in the soapy solution. The resulting bubbles of 1.8±0.1 and 2.7±0.1 mm diam-eter (as ddiam-etermined from experimental images) are gently mixed to produce a disordered bidisperse monolayer and are covered with a 10 mm thick glass plate, see fig. 1(a). The weighted average bubble diameterdis 2.25 mm. We light the bubbles slanted from below and cover the bottom of the reservoir with a black plate, to enhance contrast.
The bubbles contact the top plate, see fig. 1(b), which is completely wetted by the soap solution, and the liquid fraction of the foam can be varied by varying the distance between glass plate and liquid surface between 3 and 0.2 mm. This in itself is not a proper measure ofφsince the relation betweenφand the gap is strongly hysteretic —φ
depends not only on the gap, but also on an uncontrolled confining pressure. Therefore, we will determine φ from experimental images, in a procedure outlined below, see fig. 1(c). We check that coalescence, segregation and coarsening are negligible.
Experimental protocol. – A stepper motor is glued to the glass plate and is connected to an aluminum rod through a hole in the glass plate, see fig. 1(b). We agitate the surfactant solution underneath the bubbles by driving the rod back and forth with an amplitude of 1 radian,
its angular velocity alternating between +0.6 and −0.6 radians per second. We emphasize that while agitating the bulk solution leads to strong mixing of the packing, we inject little enough energy to avoid bubble break-off, as evidenced by the absence of satellites. After 4 oscillations we stop the motor, after which the packings slowly relax to a mechanically stable state. We probe the relaxation of packings at varying φ to determine the waiting time between agitation and image acquisition. To this end, we record sequences of images with a CCD camera and measure the variance of the intensity fluctuations of all pixels in difference images.
After waiting for this time, which is of the order of minutes, we record one image in the previously agitated region with a 6 megapixel photocamera (Canon 20D). The image contains between 350 and 700 bubbles, depending on the packing fractionφ. For various fixed gaps between liquid surface and glass plate we repeat this procedure 100 times and thus obtain 100 packings at roughly equal pack-ing fraction. We visually inspect the resultpack-ing packpack-ings to be distinct in appearance, and it is these images that we analyse in the following.
Determiningφ. – We extract our crucial control para-meterφfrom the experimental images by advanced image analysis, see fig. 1(c): we first binarize the image, after which both the bubble centers and the interstices appear bright. We then remove the interstices by morphological operations and dilate the remaining bubble centers. We then add up a negative of the original binary image to arrive at the final image, in which the bubbles are repre-sented by bright discs against a black background. From this image we can readily calculate the area fraction φ. Note that, in principle, the concept of packing fraction is problematic for a monolayer of three-dimensional bubbles. We choose our lighting of the bubbles such that the contacts between adjacent bubbles are optimally resolved. In other words, we image a slice from the packing where the bubbles are the broadest and calculate a 2D packing fraction from this slice.
Scaling of Z with ∆φ. – We first determine the scaling of the average contact number Z with φ. To determineZ, we locate the center of mass of each bubble in the image, and after Delaunay triangulation and a subsequent removal of bond vectors for non-touching bubbles, we obtain the contact network of the bubbles in the image, from which we calculateZ, see fig. 1(c).
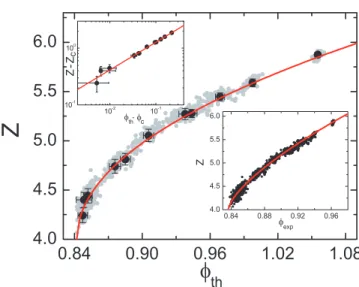
Our results are presented fig. 2, where we plot the values for each distinct packing (grey dots), the average over all 100 images for each packing fraction (black circles) as well as a power law fit of the form Z= 4 +Z0(φ−φc)β (red solid line), where 4 is the contact number at isostaticity. The best fit gives us Z0= 4.02± 0.20,φc= 0.842±0.002 andβ= 0.50±0.02, in remarkable
agreement with theoretical predictions by O’Hern et al.
and Durian [2,3] who found Z0= 3.6±0.5, φc= 0.841±
Fig. 2: (Color online) Contact numberZ of packingsvs.their packing fraction φ. Grey scatter: data for every individual image. Circles: data averaged over experimental run at approx-imately constant packing fraction. The solid line is fit to
Z= 4 +Z0(φ−φc)β, withZ0= 4.02±0.20,φc= 0.842±0.002 and β= 0.50±0.02. Upper inset: same data on log-log scale. Lower inset:Z vs.experimentally determined packing fraction
φexp. The fit has a power law exponent of 0.70.
Note, however, that the range of packing fractions we can scan over, extends to a surprisingly large value of
φ= 1.06. This is due to a striking discrepancy between the manner in whichφis calculated in simulations and in experiments. In simulations, the area or volume of spheres is fixed, and if one knows the number of particles in the periodic box,φ is readily calculated. In experiments, however,φcan only be inferred from experimental images. This difference results in the following: if particles overlap, the overlapping area of the two particles is countedtwice
in simulations, while it is only counted once in our experiment. This doubly counted area scales with the overlap ξ as Aov∼ξ3/2, which stems from the fact that
the deformed area scales as rc×ξ=√ξ×ξ [11]. Since
ξ∼(φ−φc) [4], the conversion between a packing fraction
extracted from a simulation φth and its experimentally
accessible counterpartφexpshould read:
φexp=φth−C(φth−φc)3/2. (1)
We calculate bothφexpandφthfrom numerically
gener-ated packings, and determine the pre-factorC= 0.95. We then invert eq. (1) and calculate theφthcorresponding to
ourφexp.
When plotting our data againstφthas in fig. 2, we
excel-lently match simulations, while we find an apparent scaling exponentβ= 0.70 if we plotZ as a function of the exper-imentally determinedφexp, see lower inset of fig. 2, owing to the non-trivial relation in ∆φbetweenφth andφexp.
We are not the the first to experimentally inves-tigate the scaling of Z with φ. Majmudar et al. [9] have extracted the same quantities from images of two-dimensional, frictional, photoelastic discs and compared
Fig. 3: (Color online) Fractions of bubbles in the foam withn contacts as a function ofZ. Solid lines: solutions to eqs. (2)–(5) for the species listed at the top of the graph.
these to predictions from simulations. From their data it appears the prefactor Z0≈16, inconsistent with simula-tions. Our results do allow for a direct comparison with frictionless jamming predictions, which can be seen from the excellent agreement between parameters.
Local contact fractions. – Besides the average contact number per packing Z we can also extract the fractionxz of bubbles in each image that hasz contacts.
We average these fractions over all images that correspond to a global packing fraction (and contact number Z) cf. the black circles in fig. 2. We plot these fractions versus the averageZ in fig. 3: we see clear trends in the abundance of contacts at the particle level, to which we apply a very recent model [16].
This model predicts the fractions of 4 species
{xn, . . . , xn+ 3}in a packing, given the globalZ and the
variance σ2=ni=+3nxi(Z−i)2. This constraint, together
with the trivial normalization constraints ni=+3nxi= 1, n+3
i=nixi=Z and the ill-understood, but empirically
observed1 constraint that the number of particles with odd and even contacts is equal, leads to a set of of equations, the solution of which is:
xn=(Z−(n+ 2))2+σ2−1/2/4, (2)
xn+1=−(Z−(n+ 1))2−σ2+ 5/2/4, (3)
xn+2=−(Z−(n+ 2))2−σ2+ 5/2/4, (4)
xn+3=(Z−(n+ 1))2+σ2−1/2/4. (5)
Since we know Z and σ2(= 0.75) from the data we can obtain the fractions xi without any free parameters.
However, we measure non-negligible fractions of not 4, but 5 species. We therefore apply the model forn= 3 to 4< Z <4.75, where x7≈0 and for n= 4 to 4.97< Z <6
G. Katgert and M. van Hecke
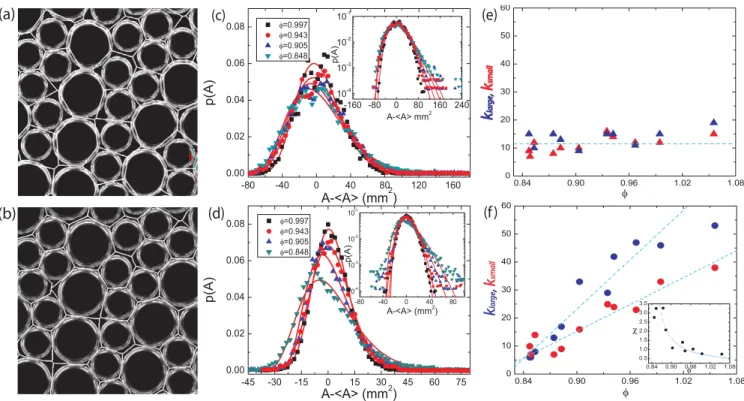
Fig. 4: (Color online) (a) Experimental image with Voronoi tesselation of the centers of mass of the bubbles. Note the intersection of bubbles by the Voronoi cell edges. (b) Navigation map tesselation of same image: the cell edges do not intersect the bubbles. (c) Area distributions from Voronoi tesselation for 4 different packing fractions, as stated in legend. Solid lines are fits to the Gamma distribution, eq. (6). Little trend withφ is seen. (d) Area distributions from navigation map tesselation for the same packing fractions. Solid lines are fits to the Gamma distribution, eq. (6). NearφJ, broad tails develop. (e)kextracted from fits to Voronoi cell distributions. No trend withφcan be seen. (f)k extracted from fits to navigation map distributions. A strong variation ofk with φis visible. The inset shows the compactivity χ= (A −Amin)/k, which increases towards point J as k decreases.
where x3≈0. We obtain good agreement between data and theory, see fig. 3, for both ranges of validity. At highZ, the bidisperse nature of our packing is visible: we observe an excess of both particles with 5 contacts and with 7, while particles with 6 contacs are underrepresented. We have observed that large bubbles carry the majority of 7’s, while small bubbles mostly have 5 contacts at these values ofZ (data not shown). This is natural in bidisperse packings, as this occurs whenever a large and a small bubble contact. It thus indicates an absence of crystalline order, which would lead to an increase of 6’s.
Area distributions. –We now turn to tesselations of our foam packings. These tesselations yield two important “connectors” between local geometry and global response. Firstly one can readily extract the distribution of available area per bubblep(A) [19,24–27], which serves as the multi-plicity in a thermodynamical description of granular mate-rials. Secondly, we measure the size of the contact areas between bubbles, from which the distribution of forces
p(f) can be extracted. In particular, we wish to establish whether the tail ofp(f) is exponential or Gaussian as does a large and conflicting body of simulations and experimen-tal work (see ref. [23] for a nice overview). The aim here is to decide between competing theoretical descriptions that predict either one or the other.
The thermodynamical description of granular materials, as introduced by Edwards and Oakeshott [28] translates the concepts underpinning equilibrium thermodynamics to conglomerates of a-thermal particles such as bubbles. The volume V (in 2D the area A) takes on the role of energy, while a compactivityχreplaces temperature.
Aste and Di Matteo have derived the form of the distribution functionp(A, k) with such an approach [18]:
p(A, k) = k
k
Γ(k−1)
(A−Amin)k−1 (A −Amin)k exp
−kA−Amin A −Amin
,
(6)
withka shape parameter —which has been found to take on one universal value in granular packings, namely k= 12 [24],Amin the minimum available area per bubble and Athe mean. The compactivity is defined asχ= (A − Amin)/k [18]. Note that when a≡k, b≡1/χ, eq. (6)
reduces to a simple two-parameter Gamma distribution in ˜A≡A−Amin:p( ˜A) =Γ(baa)( ˜A)a−1exp(−bA˜).
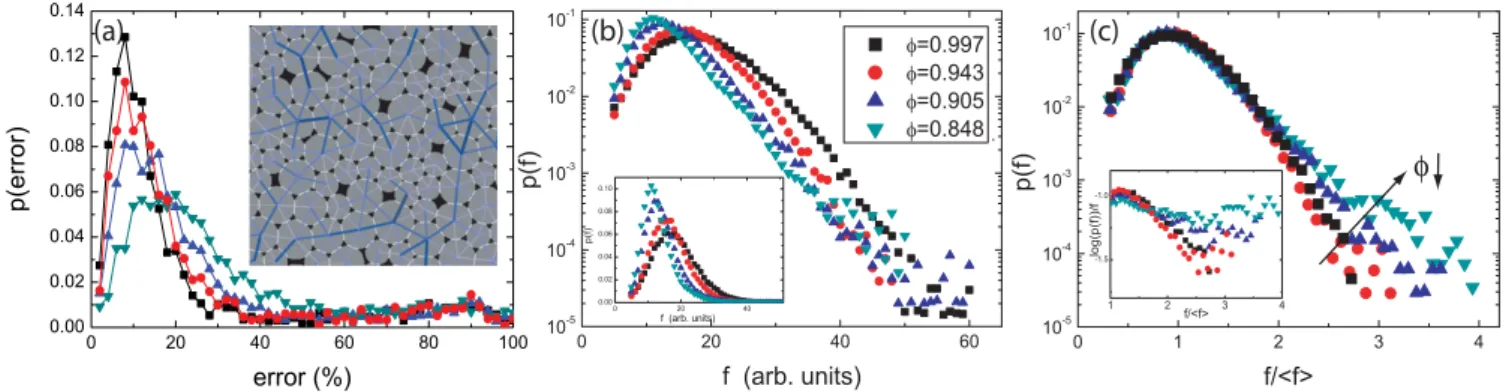
Fig. 5: (Color online) For the sameφas in fig. 4 we calculate (a) the probability distribution of relative error in force balance on each bubble: for packings closer to pointJ, the error increases. Inset: experimental image with force network overplotted: flattened contacts in white, and magnitude of the forces indicated by the thickness of vector and darkness. (b) Force distributions, rescaled by the meanf of all configurations: the peak shifts to smaller forces as one approaches pointJ (see inset). (c) Force distributions, for each configuration we rescale itsp(f) by the mean. The average now exhibits steeper than exponential decay.
that thus, the Voronoi cells do not represent the free area per bubble. For hard spherical objects one can get around this problem [19], however, in our experiment, the bubbles are not only bidisperse, but in general also deformed and the flattened contacts can be curved.
To fully take the effects of both deformations and bidispersity into account, we calculate what is called the navigation map [20,21]. In this method, we assign pixels in the voids between bubbles to those bubbles whose perimeter is closest. The result is shown in fig. 4(b): we obtain free areas per bubble that respect the bubble edges and follow the curvature of the contacts.
With both methods we obtain bimodal distributions for
A, which we split according to the size of the bubbles. Distributions for the larger bubbles are shown in figs. 4(c), (d) for Voronoi and navigation map tesselations respec-tively. Distributions for the smaller bubbles behave the same. For the Voronoi tesselation we find that the shape of the distributions is roughly independent of the packing fraction, with all distributions being slightly skewed (see inset of fig. 4(c)), while for the navigation map tesselation we find that an excess of large available area develops near jamming, leading to strongly asymmetric distributions.
We quantify these observations by fitting eq. (6) to our experimental distributions. We treatk as a fit parameter and extractAminfrom the data: it is the minimal hexagon
that can enclose a bubble at a given packing fraction. Results are plotted in figs. 4(e), (f): the nearly constant shape of the Voronoi distribution is reflected by the near constant value of k we extract, with k= 13.1 for large bubbles and k= 11.4 for small bubbles when averaged over all values ofφ.
However, for the navigation map distributions we observe a systematic trend in k with φ. The nearly Gaussian distributions at highφ can be fit when k∼50, but k systematically decreases with decreasing packing fraction φ to a value of 6 near jamming. This strong variation reflects the increasing amount of excess available area per bubble with decreasing packing fraction, which
is also reflected by an increasing compactivity χ, see inset of fig. 4(f). Since the navigation map tesselation respects bubble edges, we believe this tesselation to be more physically appropriate, and we see the decrease of
k and the associated broadening of the tail of p(A) as a signature of the approach of point J, or, equivalently, the recovery of hard-sphere behaviour as the value of k
approaches that of two-dimensional hard disc packings, wherek∼3.7 [19,26].
The force distribution p(f). – By construction, the navigation map bisects touching bubbles at their contact area. As a result, we can extract the radius rc of the
deformed contacts between bubbles. Since the contact forcef12between two bubbles is linear in the deformation, it is related torc as [29]
f12=πr2c
R1+R2
R1R2
(7)
with Ri the radius of bubble i. We can thus extract the
force distribution p(f) of interbubble contact forces. An experimental image with the contacting facets in white and the extracted contact forces in blue is shown in fig. 5(a).
The forces are oriented along the bond vector between bubbles and thus we can check if the forces balance on each bubble. To check this, we plot the relative error
f/fin fig. 5(a). We see that the error is about 10% for the densest packings, and increases for packings that are closer to jamming.
In fig. 5(b) we plot, for variousφ, the p(f) of all forces from all images at that packing fraction. We convert
G. Katgert and M. van Hecke
In the inset of fig. 5(b) that the peak of the distribution shifts towards lower forces as we approach point J, in accordance with [31].
To obtain more information on the shape of the tail of
p(f), we now rescale eachp(f) from an individual image by its mean and average these distributions for eachφ. Just adding up the force distributions for each frame, as was done for fig. 5(b), washes out any signature of Gaussian tails [31]. The result is shown in fig. 5(c): we now observe changes in the shape of the tail away from jamming —with increasing compression the decay of the tail seems to become steeper than exponential. This is illustrated by the inset of fig. 5(c), where we plot ln(p(f))/f which tends to a constant for exponential tails and decreases for faster than exponential decay. We thus provide further evidence that one can find steeper than exponential decay in p(f), although we do not have sufficient statistics to conclude that the tails cross over to Gaussian tails away from jamming. Note that a similar behaviour is seen in simulation and experiments on emulsions [29].
Conclusion. – We have experimentally investigated the behavior of soft frictionless discs near the jamming point at zero stress and temperature, by sampling distinct packings of foam bubbles at varying packing fractionφ. We have, for the first time, quantitatively confirmed critical scaling in the contact number Z and we have extracted local contact numbers and compared these to a simple model. We have found a strong variation in the shape of the area distributionp(A) as we approached the jamming point, signalling an increase in compactivity, as well as as a crossover from steeper-than-exponential to exponential tails in the force distributionp(f), as was earlier observed in emulsions. These results should help to discern between competing theories for jammed matter.
∗ ∗ ∗
The authors wish to thank J. Mesman and J. Dijksman for technical assistance. The authors thank
Z. Zeravcic for providing numerically generated pack-ings and W. van Saarloos and B. Tighe for useful suggestions. GK acknowledges support from FOM, and EPSRC through grant EP/EO30173/01, and MvH acknowledges support from NWO/VIDI.
REFERENCES
[1] Bolton F.andWeaire D.,Phys. Rev. Lett.,65(1990) 3449.
[2] Durian D. J.,Phys. Rev. Lett.,75(1995) 4780. [3] O’Hern C. S., Silbert L. E., Liu A. J. and Nagel
S. R.,Phys. Rev. E.,68(2003) 011306.
[4] van Hecke M., J. Phys.: Condens. Matter, 22 (2010) 033101.
[5] Olsson P. and Teitel S., Phys. Rev. Lett., 99(2007) 178001.
[6] Tighe B. P., Woldhuis E., Remmers J. J. C.,
van Saarloos W.andvan Hecke M.,Phys. Rev. Lett.,
105(2010) 088303.
[7] Mason T. G., Bibette J.andWeitz D. A.,J. Colloid
Interface Sci.,179(1996) 439.
[8] Saint-Jalmes A.andDurian D. J.,J. Rheol.,43(1999) 1411.
[9] Majmudar T. S., Sperl M., Luding S.andBehringer R. P.,Phys. Rev. Lett.,98(2007) 058001.
[10] Nordstrom K. N., Verneuil E., Arratia P. E., Basu A., Zhang Z., Yodh A. G., Gollub J. P.andDurian
D. J.,Phys. Rev. Lett.,105(2010) 175701.
[11] Lacasse M.-D, Grest G. S., Levine D., Mason T. G. andWeitz, D. A.,Phys. Rev. Lett.,76(1996) 3448. [12] Morse D. C. and Witten T. A.,Europhys. Lett., 22
(1993) 549.
[13] Katgert G., M¨obius M. E.andvan Hecke M.,Phys.
Rev. Lett.,101(2008) 058301.
[14] Denkov N. D., Tcholakova S., Golemanov K.,
Ananthapadmanabhan K. P. andLips A.,Phys. Rev.
Lett.,100(2008) 138301.
[15] Lechenault F., Dauchot O., Biroli G. and
Bouchaud J.-P,EPL,83(2008) 46003.
[16] Henkes S., Shundyak K., van Saarloos W. and
van Hecke M.,Soft Matter,6(2010) 2935.
[17] Song C., Wang P. and Makse H. A., Nature, 453 (2008) 629.
[18] Aste T. and Di Matteo T., Phys. Rev. E, 77(2008) 021309.
[19] Lechenault F., da Cruz F., Bertin E.andDauchot O.,J. Stat. Mech.(2006) P07009.
[20] Medvedev N. N.,Dokl. Akad. Nauk,337(1994) 767. [21] Clusel M., Corwin E. I., Siemens A. O. N. and
Bruji´c J.,Nature,460(2009) 611.
[22] Weaire D., Kermode J. P.andWejchert J.,Philos.
Mag. B,53(1986) L101.
[23] Tighe B. P., Snoeijer J. H., Vlugt T. J. H. and van Hecke M.,Soft Matter,6(2010) 2908.
[24] Aste T., Di Matteo T., Saadatfar M., Senden T. J., Schr¨oter M.andSwinney H. L.,EPL,79(2007) 24003.
[25] Kumar V. S. and Kumaran V.,J. Phys. Chem., 123 (2005) 114501.
[26] Berhanu M. and Kudrolli X., Phys. Rev. Lett., 105 (2010) 098002.
[27] Cheng X.,Soft Matter,6(2010) 2931.
[28] Edwards S. F. and Oakeshott R. B. S., Physica A,
157(1989) 1080.
[29] Bruji´c J., Edwards S. F., Hopkinson I.and Makse H. A., Physica A, 327 (2003) 201; Zhou J., Long S., Wang Q. and Dinsmore A. D., Science, 312 (2006) 1631.
[30] Corwin E. I., Jaeger H. M.andNagel S. R.,Nature,
435 (2005) 1075; Majmudar T. S.and Behringer R. P.,Nature,435(2005) 1079.