Quantifying the Twitter Influence of Third
Party Commercial Entities versus Healthcare
Providers in Thirteen Medical Conferences
from 2011 – 2013
Tejas Desai1,2*, Vibhu Dhingra3, Afreen Shariff4, Aabid Shariff5, Edgar Lerma6, Parteek Singla7, Swapnil Kachare8, Zoheb Syed9, Deeba Minhas10, Ryan Madanick11,
Xiangming Fang12
1 Division of Nephrology, W.G. (Bill) VA Medical Center, Salisbury, North Carolina, United States of
America, 2 NOD Analytics, Charlotte, North Carolina, United States of America, 3 Department of Internal Medicine, East Carolina University – Brody School of Medicine, Greenville, North Carolina, United States of America, 4 Division of Endocrinology, Duke University, Durham, North Carolina, USA, 5 Monsanto Company, Raleigh, North Carolina, United States of America, 6 Division of Nephrology, University of Illinois at Chicago College of Medicine, Chicago, Illinois, United States of America, 7 Department of Internal Medicine, Barnes Jewish Hospital, St. Louis, Missouri, United States of America, 8 Department of Surgery, East Carolina University – Brody School of Medicine, Greenville, North Carolina, United States of America,
9 College of Arts and Sciences, College of William and Mary, Yorktown, Virginia, United States of America, 10 Division of Rheumatology, Cedars-Sinai Medical Center, Los Angeles, California, United States of
America, 11 Division of Gastroenterology, University of North Carolina, Chapel Hill, North Carolina, United States of America, 12 Department of Biostatistics, East Carolina University – Brody School of Medicine, Greenville, North Carolina, United States of America
Abstract
Introduction
Twitter channels are increasingly popular at medical conferences. Many groups, including healthcare providers and third party entities (e.g., pharmaceutical or medical device com-panies) use these channels to communicate with one another. These channels are unregu-lated and can allow third party commercial entities to exert an equal or greater amount of Twitter influence than healthcare providers. Third parties can use this influence to promote their products or services instead of sharing unbiased, evidence-based information. In this investigation we quantified the Twitter influence that third party commercial entities had in 13 major medical conferences.
Methods
We analyzed tweets contained in the official Twitter hashtags of thirteen medical confer-ences from 2011 to 2013. We placed tweet authors into one of four categories based on their account profile: healthcare provider, third party commercial entity, none of the above and unknown. We measured Twitter activity by the number of tweet authors per category a11111
OPEN ACCESS
Citation: Desai T, Dhingra V, Shariff A, Shariff A,
Lerma E, Singla P, et al. (2016) Quantifying the Twitter Influence of Third Party Commercial Entities versus Healthcare Providers in Thirteen Medical Conferences from 2011 – 2013. PLoS ONE 11(9): e0162376. doi:10.1371/journal.
pone.0162376
Editor: Gemma Elizabeth Derrick, Lancaster
University, UNITED KINGDOM
Received: May 22, 2015
Accepted: August 22, 2016
Published: September 26, 2016
Copyright: This is an open access article, free of all
copyright, and may be freely reproduced, distributed, transmitted, modified, built upon, or otherwise used by anyone for any lawful purpose. The work is made available under theCreative Commons CC0public domain dedication.
Data Availability Statement: The data can be
found on the internet. Intable 1I have listed URLs that have the data that we used. The data is freely available - no username is required.
Funding: None of the authors received any grant
funding for this project. The author(s) received no specific funding for this work.
Competing Interests: TD is an employee of the
and the tweet-to-author ratio by category. We measured Twitter influence by the PageRank of tweet authors by category.
Results
We analyzed 51159 tweets authored by 8778 Twitter account holders in 13 conferences that were sponsored by 5 medical societies. A quarter of all authors identified themselves as healthcare providers, while only 18% could be identified as third party commercial entities. Healthcare providers had a greater tweet-to-author ratio than their third party commercial entity counterparts (8.98 versus 6.93 tweets). Despite having less authors and composing less tweets, third party commercial entities had a statistically similar PageRank as health-care providers (0.761 versus 0.797).
Conclusion
The Twitter influence of third party commercial entities (PageRank) is similar to that of healthcare providers. This finding is interesting because the number of tweets and third party commercial entity authors required to achieve this PageRank is far fewer than that needed by healthcare providers. Without safety mechanisms in place, the Twitter channels of medical conferences can devolve into a venue for the spread of biased information rather than evidence-based medical knowledge that is expected at live conferences. Continuing to measure the Twitter influence that third parties exert can help conference organizers develop reasonable guidelines for Twitter channel activity.
Introduction
Medical conference organizers must strike a balance with commercial entities (e.g., pharma-ceutical companies and device manufacturers). Third parties are needed to offset the cost of many national scientific meetings and provide valuable information about the latest
develop-ments in the field [1,2]. Concurrently, conference organizers must mitigate “detailing”: the
pro-cess in which third parties have direct and unregulated acpro-cess to conference attendees
(learners) [3,4]. Organizers have reached this balance in live conferences by: 1) not allowing
third parties to select speakers at plenary and other sessions, 2) not allowing third parties to pass out literature in-and-around classrooms, and 3) restricting learner access to third parties to one geographic location ("exhibition hall") and only during specific periods of time that do
not conflict with other scientific sessions [2]. Theoretically, these safety mechanisms allow a
learner to experience a live medical conference without ever exposing him/herself to a third party.
This model has not been replicated in the increasingly popular Twitter hashtag channels
(channels) [5,6]. Twitter channels are open and freely accessible online Twitter streams that
allow learners, conference organizers, and third parties to share information with each other
[5,6]. These channels are not covert; conference organizers encourage attendees to use these
channels through official publications and signage at the conference itself. In part because they are freely available to the public, Twitter channels enhance live conferences and an increasing
number of medical conferences are incorporating them into their annual meetings [7–18].
Although promoted by conference organizers, the medical conference Twitter channels are unregulated; this allows third parties direct access to learners that they cannot achieve at a live
conference. Detailing on Twitter exposes learners to third parties and facilitates the transfer of biased information in an environment that does not have established safety mechanisms in
place [1,3,4]. Theoretically, third parties can exert a greater influence over learners through
Twitter detailing.
In this investigation, we used established methods to explore the Twitter influence that third parties have in the Twitter channels of thirteen prominent medical conferences from 2011–2013. In the unregulated realm of Twitter channels, we hypothesized that third parties have a comparable Twitter influence score as any other group.
Methods
Data Set
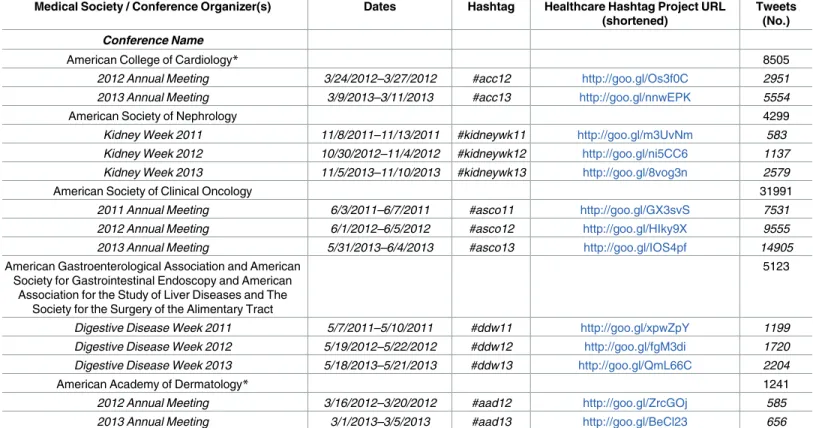
We identified five (5) medical societies that promoted the Twitter channels of their respective annual meetings. These societies assigned a conference-specific hashtag for each channel and registered each with the Healthcare Hashtag Project (HHP; symplur.com). We queried the
HHP database for all conference-specific tweets using the pre-assigned hashtags.Table 1shows
the thirteen conferences that were included in the data set. We collected a) date and time of tweet, b) Twitter username of the tweet author, c) content of the tweet, and d) Twitter user-name(s) of individuals/organizations mentioned within the body of a tweet (@mentions).
Content Analyses
We performed five (5) separate analyses to identify the types of content within our data set. First we categorized each tweet as an “original” or “retweet”. We defined “original tweets” as
Table 1. Baseline Data.
Medical Society / Conference Organizer(s) Dates Hashtag Healthcare Hashtag Project URL
(shortened)
Tweets (No.)
Conference Name
American College of Cardiology* 8505
2012 Annual Meeting 3/24/2012–3/27/2012 #acc12 http://goo.gl/Os3f0C 2951 2013 Annual Meeting 3/9/2013–3/11/2013 #acc13 http://goo.gl/nnwEPK 5554
American Society of Nephrology 4299
Kidney Week 2011 11/8/2011–11/13/2011 #kidneywk11 http://goo.gl/m3UvNm 583 Kidney Week 2012 10/30/2012–11/4/2012 #kidneywk12 http://goo.gl/ni5CC6 1137 Kidney Week 2013 11/5/2013–11/10/2013 #kidneywk13 http://goo.gl/8vog3n 2579
American Society of Clinical Oncology 31991
2011 Annual Meeting 6/3/2011–6/7/2011 #asco11 http://goo.gl/GX3svS 7531 2012 Annual Meeting 6/1/2012–6/5/2012 #asco12 http://goo.gl/HIky9X 9555 2013 Annual Meeting 5/31/2013–6/4/2013 #asco13 http://goo.gl/IOS4pf 14905 American Gastroenterological Association and American
Society for Gastrointestinal Endoscopy and American Association for the Study of Liver Diseases and The
Society for the Surgery of the Alimentary Tract
5123
Digestive Disease Week 2011 5/7/2011–5/10/2011 #ddw11 http://goo.gl/xpwZpY 1199 Digestive Disease Week 2012 5/19/2012–5/22/2012 #ddw12 http://goo.gl/fgM3di 1720 Digestive Disease Week 2013 5/18/2013–5/21/2013 #ddw13 http://goo.gl/QmL66C 2204
American Academy of Dermatology* 1241
2012 Annual Meeting 3/16/2012–3/20/2012 #aad12 http://goo.gl/ZrcGOj 585 2013 Annual Meeting 3/1/2013–3/5/2013 #aad13 http://goo.gl/BeCl23 656
*Conference Twitter channel for the 2011 meeting was not registered with the HHS & unavailable for analysis
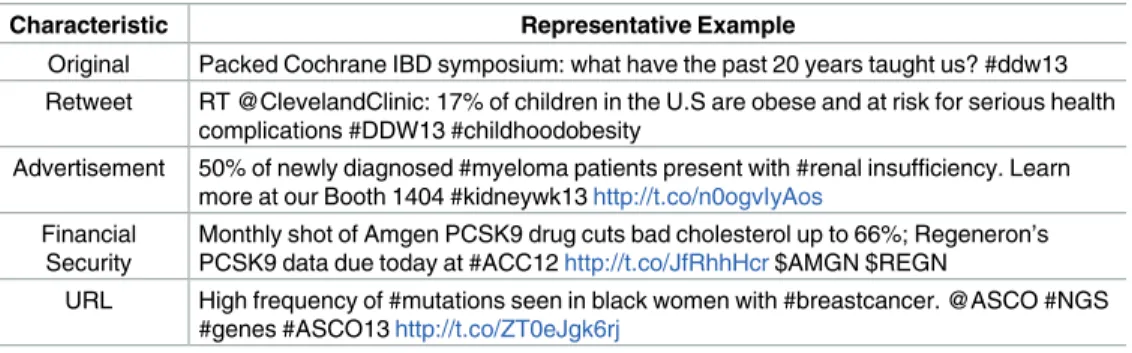
messages composed by the same author who tweeted the message. We defined “retweet” as a message composed by a different author than the one who tweeted the message. Realizing that many medical conferences expose attendees to products/services offered by third party com-mercial entities, we defined “advertisements” as those tweets that were soliciting the attendees to a) use a product or service or b) visit an exhibition booth to learn more about a product/ser-vice. Moreover many of these products/services are offered by commercial entities that are publicly traded corporations. Thus we defined “financial tweets” as those messages whose con-tent contained information about the underlying financial security (stock) of a particular com-mercial entity. In our fourth analysis we identified tweets that contained hyperlinks (URLs) to multimedia files (pictures or videos or both); we defined such tweets as “enhanced”. Finally, we calculated word frequencies in the remaining tweets that were not categorized as “advertise-ments” or “financial” in order to identify the most popular scientific topics that were discussed
within each medical discipline.Table 2provides representative examples of tweets that satisfied
each category definition.
Categorization of Account Holders
In order to quantify the influence that third parties exert in Twitter channels, we categorized every tweet author/account holder mentioned within the body of a tweet (@mentions) into one of four categories: a) healthcare provider (HCP), b) third party commercial entity (third party),
c) unclear identity, and d) none of the above.Table 3defines each category and provides a
rep-resentative example. We used each account holder’s Twitter profile to ascertain under which category that account should be. Categorization was done from January to April 2014. We did
Table 2. Categories and examples of Tweets based on content.
Characteristic Representative Example
Original Packed Cochrane IBD symposium: what have the past 20 years taught us? #ddw13 Retweet RT @ClevelandClinic: 17% of children in the U.S are obese and at risk for serious health
complications #DDW13 #childhoodobesity
Advertisement 50% of newly diagnosed #myeloma patients present with #renal insufficiency. Learn more at our Booth 1404 #kidneywk13http://t.co/n0ogvIyAos
Financial Security
Monthly shot of Amgen PCSK9 drug cuts bad cholesterol up to 66%; Regeneron’s PCSK9 data due today at #ACC12http://t.co/JfRhhHcr$AMGN $REGN
URL High frequency of #mutations seen in black women with #breastcancer. @ASCO #NGS #genes #ASCO13http://t.co/ZT0eJgk6rj
doi:10.1371/journal.pone.0162376.t002
Table 3. User categories and examples.
Category Definition Representative
Example
Twitter Profile
Healthcare Provider
Individual or organization whose primary purpose is to disseminate medical information or provide clinical care for patients
@nephondemand Tejas Desai, MD. Creator of Nephrology On-Demand & Kidney Konnection & Nephrology Fellowship Director @ ECU. I conduct research in social media & medicine & program iOS Apps
3rd Party Commercial Entity
Organization or individual representing an organization whose primary purpose is to provide a product or service to medical professionals and/or patients
@mmsholdings MMS Holdings Inc. MMS Holdings Inc. is a global niche pharmaceutical service organization that focuses on regulatory submission support for the pharma and biotech industries.
None of the Above
Individuals or organizations that are unrelated to healthcare or the purpose of the scientific meeting
@RdgTerminalMkt The Reading Terminal Market—Since 1893
Unclear Identity Individual or organizations whose Twitter profile was vague or empty
@KhaliqWhy Khaliq. Seeking Knowledge
not perform additional Internet searches (e.g., Facebook or Google search) of accounts catego-rized as “unclear”. None of the investigators contacted any of the account holders to determine
their identity (seeDiscussionfor further information).
To ensure inter-rater reliability when categorizing Twitter account holders, we performed a
Light’s kappa statistic on a different set of previously published Twitter data [19]. The Light’s
kappa score was 0.72 for eight raters (AS, AS, VD, PS, SK, ZS, EL, DM).
Defining and Measuring Twitter Activity
We assessed Twitter activity using two methods. In the first method, we measured the number of distinct account holders per category that authored at least one tweet in one of the 13 confer-ences analyzed. We defined a high Twitter activity as that category with the largest number of account holders.
In the second method, we measured the total number of tweets authored by account holders in each category. We calculated the tweet:author ratio by dividing the number of tweets com-posed by the total number of authors within a particular category. We ascribed the greatest Twitter activity to that category with the highest ratio.
Defining and Measuring Twitter Influence
Keller, Leavitt et al, and Antoniadis et al defined influence as one’s ability (user A) to affect the
behavior of another (user B) [20–22]. On Twitter, that behavior is represented by the actions
that user B takes after reading user A’s tweet. Twitter allows user B to take one of two actions:
replying or retweeting a message [20,22]. In its most primitive form, Twitter influence is a
quantification of the number of replies or retweets that user A accrues [20,22]. The greater the
sum of replies to and retweets of user A’s tweets, the more influential user A is on Twitter. Although many social media research investigations (including this investigation) use this defi-nition of Twitter influence, they do not use the arithmetic sum to quantify it. Among the rea-sons for disuse is that the sum of replies and retweets ignores the existing level of Twitter influence with which a user begins. To account for the existing level of Twitter influence one has, and to be consistent with prior investigations that quantify Twitter influence, we measured
influence using the PageRank [20,22–34].
We calculated the PageRank of every account holder that was mentioned (@mentions) in the body of a tweet. The @mentions include both the replies to and retweets of one’s original tweet. Originally developed by Page, Brin, Motwani and Winograd, the PageRank is a link-based algorithm and considered by Williams, Baldwin, and Rubel to be the best measure of
social media influence [23–26]. As described by Abdullah, in the PageRank “a link from a page
to another page is understood as a recommendation and the status of the recommender is
important” [27]. A webpage, to which many others are linked, is considered an influential
web-page and is given a high PageRank [23,27]. Its PageRank increases even more when the linking
webpages are influential as well (i.e., have their own high PageRanks) [23,27–29]. Similarly, a
Twitter account that is mentioned (@mentions) many times and/or mentioned by other
influ-ential Twitter accounts will, itself, appropriately receive a high PageRank [31]. Indeed a
num-ber of investigators, including Abdullah, Kwak et al and Bakshy et al, have successfully used the
PageRank to accurately measure Twitter influence using @mentions [26,27,30–33]. The
PageR-ank of @mentions is also known as the “Influence Index” and is used by the independent
research firm Twitalyzer to measure one’s Twitter influence [34]. It is also the preferred
Privacy Considerations for Account Holders
The tweets collected from the HHP contained identifying information or links to such infor-mation. The same identifying information is freely available to the general public through the
Library of Congress [35,36]. Twitter’s Terms and Conditions warn account holders of the
pub-lic nature of tweets, specifically, “what you say on Twitter may be viewed all around the world
instantly” [12]. Perhaps because such identifying information is freely accessible, prior
investi-gators have not requested approval from their local institutional review boards [13,26,27,30–
33]. Currently there are no expectations for researchers to gain approval from any external
agency (government, Twitter, or others) to research Twitter data [37]. In many investigations,
including our own, researchers have adopted the “distance principle”, explained by Buchanan
et al [38]. Given that our investigation was an observation of data in the public space and did
not involve direct interaction with any account holder, the “distance principle”, along with the precedent set forth by previous investigators, supported our belief that external committee
review was unwarranted [37–40].
Nevertheless, the identifying information within each tweet was as critical to our investiga-tion as our ethical use of it. Therefore, we designed our methods in accordance with the United States Department of Homeland Security’s 2012 Menlo Report–a guide for investigators
per-forming “communication technology research” [41]. We also designed our methods to
con-form to the British Psychological Society’s guidelines for “Internet-mediated research” [42].
Finally, we complied with the six ethics guidelines recommended by Rivers and Lewis when
analyzing “big data” [37]. Our adherence to these strict and established guidelines satisfied our
professional sense of duty/ethics to maintain the privacy of the account holders whose Twitter activities comprised our data set.
Statistical Considerations
We performed content analyses using NOD Analytics (goo.gl/mfziXG). We used WordItOut (worditout.com) to graphically represent the popular scientific topics in each Twitter channel. We calculated frequencies per category for: 1) number of Twitter accounts that authored tweets, 2) number of Twitter accounts that were mentioned within a tweet, 3) number of tweets composed. We performed chi-square tests to compare these data using JMP Pro version 10.0.0 (SAS, Cary, North Carolina). We calculated PageRank using the NodeXL plugin (nodexl.code-plex.com) for Microsoft Excel 2013 (Microsoft, Redmond, Washington). Median and inter-quartile ranges for the PageRank were calculated and compared using the Kruskal-Wallis test. Each group needed to have at least 8671 @mentions in order to have achieved an 80% power to detect a 0.2 difference in PageRank. To mitigate any future concern about the lack of reproduc-ibility of our results, we 1) did not perform subgroup analyses of Twitter influence by confer-ence and 2) followed recent guidelines that make “classical hypothesis testing more congruent
with evidence thresholds for Bayesian tests” [43]. As a result, the significance level was set at
p<0.005 [43].
This investigation conforms to STROBE guidelines for observational research and SAMPL
guidelines for statistical reporting [44,45].
Results
Baseline Data
We collected 51159 tweets, authored by 8778 Twitter account holders, in 13 conferences,
spon-sored by 5 medical societies, from 2011 to 2013 (Table 1). Our data set represents 94.6% of
extraction process from the HHP or could not be parsed correctly by the software we used. The largest number of tweets and authors was in the 2013 American Society of Clinical Oncology’s annual meeting (15120 and 3156, respectively).
Content Analyses
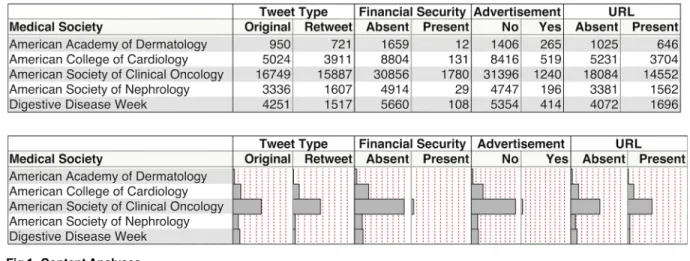
In every Twitter channel there were more original tweets composed (N = 30310) than retweets generated (N = 23643). The overall original tweet:retweet ratio was 1.28:1: the lowest ratio belonging to the American Society of Oncology’s annual meetings and the highest to the Diges-tive Disease Week meetings (1.05 versus 2.80, respecDiges-tively). There were very few
advertise-ments: the non-advertisement:advertisement ratio in our data set was 19.48:1 (Fig 1). A similar
favorable ratio was seen amongst tweets containing financial information. Finally, many more tweets were exclusively textual than associated with a multimedia image: a ratio 1.43:1.
Unsurprisingly the most common scientific topic in the entire data set revolved around the “patient” (e.g., patient care, patient centered, patient specific, etc.). Popular topics in the Ameri-can College of Cardiology Twitter channels were three clinical trials and three medications. The clinical trials were: CORONARY (sponsored by Canadian Institute of Health Research), PREVAIL (sponsored by Boston Scientific Corporation) and HPS2-THRIVE (sponsored by Merck and Company, Inc.). The popular medications were: Cangrelor (by The Medicines Company), Niacin (by AbbVie, Inc.), and Rivaroxaban (by Janssen Pharmaceuticals). Popular topics in the American Society of Oncology Twitter channels were specific diseases (melanoma, NSCLC [non-small cell lung cancer], myeloma, and breast cancer). We did not identify specific medications or clinical trials as popular topics in #asco11, #asco12, and #asco13.
Medications and diseases were the popular topics in the American Society of Nephrology Twitter channels. Aliskiren (by Novartis Pharmaceuticals), tolvaptan (by Otsuka Pharmaceuti-cal Company, Ltd.), and cinPharmaceuti-calcet (by Amgen, Inc.) competed with CKD (chronic kidney dis-ease), AKI (acute kidney injury), and ESRD/dialysis for popularity. In the Twitter channels of Digestive Disease week, the popular diseases discussed were IBD (inflammatory bowel disease), IBS (irritable bowel syndrome) and GERD (gastroesophageal reflux disease). Uniquely popular in the #ddw11, #ddw12, and #ddw13 channels were explicit mentions of third party commer-cial entities (specifically Pentax Medical and Olympus America Medical). Lastly, the only appearance of a governmental agency amongst the list of popular topics was in the #aad12 and #aad13 channels (NIAMS [National Institute of Arthritis and Musculoskeletal Skin Diseases]) (Figs2–6).
Fig 1. Content Analyses.
Twitter Activity and Influence
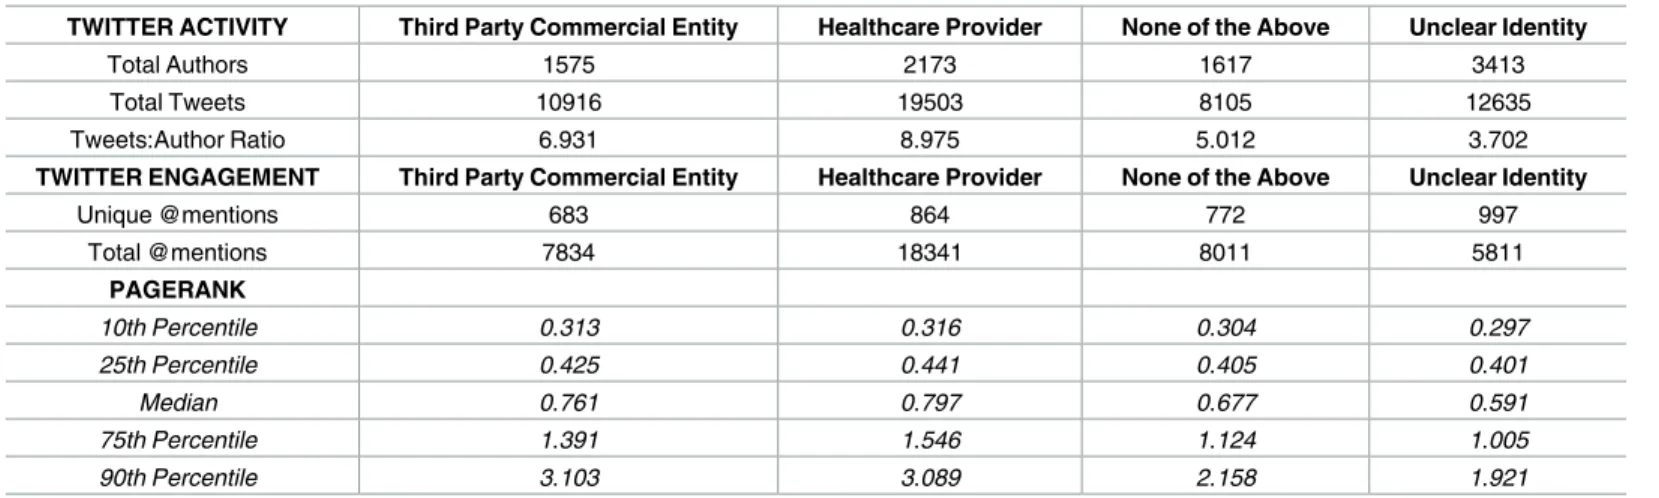
Nearly 61% of the authors had a Twitter profile that identified them (Table 4). In this group,
there were 2173 (25%) healthcare providers and 1575 (18%) third party entities (p<0.0001).
The largest group of authors could not be identified (3412; 39%; p<0.0001).
Despite being the greatest number of authors, those with unclear identities did not compose
the greatest number of tweets (Table 4). The tweet:author ratio for unidentified Twitter
Fig 2. Popular topics at the 2012 and 2013 American College of Cardiology Annual Meetings. Word clouds exclude
prepositions, conjunctions, articles, numbers, Twitter usernames, and official conference-specific hashtags.
doi:10.1371/journal.pone.0162376.g002
Fig 3. Popular topics at the 2011, 2012, and 2013 American Society of Clinical Oncology Annual Meetings. Word
clouds exclude prepositions, conjunctions, articles, numbers, Twitter usernames, and official conference-specific hashtags.
account holders was only 3.7. Healthcare providers composed 19503 tweets and had a tweet: author ratio greater than that of third party entities (8.98 versus 6.93 tweets per author;
p<0.0001).
In our data set, a total of 3316 Twitter accounts were mentioned a total of 39997 times (Table 4). Healthcare providers were mentioned nearly 46% of the time, while third party com-mercial entities were mentioned less than 20% of the time. The sum total of @mentions in the healthcare provider and third party categories was 26175: 1.5 times greater than the 17341 @mentions needed to achieve 80% power. The median PageRank for healthcare providers was the highest amongst the four categories. However, there was no statistical difference between it and the median PageRank for third party commercial entities (0.797 versus 0.761, respectively; p 0.175).
Discussion
Third Party Twitter Influence
Third party commercial entities had a statistically similar PageRank as healthcare providers (0.761 versus 0.797, respectively) despite having significantly fewer authors (1575 versus 2173, respectively) and significantly less Twitter activity (6.931 versus 8.975 tweets/author, respec-tively). This suggests that third parties are equally influential in the Twitter channels of scien-tific meetings as healthcare providers; a parity that is difficult to achieve at live conferences. Admittedly, there are no investigations that measure third party influence at live conferences. Perhaps the lack of data is due to conference organizers’ financial reliance on third parties to sponsor their conferences. In 2009, third parties gave close to $850 million dollars of
sponsor-ships to various medical conferences [1]. In 2011, 75% of conference organizers received third
party financial support [2]. Third parties provide printed and digital conference materials,
travel grants, and meals gratis. This financial dependence may preclude any scientific study of third party influence at live conferences. Nevertheless, conference organizers mitigate third
Fig 4. Popular topics at the 2011, 2012, and 2013 American Society of Nephrology Annual Meetings. Word clouds
exclude prepositions, conjunctions, articles, numbers, Twitter usernames, and official conference-specific hashtags.
party influence by geographically isolating third parties, curtailing their “hours of operation”,
and independently selecting topics and speakers for the conference agenda [2].
Conference organizers do not depend on the financial support of third parties to maintain active Twitter channels. Creating and registering a conference-specific hashtag and composing tweets are free. Yet not one of the eight conference organizers (in any of the 13 conferences
Fig 6. Popular topics at the 2012 and 2013 American Academy of Dermatology Annual Meetings. Word clouds
exclude prepositions, conjunctions, articles, numbers, Twitter usernames, and official conference-specific hashtags.
doi:10.1371/journal.pone.0162376.g006
Fig 5. Popular topics at the 2011, 2012, and 2013 Digestive Diseases Week. Word clouds exclude prepositions,
conjunctions, articles, numbers, Twitter usernames, and official conference-specific hashtags.
studied) implemented any safeguards to limit third party “detailing” [3]. As a former third party representative, Ahari outlined eight forms of detailing used by third parties to influence
individuals [3]. All eight can be easily adapted to work in Twitter channels. Indeed any message
from a third party is more likely to place a favorable bias on that party’s product/service than
unprejudiced evidence-based medicine [1].
Jalali, Wood, and others have suggested that conference organizers learn how their respec-tive Twitter channels are being used/misused in order to curtail the Twitter influence that third
parties have within them [16,31,44,46]. Our study is the first to elucidate this use/misuse by
various groups. Second, more must be done to establish guidelines for third party activities in Twitter channels. There are plenty of well-intentioned recommendations on the use of Twitter
by healthcare providers and conference organizers [17,47]. There are no comparable
recom-mendations for third parties or their interactions with HCPs or conference organizers [48].
Both the Pew Charitable Trusts and American Medical Student Association discuss how con-ference organizers can mitigate conflicts of interest (COI), but neither offer specific guidelines
in managing COIs within social media streams [1,49,50]. Therefore, the investigators of this
study recommend the following to bring the medical community closer to such guidelines:
• Conference organizers should publicly state in their Twitter channel that third party entities
should declare themselves as such in their respective Twitter profiles [36]
• Conference organizers should insist that third parties compose tweets that disseminate scien-tific facts and not solicitations for products/services
• If third parties wish to solicit for a product/service, they should include an additional hashtag in the body of their tweet (e.g., #ad) to allow participants within the channel to filter out such tweets
• Conference organizers should encourage third parties to restrict their Twitter activity to coincide with their live “hours of operation”
• Conference organizers should task independent individuals/groups to annually measure the PageRanks for each Twitter account mentioned (@mentions) within their conference-spe-cific hashtag
Table 4. Measures of Twitter Activity and Influence.
TWITTER ACTIVITY Third Party Commercial Entity Healthcare Provider None of the Above Unclear Identity
Total Authors 1575 2173 1617 3413
Total Tweets 10916 19503 8105 12635
Tweets:Author Ratio 6.931 8.975 5.012 3.702
TWITTER ENGAGEMENT Third Party Commercial Entity Healthcare Provider None of the Above Unclear Identity
Unique @mentions 683 864 772 997
Total @mentions 7834 18341 8011 5811
PAGERANK
10th Percentile 0.313 0.316 0.304 0.297
25th Percentile 0.425 0.441 0.405 0.401
Median 0.761 0.797 0.677 0.591
75th Percentile 1.391 1.546 1.124 1.005
90th Percentile 3.103 3.089 2.158 1.921
• Conference organizers should target third party accounts with abnormally high PageRanks for further education about best-practices within their respective Twitter channel
These recommendations would align third party activities in Twitter channels with their activities at live conferences. These recommendations are not mandates, but rather reasonable suggestions that are neither burdensome to conference organizers nor offensive to third party commercial entities. These recommendations are made with the same intentions as those that
guide physician activity on Twitter [17,47]. In both cases, monitoring, rather than
enforce-ment, is a key component of assessing compliance. Measuring yearly PageRank scores, as per-formed in this investigation, will help all parties monitor compliance. Conference organizers can implement targeted re-education efforts for those third parties that require additional assistance.
PageRank versus other measures of Twitter Influence
The PageRank of @mentions has been used by a number of Twitter researchers and is
consid-ered the closest estimation of Twitter influence [20,22,24–27,30,32,33]. Indeed even
commer-cial research firms, such as SEOmoz and Twitalyzer, use the PageRank of @mentions to
measure Twitter influence for their clients [34,41]. As Bray and Peters have indicated,
men-tioning someone in one’s tweet represents a major commitment to that person [51]. The more
a person is mentioned, the more they effect the conversation and the greater the Twitter
influ-ence they exert [31,34,51].
A common misperception is that the number of followers or impressions (which equals the product of the number of followers and tweets composed) is an accurate measure Twitter influ-ence. Any metric that uses the number of followers and/or tweets often results in false
calcula-tions of Twitter influence [20,22,52]. Bots can artificially inflate the number of tweets composed,
causing the impressions to be misleadingly elevated. Moreover, the number of followers or impressions excludes any interaction between participants. Perhaps for these reasons impres-sions and the number of followers are considered “vanity” metrics: easy to calculate but of little
value in measuring one’s Twitter influence [20,22,51].
Twitter researchers do not perform content analyses to measure influence [20,26]. Neither
this investigation nor the studies referenced in this report have analyzed tweet content to mea-sure Twitter influence. We have analyzed the content of the tweets in our data set to give the reader, if needed, a contextual framework upon which to interpret our results. Indeed Cha et al has mathematically analyzed various metrics to measure Twitter influence and concluded that
the PageRank of @mentions was one of the best ways to do so [32].
Unclear Identities on Twitter
There were 3413 Twitter accounts that could not be identified because their Twitter profiles were vague or empty. These accounts generated only 24.7% of the total tweets analyzed. We consciously avoided using alternative methods to identify these accounts. In accordance with recommendations by Farnan and McKee, we assumed that account holders with vague profiles
wanted to remain anonymous [39,53]. To respect these wishes, we did not contact any author
or perform additional Internet searches to ascertain their identities [37,38].
Strengths
tweets from 4 conferences sponsored by as many medical societies. [13,54]. We measured Twit-ter influence by calculating the PageRank of @mentions–the recommended metric by a number
of researchers, commercial research firms, and the co-founder of Twitter [24–26,30,32,34,41].
We conformed to three well-established sets of guidelines for conducting Internet-based
research and respected the privacy of those users who wanted to remain anonymous [1,37–
39,41,53]. Finally, and to the best of our ability we have reported our findings in accordance
with two sets of research-reporting guidelines [44,45]
Limitations
As with many studies that study Twitter activity, we were unable to directly measure influence. We used a proxy metric to measure Twitter influence: the PageRank. However, the PageRank is considered one of the best and most commonly used markers of social media influence
[20,22,23–27,30–34]. Second, our recommendations are unenforceable. As with any medical
guideline, our recommendations are meant to serve as a basis upon which best practices can be developed. The value of recommendations does not emanate from their enforceability, but rather from their ability, over time, to percolate throughout the Twitter medical community and change practice. To-date there is no known evidence that any set of voluntary guidelines regarding Twitter use can or cannot lead to changes in behavior. Third, our data set did not include those Twitter profiles that we could not identify. While 39% of all users were unknown, we met our power threshold. We calculated PageRanks using 39997 @mentions: 4.6 times more than the 8671 @mentions needed to achieve 80% power.
Conclusion
Using the PageRank as a surrogate marker, third party commercial entities exert an equal Twit-ter influence as healthcare providers in the TwitTwit-ter channels of medical conferences. Without safety mechanisms in place, Twitter channels can devolve into a venue for the spread of biased information rather than evidence-based medical knowledge, as seen at live conferences. Con-tinuing to measure the Twitter influence that third parties exert can help conference organizers develop reasonable guidelines for Twitter channel activity.
Author Contributions
Conceptualization: TD.
Data curation: TD DM.
Formal analysis: TD.
Funding acquisition: TD.
Investigation: TD Afreen Shariff Aabid Shariff XF EL PS SK ZS VD RM.
Methodology: TD Afreen Shariff Aabid Shariff.
Project administration: TD.
Resources: TD.
Software: TD.
Supervision: TD.
Visualization: TD.
Writing – original draft: TD.
Writing – review & editing: TD Afreen Shariff Aabid Shariff XF EL PS SK ZS VD RM.
References
1. Austad KE, Avorn J, Franklin JM, Kowal MK, Campbell EG, Kesselhelm AS. Changing Interactions between Physician Trainees and the Pharmaceutical Industry: A National Survey. Journal of General Internal Medicine. 2013; 28(8): 1064–1071. doi:10.1007/s11606-013-2361-0PMID:23444007
2. Lo B, Ott C. What is the Enemy in CME, Conflicts of Interest or Bias? Journal of the American Medical Association. 2013; 310(10): 1019–1020. doi:10.1001/jama.2013.221227PMID:23959071
3. Fugh-Berman A, Ahari S. Following the Script: How Drug Reps Make Friends and Influence Doctors. PLoS Medicine. 2007; 4(4): e150. PMID:17455991
4. Millenson ML. Getting doctors to say yes to drugs: The cost and quality of impact of drug company marketing to physicians. Blue Cross Blue Shield Association. 2003. Available athttp://www.thedcasite. com/Kickbacks/Getting_doctors_to_say_yes_to_drugs.pdf. Accessed on 29 October 2013.
5. 7 Things You Should Know About: Backchannel Communication. Educause. 2010. Available athttp:// www.educause.edu/library/resources/7-things-you-should-know-about-backchannel-communication. Accessed on 29 October 2013.
6. Coiera E. Social networks, social media, and social diseases. British Medical Journal. 2013; 346: f3007. doi:10.1136/bmj.f3007PMID:23697672
7. Djuricich AM, Zee-Cheng JE. Live tweeting in medicine: “Tweeting the meeting”. International Review of Psychiatry. 2015; 27(2): 133–139. doi:10.3109/09540261.2014.1000270PMID:25739015
8. Shariff AI, Fang X, Desai T. Using Social Media to Create a Professional Network Between Physician-Trainees and the American Society of Nephrology. Advances in Chronic Kidney Disease. 2013; 20(4): 357–363. doi:10.1053/j.ackd.2013.03.005PMID:23809288
9. Desai T, Shariff A, Shariff A, Kats M, Fang X, Christiano C, Ferris M. Tweeting the Meeting: An In-Depth Analysis of Twitter Activity at Kidney Week 2011. PLoS One. 2012; 7(7): e40253. doi:10.1371/ journal.pone.0040253PMID:22792254
10. O’Conner A, Jackson L, Goldsmith L, Skirton H. Can I get a retweet please? Health research recruit-ment and the Twittersphere. Journal of Advanced Nursing. 2014; 70(3): 599–609. doi:10.1111/jan. 12222PMID:23909740
11. Mysko C. An exploration of medical students’ views on using Twitter for medical education. Technical Report, Newcastle University. 2013. Available athttp://twitdoc.com/2BY1. Accessed on 29 October 2013.
12. Neuhaus F, Webmoor T. Agile Ethics for Massified Research and Visualization. Information, Commu-nication, and Society. 2012; 15(1): 43–65.
13. Chaudhry A, Glode M, Gillman M, Miller RS. Trends in Twitter Use by Physicians at the American Soci-ety of Cilnical Oncology Annual Meeting, 2010 and 2011. Journal of Oncology Practice. 2012; 8(3): 173–178. doi:10.1200/JOP.2011.000483PMID:22942812
14. Fenny N, Dimov V, Wolf R. Rapid Growth of Twitter Use by Allergists and Immunologists for Profes-sional Purposes. Annals of Allergy Asthma and Immunology. 2012; 109(5): A125. Available athttp:// bit.ly/WDujw
15. Hajar Z, Clauson KA, Jacobs RJ, Melomed YL. Leveraging social media in pharmacy: analysis of phar-macists engagement and use of Twitter. Presented at the 47th American Society of Health-Systems Pharmacists Midyear Meeting and Exhibition. 2012; Available athttp://www.ashpmedia.org/mcm12/ documents/Onsite%20Program%20Book.pdf. Accessed on 29 October 2013.
16. Jalali A, Wood TJ. Tweeting during conferences: educational or just another distraction. Medical Edu-cation. 2013; 47: 1129–1130.
17. Chretien KC, Kind T. Social Media and Clinical Care: Ethical, Professional and Social Implications. Cir-culation. 2013; 127: 1413–1421. doi:10.1161/CIRCULATIONAHA.112.128017PMID:23547180
18. Sugawara Y, Marimatsu H, Hozawa A, Shao L, Otani K, Fukao A. Cancer patients on Twitter: a novel patient community on social media. BMC Research Notes. 2012; 5: 699. Available athttp://www. biomedcentral.com/1756-0500/699. doi:10.1186/1756-0500-5-699PMID:23270426
20. Antoniadis K, Zafiropoulos K, Vrana V. A Method for Assessing the Performance of e-Government Twitter Accounts. Future Internet. 2016; 8(12): 1–18.
21. Keller K. Development of the Keller Influence Indicator. Research Summary. 2014. Available athttp:// karen-keller.com/sites/default/files/KII-Research-Summary-with-demographics.pdf. Accessed on 25 May 2016.
22. Leavitt A, Burchard E, Fisher D, Gilbert S. The Influentials: New Approaches for Analyzing Influence on Twitter. The Web Ecology Project. 2009. Available athttp://webecologyproject.org/wp-content/ uploads/2009/09/influence-report-final.pdf. Accessed on 24 May 2016.
23. Page L, Brin S, Motwani R, Winograd T. The PageRank Citation Ranking: Bringing Order to the Web. Technical Report, Stanford InfoLab. 1999. Available athttp://ilpubs.stanford.edu:8090/422/. Accessed on 29 October 2013.
24. Williams S. Is that all there is? A literature review and potential approach to measuring influence in social media. The Institute for Public Relations 16th International PR Research Conference. 2013. Available at http://www.instituteforpr.org/is-that-all-there-is-a-literature-review-and-potential-approach-to-measuring-influence-in-social-media/. Accessed on 29 October 2013.
25. Baldwin M. How to: Measure online influence. Mashable. 2009. Available athttp://mashable.com/ 2009/03/02/measuring-online-influence. Accessed on 29 October 2013.
26. Bakshy E, Mason WA, Hofman JM, Watts DJ. Everyone’s an Influencer: Quantifying Influence on Twit-ter. Proceedings of the fourth ACM International Conference on Web Search and Data Mining. 2011; 65–74. Available athttp://dl.acm.org/citation.cfm?id=1935845. Accessed on 29 October 2013.
27. Abdullah IB. Incremental PageRank for Twitter Data Using Hadoop. Techincal Report, University of Edinburgh. 2010. Available athttp://homepages.inf.ed.ac.uk/miles/msc-projects/abdullah.pdf. Accessed on 29 October 2013.
28. Langville AN, Meyer CD. Google’s PageRank and Beyond: The Science of Search Engine Readings. 2006. Princeton University Press, Princeton, NJ.
29. Rogers I. The Google PageRank Algorithm and How It Works. Available athttp://www.cs.princeton. edu/~chazelle/courses/BIB/pagerank.htm. Accessed 15 May 2015.
30. Kwak J, Lee C, Park H, Moon S. What is twitter, a social network or a news media? Proceedings of the 19th International Conference on World Wide Web. 2010; 591–600. Available athttp://dl.acm.org/ citation.cfm?id=1772751. Accessed on 29 October 2013.
31. Ye S, Wu SF. Measuring Message Propagation and Social Influence on Twitter.com. Proceedings of the Second International Conference on Social Informatics. 2010; 216–231. Available athttp://dl.acm. org/citation.cfm?id=1929342. Accessed on 29 October 2013.
32. Cha M, Haddadi H, Benevenuto F, Gummadi K. Measuring User Influence in Twitter: The Million Fol-lower Fallacy. Proceedings of the Fourth International AAAI Conference on Weblogs and Social Media. 2010. Available athttp://aaai.org/ocs/index.php/ICWSM/ICWSM10/paper/viewPaper/1538. Accessed on 29 October 2013.
33. Weng J, Lim EP, Jiang J, He Q. Twitterrank: finding topic-sensitive influential twitterers. Proceedings of the third ACM International Conference on Web Search and Data Mining. 2010; 261–270. Available athttp://dl.acm.org/citation.cfm?id=1718520. Accessed on 29 October 2013.
34. Leonhardt D. A Better Way to Measure Twitter Influence. New York Times. 2011. Available athttp:// 6thfloor.blogs.nytimes.com/2011/03/24/a-better-way-to-measure-twitter-influence/. Accessed on 29 October 2013.
35. Halavais A. Open up online research. Nature. 2011; 480:174–175. PMID:22158224
36. Forgie SE, Duff JP, Ross S. Twelve tips for using Twitter as a learning tool in medical education. Medi-cal Teacher. 2013; 35: 8–14. doi:10.3109/0142159X.2012.746448PMID:23259608
37. Rivers CM, Lewis BL. Ethical research standards in a world of big data. F1000Research. 2014; 3: 38.
38. Buchanan E, Aycock J, Dexter S, Dittrich D, Hvizdak E. Computer Science Security Research and Human Subjects: Emerging Considerations for Research Ethics Boards. Journal of Empirical Research on Human Research Ethics. 2011; 6(2): 71–83. doi:10.1525/jer.2011.6.2.71PMID: 21680978
39. Farnan JM. Connectivity and Consent: Does Posting Imply Participation? The American Journal of Bio-ethics. 2014; 14(10): 62–63. doi:10.1080/15265161.2014.947823PMID:25229595
40. Volpe R, Blackall G, Gree, M, George D, Baker M, Kauffman G. Googling a patient: Should health care professionals “google” their patients? Hasting Center Report. 2013. Available athttp://www.
thehastingscenter.org/Publications/HCR/Detail.aspx?id=6537. Accessed on 29 October 2013.
42. Ethics Guidelines for Internet-mediated Research. The British Psychological Society. 2013. Available at http://www.bps.org.uk/system/files/Public%20files/inf206-guidelines-for-internet-mediated-research.pdf. Accessed on 29 October 2013.
43. Johnson VE. Revising standards for statistical evidence. Proceedings of the National Academy of Sci-ences. 2013; 110(48): 19313–19317.
44. von Elm E, Altman DG, Egger M, Pocock SJ, Eotzsche PC, Vandenbroucke JP. The Strengthening the Reporting of Observational Studies in Epidemiology (STROBE) Statement: Guidelines for Reporting Observational Studies. PLoS Medicine. 2007; 4(10): 1623–1627.
45. Lang TA, Altman DG. Basic Statistical Reporting for Articles Published in the Biomedical Journals: The “Statistical Analyses and Methods in the Published Literature” or The “SAMPL Guidelines”. September 2013; Available at http://www.equator-network.org/wp-content/uploads/2013/03/SAMPL-Guidelines-3-13-13.pdf. Accessed 29 October 2013.
46. Mehrotra N, Dimov V. Tweeting the Meeting: Investigating Twitter Activity at the 2012 AAAAI Confer-ence. Journal of Allergy and Clinical Immunology. 2013; 131(2): AB34. Available athttp://www. jacionline.org/article/S0091-6749(12)02805-9/abstract
47. DeCamp M, Koenig TW, Chisolm MS. Social Media and Physicians’ Online Identity Crisis. Journal of the American Medical Association. 2013; 310(6): 581–582. doi:10.1001/jama.2013.8238PMID: 23942675
48. Guidance for Industry Fulfilling Regulatory Requirements for Postmarketing Submissions of Interactive Promotional Media for Prescription Human and Animal Drugs and Biologics: Draft Guidance. US Department of Health and Human Services. 2014. Available athttp://www.fda.gov/downloads/drugs/ guidancecomplianceregulatoryinformation/guidances/ucm381352.pdf. Accessed on 29 October 2013.
49. Carlat D, Bergh S, Carroll S. Conflict-of-Interest Policies for Academic Medical Centers: Recommen-dations for Best Practices. The Pew Charitable Trusts. 2013. Available athttp://www.pewtrusts.org/ en/research-and-analysis/reports/0001/01/01/conflictsofinterest-policies-for-academic-medical-centers. Accessed on 29 October 2013.
50. The AMSA Scorecard 2014: Methodology. Accessed on 18 May 2015. Available at http://teaching-hospitals.amsascorecard.org/methodology.
51. Bray P, Peters M. Social Authority: Our Measure of Twitter Influence. Moz. 2013. Available athttps:// moz.com/blog/social-authority. Accessed 29 October 2013.
52. Rubel S. Google’s PageRank is best way to rate online influence. Advertising Age. 2008; 79(43): 42.
53. McKee R. Ethical issues in using social media for health and health care research. Health Policy. 2013; 110(2–3): 298–301. doi:10.1016/j.healthpol.2013.02.006PMID:23477806