ALIENATION, AMBIVALENCE, AND SCOREKEEPERS: THREE ESSAYS ON PUBLIC OPINION FORMATION IN AMERICAN POLITICS
Scott Christopher O’Brien
A dissertation submitted to the faculty of the University of North Carolina at Chapel Hill in partial fulfillment of the requirements for the degree of Doctor of Philosophy in the Department of Political Science (American Politics).
Chapel Hill 2013
Approved by:
Thomas M. Carsey
Pamela J. Conover
Michael B. MacKuen
Kevin T. McGuire
ABSTRACT
SCOTT C. O’BRIEN: Alienation, Ambivalence, and Scorekeepers: Three Essays on Public Opinion Formation in American Politics
(Under the direction of Thomas M. Carsey)
This dissertation is composed of three chapters, each of which explores public opinion
formation in American politics:
The first chapter, titled “Polarization, Alienation, and Trust in Government,” introduces
perceived polarization (the ideological distance a citizen perceives between the parties) and ideological alienation (the perceived ideological distance between a citizen and the closest party) as process-oriented predictors of trust in government. Using the American National Election Studies
(ANES) Cumulative Data File, I find that polarization and alienation both explain trust. I find
that these relationships are robust across both time and trust measures.
The second chapter, “Left Behind: Competitive Nominations and Comparative
Candidate Ambivalence,” investigates comparative candidate ambivalence (simultaneously holding positive attitudes toward competing general election candidates) as a possible competitive
nomination carryover effect on thwarted voters. I draw on motivated reasoning theory to argue
that unlike other groups, thwarted voters should gather positive information about both party nominees during the general election due to (1) “sour grapes” toward their party; and (2) party
loyalty-driven pressure to support their party nominee. I test my theory in the context of the
competitive 2008 Democratic nomination contest between Hillary Clinton and Barack Obama.
longitudinal ambivalence between Clinton voters and five other electoral groups. My results are
promising, but limited due to low group sample sizes.
The third chapter, “Who Are the Scorekeepers? Sophisticated Independents and
Economic Perceptions,” attempts to validate Stimson’s (2004) theory that there is a small group
of politically well-informed but non-partisan citizens who evaluate the economy objectively. I
operationalize these “scorekeepers” as politically sophisticated independents and divide the
ANES sample into four groups: in-partisans, out-partisans, unsophisticated independents, and
sophisticated independents. On the micro level, I find evidence that partisans’ economic
retrospections are biased relative to independents’ retrospections. On the macro level, I find that
independents mirror the retrospections sample mean particularly well, but partisans are biased.
Lastly, I compare each group’s predicted probabilities of several retrospection responses across
Gross Domestic Product growth levels and find that sophisticated independents’ retrospections
ACKNOWLEDGEMENTS
I would like to thank Pamela J. Conover, Michael B. MacKuen, Kevin T. McGuire, and
James A. Stimson for serving on my committee. I would like to give special thanks to my
committee chair and dissertation advisor, Thomas M. Carsey, for his tireless guidance, endless
TABLE OF CONTENTS
Page
LIST OF TABLES ... viii
LIST OF FIGURES ... ix
Chapter I. POLARIZATION, ALIENATION, AND TRUST IN GOVERNMENT ... 1
The Framework of Trust ... 3
How Polarization and Alienation Might Explain Trust ... 8
Models, Data, and Measurement ... 10
Results ... 16
Discussion ... 20
Tables ... 24
Figures ... 26
II. LEFT BEHIND: COMPETITIVE NOMINATIONS AND COMPARATIVE CANDIDATE AMBIVALENCE ... 30
Theoretical Expectations for Comparative Candidate Ambivalence ... 36
Data and Measures ... 41
Comparative Candidate Ambivalence in the 2008 Presidential Election ... 47
Figures ... 62
III. WHO ARE THE SCOREKEEPERS? SOPHISTICATED INDEPENDENTS AND ECONOMIC PERCEPTIONS ... 63
Who Are The Scorekeepers? ... 67
Expectations for Four Groups ... 68
A Note about Expectations ... 71
Data and Methods ... 72
Micro-Level Group Economic Retrospection Differences ... 79
Macro-Level Analysis of Economic Retrospection Group Means ... 81
Intergroup Differences in How GDP Conditions Economic Retrospections ... 83
Discussion: The Elusive Scorekeepers ... 88
Tables ... 91
Figures ... 94
APPENDICIES ... 101
Appendix A. Supplementary Material for Chapter I ... 101
Appendix B. Supplementary Material for Chapter III ... 102
LIST OF TABLES
Table Page
1. The Effect of Perceived Polarization and Alienation on Trust, 1980-2004 ... 24
2. Predicted Probabilities of Trust by Polarization and Alienation Values, 1980-2004 ... 25
3. Discrete Change in Predicted Probability of Trust, 1980-2004 ... 25
4. Descriptive Statistics for , , and ... 57
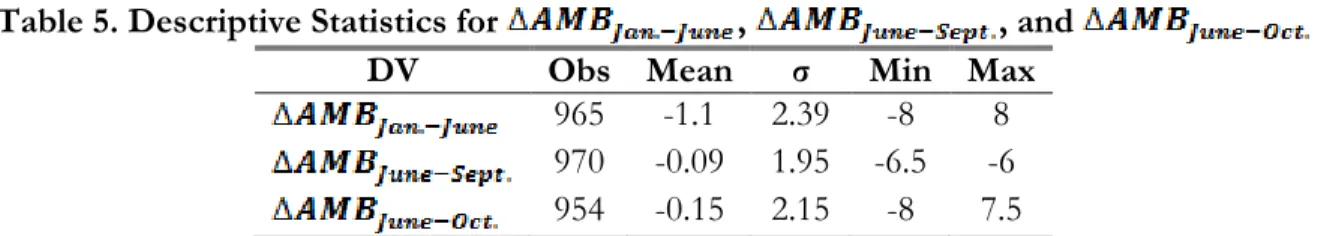
5. Descriptive Statistics for , , and ... 57
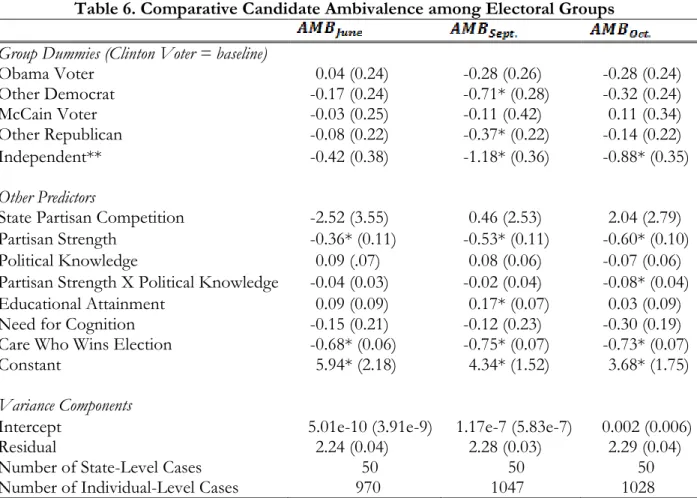
6. Comparative Candidate Ambivalence among Electoral Groups ... 58
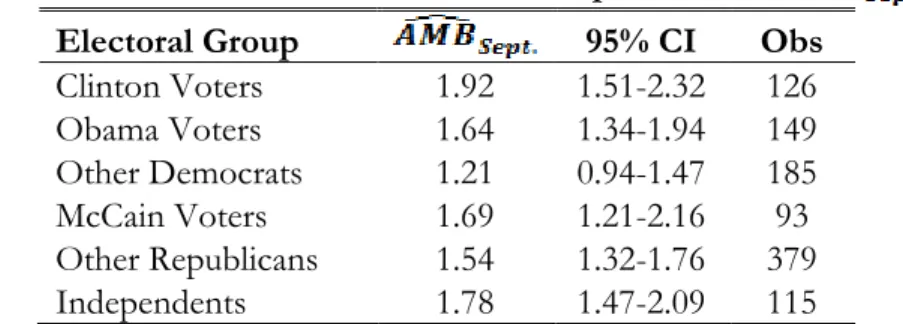
7. Post-Estimation Predicted Group Means of ... 59
8. Post-Estimation Predicted Group Means of ... 59
9. Post-Estimation Predicted Group Means of ... 59
10. Comparative Candidate Ambivalence Change among Electoral Groups ... 60
11. Post-Estimation Predicted Group Means of ... 61
12. Post-Estimation Predicted Group Means of ... 61
13. Post-Estimation Predicted Group Means of ... 61
14. Group Differences in Retrospective Economic Evaluations ... 91
15. Predicted Probabilities of Retrospection Categories by Group... 92
16. Group Differences in Predicted Probabilities of Retrospection Categories ... 92
LIST OF FIGURES
Figure Page
1. ANES Cumulative Data File Sample Mean Trust in
Government (1980-2004) [100-Point Trust Measure] ... 26
2. ANES Cumulative Data File Sample Mean Trust in Government (1980-2004) [Dichotomous Trust Measure] ... 26
3. Frequency Distribution of Perceived Polarization ... 27
4. Frequency Distribution of Ideological Alienation ... 27
5. ANES Sample Mean Perceived Polarization and Ideological Alienation ... 28
6. Predicted Probability of Trust across Perceived Polarization Values ... 28
7. Predicted Probability of Trust across Ideological Alienation Values ... 29
8. Mean Comparative Candidate Ambivalence over the 2008 Presidential Campaign (Primary Voter Groups) ... 62
9. Mean Comparative Candidate Ambivalence over the 2008 Presidential Campaign (Party Identifiers) ... 62
10. Economic Retrospections: In-Partisan Mean vs. Sample Mean ... 94
11. Economic Retrospections: Out-Partisan Mean vs. Sample Mean ... 94
12. Economic Retrospections: Sophisticated Independents Mean vs. Sample Mean ... 95
13. Economic Retrospections: Unsophisticated Independents Mean vs. Sample Mean ... 95
14. Pr(Somewhat Worse) as a Function of GDP (In-Partisans) ... 96
15. Pr(Somewhat Better) as a Function of GDP (In-Partisans) ... 96
16. Pr(About the Same) as a Function of GDP (In-Partisans) ... 97
17. Pr(Somewhat Worse) as a Function of GDP (Out-Partisans) ... 97
18. Pr(Somewhat Better) as a Function of GDP (Out-Partisans) ... 98
20. Pr(Somewhat Worse) as a Function of GDP (Unsophisticated Independents) ... 99
21. Pr(Somewhat Better) as a Function of GDP (Unsophisticated Independents) ... 99
I. POLARIZATION, ALIENATION, AND TRUST IN GOVERNMENT
Political trust reflects the perceived competence, fairness, and responsiveness of government. It
measures the public’s confidence in government to do what is right as well as perceptions of
how efficient, corrupt, and wasteful it is. Scholars regard trust as a vital sign of a democracy’s
health (Dahl 1971; Hetherington 2005). They generally agree that trust is necessary to legitimize
government policies, promote citizen compliance with the law, and maintain regime stability
(Gamson 1968; Barber 1983; Tyler 1990). Without sufficient trust, government must resort to
coercive practices to ensure its decisions are accepted and implemented (Levi 1997). Political
observers worry that low trust diminishes political participation. While limited distrust toward
government may be healthy in a deliberative democracy (Barber 1983; Warren 1999), if trust
vanishes altogether, so might the regime (Easton 1965; Gamson 1968; Hetherington 1998;
Hardin 1999).
Political observers expressed anxiety about the consequences of a well-documented
erosion of trust following the civil rights movement, Watergate, and Vietnam War and again
after trust unexpectedly plummeted in the early 1990s (e.g., Abramson 1983; Lipset & Schneider
1987; Miller & Borelli 1991; Craig 1996; Orren 1997; Citrin & Luks 2001; Hibbing &
Theiss-Morse 2001). Declining trust, they argue, potentially leads to concomitant reductions in voter
turnout, grassroots lobbying, and other means of political participation (Hibbing &
In this paper, I propose and test two potential influences on trust attitudes: The first is
perceived polarization -- the ideological gap citizens perceive between the major political parties. Observers have noted increasing separation of what V.O. Key (1964) termed “the parties in
government” and “the parties as organizations” along the traditional left-right ideological
spectrum. Since 1980, the Democratic Party has become more liberal and the Republican Party
has become more conservative, all else equal (Layman, Carsey, & Horowitz 2006). To date, only
limited scholarly work has investigated a possible relationship between polarization and trust.
Though some argue that polarization has driven voters (especially moderates) away from
political engagement, this conclusion is more anecdotally than empirically-supported (see King
1997; Hibbing & Theiss-Morse 2001; Fiorina, Abrams, & Pope 2006; Hetherington 2008). This
paper more rigorously investigates whether the ideological gap citizens perceive between the
parties has meaningful impacts on trust attitudes.1
The second potential determinant of trust I investigate is ideological alienation from the major political parties.2 I define ideological alienation as the Euclidian distance between citizens’
ideological self-placement and their placement of the nearest political party. Political scientists
have primarily investigated ideological alienation from candidates as an explanation for low
election turnout levels; the more ideological distance between a citizen and the closest political
party, the more likely he or she is to abstain from voting (Zipp 1985; Adams & Merrill 2003;
Plane & Gershtenson 2004). In this paper, I make the case that ideological alienation from the
parties may explain trust attitudes as well.
1 I analyze perceived polarization because citizens’ perceptions of polarization should drive their trust attitudes
In what follows, I use the American National Election Studies (ANES) cumulative file to
test a model incorporating both perceived polarization and ideological alienation as predictors of
trust. I proceed as follows: First, I review the existing literature on trust, polarization, and
alienation as well as their limited intersections. Next, I formally define the key concepts in my
analysis, lay out the theoretical reasoning behind my expected findings, and develop testable
hypotheses. Then, I discuss my model, data, and estimation methods. Finally, I report my results
and reach several substantive conclusions about them.
The Framework of Trust
David Easton’s (1965) seminal work on political institutions defines trust as a form of
support -- the evaluative inclination citizens hold toward political systems. He delineates two
aspects of political systems that determine the level of trust the citizenry has in government:
Specific support captures “attitudes toward an institution based on the fulfillment of demands for particular policies or actions” (Easton 1965, 273). Such support is derived from the actions of
policymakers. Thus, it is the type of support captured by performance variables such as
presidential approval. Easton argues that distrust toward the authorities can be remedied easily
through electoral replacement. As a result, it has been of less concern to scholars than the other
component, diffuse support.
Diffuse support refers to a “reservoir of favorable attitudes or goodwill that helps
members to accept or tolerate outputs to which they are opposed or the effects of which they
see as damaging to their wants” (Easton 1965, 273). This type of support comes from the
reverence an institution elicits and the responsiveness of the political process, independent of
those in power. As a result, it tends to remain more stable than specific support over time.
serious implications for democracy – since it cannot be remedied through electoral replacement,
it could potentially fester over time and eventually threaten a regime’s existence.
As a result of Easton’s work, the literature on trust in government has evolved around
the diffuse (process-oriented) and specific (performance-oriented) support framework. Scholars
used it to debate the ramifications of a major decline in trust during the late 1960s and early
1970s. On one side, Miller (1974a; 1974b) argued that the decline was institutional and hence the
effects were serious and likely to endure without significant institutional changes. Conversely,
Citrin (1974) claimed the decline stemmed from performance evaluations and not the
institutions of government more broadly. Therefore, the effects were less serious because they
were correctable via electoral replacement of incumbents.
Trust research has focused on performance-oriented causes of trust (Nye 1997).
Presidential and, in particular, congressional approval powerfully predict trust (Feldman 1983;
Williams 1985; Citrin & Green 1986; Erber & Lau 1990; Craig 1993; Hibbing & Theiss-Morse
1995; Hetherington 1998, Chanley, Rudolph, & Rahn 2000; Citrin & Luks 2001). Scandals and
perceived government corruption decrease trust (Garment 1991; Orren 1997; Pew 1998).
Another powerful factor is national economic performance, economic perceptions (Citrin &
Green 1986; Weatherford 1987; Miller & Borrelli 1991; Lawrence 1997; Hetherington 1998;
Chanley, Rudolph, & Rahn 2000; Citrin & Luks 2001; Hetherington & Rudolph 2008), and to a
lesser degree, personal economic problems such as unemployment (Nye & Zelikow 1997).
Finally, research indicates that declining trust can be attributed in part to moral discontent with
social ills such as crime and poverty (Craig 1993; Mansbridge 1997; Hetherington 1998; Pew
1998).
process-oriented influences at work. In one of the few research efforts to tackle these influences,
Keele (2007) found a positive over-time macro-level relationship between social capital and
trust. To date, no work has attempted to isolate individual-level process-oriented explanations of
trust. I propose and test two such potential explanations in this paper.
Party Polarization
The decline in trust in the early 1990s lacked any obvious explanation such as a poor
economy or an unpopular war or scandal, so scholars directed new energy toward better
understanding trust. At about the same time, they became normatively concerned about party
polarization and its effects on democracy. In simple terms, party polarization is the ideological
gap between the parties. The scholarly consensus is that beginning in the 1980s, the parties in
government and parties as organizations began polarizing. The trend was exemplified by the
Newt Gingrich-led Republican takeover of Congress in 1994 that resulted in a government
shutdown after severe partisan bickering.
The bulk of the work on institutional polarization has focused on Congress (see Layman
& Carsey 2002). In particular, studies have implicated the partisan realignment of the South
(Rohde 1991; Hood, Kidd, & Morris 1999; Jacobson 2000; Weisberg 2002), increasing
ideological dissimilarity between, and homogeneity within, parties in Congress (Abramowitz &
Saunders 1998; Hood, Kidd, & Morris 1999; Jacobson 2000; 2005; Weisberg 2002; Fleisher &
Bond 2004), changing demographics of congressional districts and the American public, and
increasing party activist influence as causes of congressional party polarization (McCarty, Poole,
& Rosenthal 1997; Gimpel 1999; Stonecash, Brewer, & Mariani 2003; Oppenheimer 2005;
party leadership, strategy, and rules within Congress (Rohde 1991; Cox & McCubbins 1993;
Sinclair 1995; 2000; Snyder & Groseclose 2000; Theriault 2006).
The evidence for polarization in the electorate is mixed; however, the balance of research
suggests that the public has also become more deeply divided in recent decades, but not to the
same degree as elites have (DiMaggio, Evans, & Bryson 1996; Levine, Carmines, & Huckfeldt
1997; Abramowitz & Saunders 1998; Jacobson 2000; 2005; Fleisher & Bond 2001; Layman &
Carsey 2002; Weisberg 2002; Stonecash, Brewer, & Mariani 2003). However, Fiorina, Abrams, &
Pope (2006) caution that the degree to which the parties have polarized in the electorate is
significantly overstated in the academic and popular literature. They argue that while the political
class has polarized in recent years, most citizens have remained relatively moderate. Layman,
Carsey, & Horowitz (2006) and Abramowitz & Saunders (2008) respond that Fiorina, Abrams,
& Pope’s (2006) findings, while important, still reveal statistically significant separation of the
parties in the electorate since 1980, particularly with regard to issue positions on abortion and
homosexuality.
Ideological Alienation
Political alienation can be broadly defined as the degree of estrangement one feels from
the political process. It came into vogue as a sociological research topic during the early 1970s in
the aftermath of massive social and political unrest over race relations, Watergate, and the
Vietnam War.Sociologists feared that these socially traumatic events would isolate the public
from the political process. Their work often treated government distrust and political efficacy as
the primary indicators of alienation (see Aberbach 1969; Miller 1974a, Miller 1974b; Citrin 1974;
distance between a citizen and the closest candidate (e.g., Davis, Hinich, & Ordeshook 1970;
Brody & Page 1973; Enelow & Hinich 1984). Ideological alienation is distinct from sociologists’
conception of political alienation because, while both concepts purport to capture a feeling of
isolation from the political system, ideological alienation is more narrowly focused on ideological
distance from candidates (or, as in this case, parties) and more metrically precise (measured using
Euclidean distance).3
Research indicates that citizens are less likely to vote if they are alienated by ideologically
distant candidates (e.g., Hinich & Ordeshook 1969; Hinich, Ledyard, & Ordeshook 1972; Zipp
1985; Adams & Merrill 2003; Plane & Gershtenson 2004). In this context, alienation measures
the linear distance from a citizen’s ideological self-placement to their placement of the nearest
candidate (Plane & Gershtenson 2004). The smaller this distance, the less alienated the citizen is
and the more likely he or she is to vote. The larger the distance, the more likely he or she is to
abstain. The spatial modeling literature typically contrasts alienation with indifference, which is
when both candidates are equidistant from the citizen. However, the predicted response is also
abstention (Brody & Page 1973). Since ideological distance is a summary measure of many
issue-based distances, some might question whether it accurately captures voters’ electoral calculus.
Hinich & Munger (1994) convincingly argue that the sheer number of electoral issues makes
using individual issue assessments prohibitively demanding of cognitive resources for most
voters. Therefore, a summary ideological distance measure accurately captures most voters’
assessment of their issue-based ideological proximity to candidates.
Though the spatial modeling literature is replete with theoretical depictions of alienation
and indifference, there is little empirical work that tests whether they affect actual voting
behavior. One such example is Zipp (1985), who finds that alienation from and indifference
toward perceived candidate issue positions affects the likelihood of voting in presidential
elections from 1968-1980, with indifference exerting a significantly larger impact than alienation.
Adams, Dow, & Merrill (2006) reinforce Zipp’s findings, modeling alienation and indifference as
functions of non-policy variables and empirically testing a formal theory-driven turnout model.
Plane & Gershtenson (2004) find similar results for both the probability of individual-level
voting and for aggregate-level turnout in midterm Senate elections.
To date, only one analysis has attempted to connect ideological alienation to citizens’
attitudes instead of voting behavior: King (1997) conceives of alienation as an individual-level
impact of aggregate-level party polarization. He finds that those who distrust government tend
to be the most ideologically distant from strong party identifiers. Building on this analysis, I
measure ideological alienation from the parties (rather than candidates or strong party
identifiers) to see if it improves our understanding of trust.
How Polarization and Alienation Might Explain Trust
There are several ways we might expect polarization to affect trust: First, it might impede
government performance. Ostensibly, parties that find themselves on opposite ends of the
ideological spectrum will have trouble moving legislation both in Congress and through the
president. Parties in government will be less likely to compromise on policy outcomes. The
result will be at worst complete gridlock or at best diminished policy output, resulting in
perceptions of ineffective government (Hetherington 1998). We might therefore expect citizens
to react to poor productivity by trusting government less to “do the right thing” since it is not
doing much at all.
leaders cannot engage in civil policy debates. As extreme ideologues shout at one another across
an ever-widening ideological divide, citizens may start to become cynical about the government’s
ability to construct reasoned policy. For example, in a Pew Research Center report, respondents
listed the overly partisan nature of government as a prevailing reason they disliked it (Pew 1998).
Moreover, experimental research has demonstrated that televised incivility leads to short-term
declines in trust (Mutz & Reeves 2005; Forgette & Morris 2006).
Alternatively, it is conceivable that polarization has the opposite effect on trust: Miller
(1974a) worried in the 1970s that undifferentiated parties may leave citizens dissatisfied by the
lack of clear alternatives, leading to distrust (Miller 1974a). It follows that clearly contrasting
choices might make citizens more likely to engage in the political process, leading to higher trust
(Hetherington 2001). It is also possible that citizens are comfortable with a certain degree of
gridlock because it ensures that the consequences of policy proposals are carefully considered
and that only centrist policies survive. Finally, polarization may build trust by ensuring that both
sides are energetically represented in policy debates, bitter as they may be.
Thus, I have theoretical support for both a negative and positive relationship between
polarization and trust. As a result, I formulate two competing polarization hypotheses: First, my
negative polarization hypothesis states that, all else equal, as perceived polarization increases, trust should decrease. Second, my positive polarization hypotheses states that, all else equal, as perceived polarization increases, trust should increase. This response should occur independently of the
citizen’s ideological position; it is the perceived gap between the parties that matters, not the
citizen’s ideological position relative to that gap.4
4 While alienation and polarization are conceptually distinct, scholars have argued that polarization may lead to
Turning to how ideological alienation should influence trust, alienated citizens should
feel excluded from the political discourse, leading to distrustful attitudes toward those
conducting it. More specifically, alienation should estrange citizens from the electoral process;
alienated citizens should feel excluded from electoral politics because neither party aspires to
represent their preferences in government. This should generate feelings of process-oriented
distrust toward government. Alienation should isolate citizens from the day-to-day policymaking
process as well; it is hard to trust government when you feel that neither party running it
represents your interests (Downs 1957; Zipp 1985; Dionne 1991; Shea 2003). The farther
citizens see themselves from a party, the more estranged from the political process they should
feel. On the other hand, those close to a party should be more likely to trust government since
they are represented in elections and have a consistent voice in government. Unlike alienated
citizens, even if their party is not in full control of government institutions, their party’s voice is
still heard and affects policy through constitutionally designed checks and balances and minority
party rights in Congress. Thus, the above reasoning allows me to specify my alienation hypothesis: all else equal, as a citizen’s ideological distance from the closest party increases, trust should
decrease. Since I am analyzing individual-level attitudes, I expect alienation to affect trust more
strongly than polarization since alienation directly relates a citizen’s ideology to the parties’
whereas perceived polarization does not take a citizen’s self-placement into consideration.
Models, Data, and Measurement
My empirical analysis aims to determine whether perceived polarization and ideological
alienation are meaningful predictors of trust. My theory leads me to anticipate a negative
decrease. My theory also predicts a relationship (either negative or positive) between trust and
polarization. If the data support the alienation and the negative polarization hypotheses, I can
compare the magnitude of each effect on trust to determine which matters most.
I employ two statistical models. The first is an ordinary least squares (OLS) regression of
the ANES-constructed 100-point trust composite variable on alienation, polarization,
presidential and congressional approval, economic prospections and retrospections, partisan
strength, ideology, and several other control variables. The second model is a logistic regression
of a binary trust measure on the same variables. The models are specified in equation form as
follows for each individual i:
Trusti = β0 + β1Polarizationi + β2Alienationi + β3Strength of Partisanshipi +
β4Ideological Self-Placementi + β5Presidential Approvali + β6Congressional Approvali +
β7Economic Retrospectionsi + β8Economic Prospectionsi + β9Controlsi + εi
I analyze data pooled from the cumulative ANES data file. Since congressional and
economic performance measures begin in 1980, I am limited to this year as my starting point in
pooling the data. However, I am able to include every subsequent ANES survey with the
exception of 2002 -- a year in which the perceived ideology question disappeared, only to return
in 2004. There are approximately 8,900 observations for each model. I weight the data using the
ANES-provided post-stratification weights to ensure my sample represents the U.S. population
as accurately as possible.
In my first analysis, I use the ANES-constructed trust index as my dependent variable.
This measure represents a composite of four different ANES measures, each of which is
This result is then rounded to derive each respondent’s trust value.5 These measures ask for
respondents’ assessments of government wastefulness, corruption, and responsiveness, along
with an ANES trust item asking respondents how often they can trust government to “do what
is right.” The index is scaled from 0 for “least trusting” to 100 for “most trusting” with a sample
mean of 32 (see Appendix A, Table A for descriptive statistics). In Figure 1, I graph the sample
means across survey years to give the reader a visual feel for the data. Since the dependent
variable approximates an interval scale, I estimate this model using OLS regression.
For my second analysis, I use an ANES survey question that was a component of the
composite variable used in my first analysis, but the only one that directly asks the respondent
how much he or she trusts government. Generally, political scientists regard this question as the
best measure of trust available (see Owen and Dennis 2001; Gershtenson 2005). I do this in
order ensure my results are robust across another prominent trust measure. The variable asks
respondents how often they can “trust the government in Washington to do what is right.” The
response categories are scored 1 for “none of the time” (a volunteered response), 2 for “some of
the time,” 3 for “most of the time,” and 4 for “just about always.” Since 96 percent of the cases
occur in the two middle categories, I collapse the four categories to form a dichotomous variable
with a mean of 0.35 (see Appendix A, Table A for descriptive statistics). The sample means
across survey years are graphed in Figure 2. Since this variable represents a binary outcome, I use
logistic regression to estimate the model.
My predictors of interest are perceived polarization and ideological alienation. My analysis is not concerned with the objectively “correct” placement of the parties. Rather, citizens’ perceptions
of party ideological locations are of substantive interest because perceptions should drive
government if that citizen does not perceive it; citizens form attitudes through a perceptual filter.
Since the ANES does not measure perceived polarization or ideological alienation directly, I
derive them from measured variables: Beginning in 1980, the ANES asks respondents for
ideological placements of both major political parties. Respondents can place the Republican and
Democratic parties on a seven-point scale ranging from “extremely liberal” to “extremely
conservative.” Respondents also place themselves on the same ideological scale. I use these
responses to construct my measures of alienation and polarization. My perceived polarization
measure is the absolute difference between each respondent’s placements of the parties on the
seven-point ideology scale:
where represents perceived polarization for each individual i, is
the respondent’s perceived ideological position of the Republican Party and is the perceived
ideological position of the Democratic Party. For example, a respondent who places the
Democratic Party at “1” (extremely liberal) and the Republican Party at “6” (somewhat
conservative) would receive a value of “5” on the perceived polarization scale (5 = 61). The
maximum perceived polarization value is 6 (if the respondent sees the parties as polar opposites)
and the minimum is 0 (if the respondent sees the parties as ideologically equivalent). Appendix,
Table A displays the descriptive statistics for perceived polarization. Figure 3 displays its
frequency distribution, which shows that most respondents place the parties between two and
four ideological units apart. On average, citizens see the parties as 2.79 ideological units apart,
I measure ideological alienation as the distance between the respondent’s ideological
self-placement and his or her closest party self-placement. More specifically, this is the minimum
absolute difference between the respondent’s self-placement and a party placement. It is
specified in equation form as follows:
where represents ideological alienation for each individual i, is respondent i’s ideological self-placement, is the respondent’s ideological placement of the Republican Party, and is the respondent’s ideological placement of the Democratic Party. The
respondent was party indifferent (equidistant from each party) in roughly one-fifth of the cases.
The sample mean of alienation is 0.85 with a standard deviation of 0.80 (see Appendix A, Table
A for descriptive statistics). Figure 4 displays the frequency distribution for ideological
alienation, which shows that most respondents place the closest party at or within one
ideological unit of themselves. Only 51 respondents placed the closest party more than three
ideological units away.6 Most respondents placed the other party two, three, or four units away
from themselves. There were only 13 cases in which the respondent’s self-placement and both
party placements were identical, meaning perceived polarization and ideological alienation both
equal zero.
So the reader can get a feel for the macro-level data, I display the biennial survey means
since 1972 for perceived polarization and ideological alienation in Figure 5. Notice that
ideological alienation has remained relatively stable since 1972 whereas perceived polarization
polarization’s standard deviation. Assuming that the parties in government and as organizations
have polarized, this suggests that citizens are moving to the poles with their parties. Clearly,
these trends deserve future macro-level investigation.
I model several other substantive predictors of trust. First, presidential approval is
measured on a four-point scale ranging from 1 for “strongly disapprove” to 4 for “strongly
approve.” Congressional approval is measured as a binary “approve/disapprove” variable. In
both cases, higher approval should predict higher trust. Since we know economic evaluations
affect trust, I include the ANES’s five-category measure of economic retrospections, which asks
respondents to assess the performance of the economy over the past year. The response
categories range from 1 for “much worse” to 5 for “much better.” Additionally, I include a
three-category measure of economic prospections scored 1 for “worse,” 2 for “same,” and 3
for “better.” Rosier economic forecasts and recollections should positively influence trust.
I also control for strength of partisanship and ideological self-placement. Past research
shows that party identification is not a significant predictor of trust – on average, Democrats do
not tend to trust government more than Republicans or vice-a-versa (Keele 2005). However,
there is evidence that independents trust government less on average than their partisan
counterparts. Therefore, I model partisanship in terms of strength instead of direction by
collapsing the ANES party identification scale to 1 for strong partisans, 2 for weak partisans, 3
for partisan-leaning independents, and 4 for pure independents (non-party-leaning). In terms of
ideological self-placement, I expect liberals to be more trusting of government, all else equal,
than conservatives, given liberals’ preference for an active government.7
7 Some scholars argue that ideology measures are biased because many citizens call themselves conservative but are
In order to account for demographic influences on trust, I include controls for race (1
for black, 0 for white), gender (1 for female, 0 for male), region (1 for South, 0 for non-South),
income (quintiles), age (in years), and education level (7-point scale). Based on a large body of
prior research, we expect these demographic variables to matter in predictable ways.8 For
example, we would expect respondents from the South to trust the federal government less than
respondents from the non-South given the South’s historical resistance to federal intervention in
the states.
Since I am analyzing pooled cross-sectional data, I anticipate and find post-estimation
evidence of heteroscedastic residuals. I correct for them using robust standard errors. Also, to
model changes in the mean of the dependent variable across survey years, I employ year
dummies (excluded from the tables to save space but reported in Appendix A, Table B). Both
models are identical with the exception of the estimation method (OLS vs. maximum likelihood)
and the measurement of the dependent variable.
Results
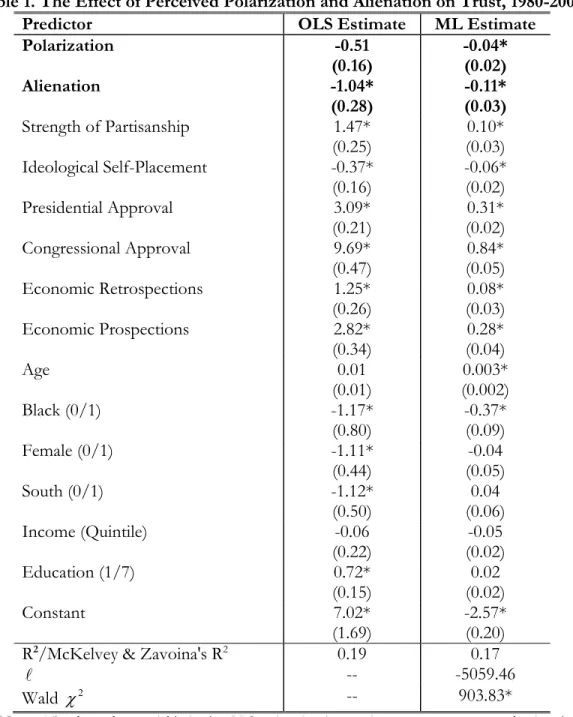
The results of the OLS regression analysis displayed in the left-hand column of Table 1
strongly support the negative polarization hypothesis and the alienation hypothesis -- each
variable has a significant negative relationship with the composite trust measure. For every
one-unit increase in perceived ideological distance between the parties (perceived polarization), trust
decreases by 0.51 points on the 100-point scale, all else equal (p < 0.01). Likewise, a one-unit increase in ideological distance to the closest party (ideological alienation) lowers trust on
average by 1.04 points on the same scale (p < 0.01). Though the alienation coefficient is larger than the polarization coefficient, the difference between them does not reach statistical
significance (p = 0.11, two-tailed). Since a one-unit increase in either polarization or alienation may not be realistic given their distributions, we can add further interpretive clarity by putting
these effects in the context of their standard deviations: A one standard deviation increase in
polarization (1.44 ideological units) reduces trust by 0.73 points whereas a one standard
deviation increase in alienation (0.80 ideological units) reduces trust by 0.83 points. Thus, both
perceived polarization and ideological alienation have a similar statistically significant negative
effect on trust.
The other predictors in the OLS model behave as expected.9 Consistent with the
established literature, congressional approval (β = 9.69, p < 0.01) and presidential approval (β = 3.09, p < 0.01) are the most powerful predictors of trust. Further, as expected, partisans tend to trust government more than non-partisans and conservatives tend to trust government less than
liberals, all else equal. Economic evaluations play a large role in explaining trust as well: Those
who felt the economy had improved over the past year and felt it was going to get better in the
future trusted government more than those who were less rosy about the past economy and less
optimistic about the future economy.10
9Hetherington’s (1998) work suggests possible endogeneity concerns with my models. As with any individual-level
model, causality may flow from my dependent variable (trust) to the predictors. However, my predictors of interest -- perceived polarization and ideological alienation -- both make more theoretical sense causally preceding trust than being caused by it; in other words, it is difficult to make a compelling theoretical case that one’s trust in government should cause ideological placements of the parties and one’s ideological self-placement. Another possibility is that a general trust attitude causes perceived polarization, ideological alienation, and trust in government, rendering the apparent causal relationship between polarization/alienation and trust spurious. However, there is no commonly asked general trust measure in the ANES Cumulative Data File with which to test for spurious causation.
10 Several control variables reached statistical significance in predicted directions as well, though I refrain from
To strengthen the robustness of my results, I test a similar model using the more focused
dichotomous measure of trust described above. The results of this maximum likelihood (ML)
estimation are displayed in the right-hand portion of Table 1. They are similar to those obtained
using the 100-point trust index as the dependent variable. Though the magnitude of logistic
regression coefficients cannot be interpreted directly, we can use them to assess the direction
and significance of relationships. Table 1 shows that perceived polarization and ideological
alienation each retain their anticipated sign and significance (p < 0.01). Therefore, based on the two models’ reinforcing results, I can conclude with confidence that the likelihood of a citizen
trusting government decreases as perceived polarization and ideological alienation increase.
Measures of overall model fit indicate a reasonably well-specified model: The McKelvey and
Zavonia Pseudo-R2 is 0.17 and the model classifies 69.4% of the cases correctly.
I can further interpret the logistic regression results by looking at predicted probabilities
of trust at each value of polarization and alienation.11 Table 2 shows the predicted probabilities
of a trust response across values of polarization and alienation with all other predictors held at
their means, as well as the 95% confidence interval for each probability. Figures 6 and 7 display
the same information graphically, with 95% confidence bounds plotted as dotted lines on either
side of the predicted probability line. For perceived polarization, those placing the parties at the
same place in ideological space (perceived polarization = 0) have the highest predicted
probability (0.35) of trusting the government, all else equal. Those with a polarization value of 4
have a predicted probability of trust that is 0.04 lower (0.31). The predicted probability of trust
declines monotonically across perceived polarization values – 0.01 per unit increase in
polarization – such that a minimum to maximum change in polarization reduces the predicated
For ideological alienation, the results are more dramatic: Someone whose ideological
self-placement matches their placement of a political party (alienation = 0) has a 0.35 predicted
probability of trusting the government, all else equal. However, when alienation is 3, the
probability of trust drops by 0.07 to 0.28. Again, this relationship is monotonically decreasing,
with the predicted probability of trust declining by 0.01, 0.02, or 0.03 per unit increase in
alienation. Taken together, these results suggest meaningful negative impacts on trust as
polarization and alienation values increase.
Finally, it would be helpful to compare the magnitude of perceived polarization and
ideological alienation effects on trust with that of other known trust predictors. To do so, I
compute discrete changes in the predicted probability of trust for each statistically significant ML
model predictor reported in Table 1. Table 3 shows the change in predicted probability of trust
after a one standard deviation increase in each predictor’s value, centered about its mean and
with all other variables held at their respective means.12 A one standard deviation increase in
perceived polarization and ideological alienation decreases the predicted probability of trust by
0.014 and 0.019, respectively. The discrete effects of polarization and alienation on trust are
similar in absolute magnitude to strength of partisanship (0.019), ideology (-0.018), economic
retrospections (0.020), and age (0.012). Thus, the explanatory power of perceived polarization
and ideological alienation is comparable to that of several established trust predictors, though
not as powerful as presidential and congressional approval.
To recapitulate, my results show that perceived polarization and ideological alienation
represent two significant process-oriented predictors of trust that have been studied largely in
12 To analyze change in discrete predicted probabilities, I use the prchange command from the SPost add-on to
isolation from the trust literature until this point. When voters feel ideologically alienated by the
political parties, they tend to trust government significantly less than they would otherwise.
Perceived ideological distance between the parties is also a significant predictor of trust.
Therefore, the data strongly support both the negative polarization hypothesis and the alienation
hypothesis.
Discussion
It was been several decades since Miller and Citrin debated the significance of political
trust. Empirically, Citrin appears to have gotten the better of Miller: Performance-oriented
explanations have dominated the scholarly understanding of what influences trust. So, it would
appear trust is not a big deal since electoral replacement can easily fix poorly performing
government leaders. However, this paper’s results give Miller’s side of the debate hope: When
controlling for performance, the process-oriented variables perceived polarization and
ideological alienation matter. Unlike ephemeral performance-oriented variables like presidential
approval and economic retrospections, polarization and alienation both reflect enduring
institutional characteristics, namely how the parties relate to each other and to citizens in
ideological space; polarization and alienation cannot be changed quickly or easily through
electoral replacement.
Polarization and alienation matter to citizens because they capture how well the parties
reflect their preferences (alienation) and how effectively the parties in government operate
(polarization). Citizens who perceive ideologically distant parties may trust government less than
others because they fear a broken political discourse, an inability to compromise on policy
the electoral process, policy debates, and potential policy outcomes. Though polarization and
alienation are meaningful process-oriented individual-level predictors of trust, there are likely
others yet to be identified. It could end up being the case that both Miller and Citrin are right if
new process-oriented variables emerge to balance the performance-oriented factors that
currently dominate the menu of trust predictors.
My results suggest that divisive inter-party conflict matters when it comes to explaining
trust. Political observers’ critical claims that elite polarization creates a divisive political culture
that turns citizens off to government are well-founded. However, trust is also affected negatively
by a phenomenon that has received far less scholarly attention: alienation -- the ideological
chasm between citizens and parties that do not represent their preferences (see Hibbing and
Theiss-Morse 1995; 2001). In short, Downs (1957) is right: ideological proximity matters;
citizens want parties that reflect their preferences. When citizens’ preferences become distant
from those who represent them in government, they react by trusting government less to “do
what is right.” Future research should tap the potential explanatory power of polarization and
alienation for understanding other barometers of democratic health such as political efficacy and
party identification rates.
It is important to emphasize that since I analyze individual-level relationships across
time, my results are not time-bound – in other words, they do not depend on macro-level
conditions for their validity. For example, while individual-level alienation may be higher on
average when the parties in government are polarized (given a citizenry with normally distributed
ideological preferences), the relationships described in this paper exist independent of
macro-level polarization.13 In fact, alienation can be likely even when the parties are not polarized. For
13 Polarization will often lead to an alienated citizenry, but it need not always do so. For example, if the citizenry is
example, Miller (1974a; 1974b) wrote about alienation at a time when both parties were
perceived as centrist and out of touch with a comparatively polarized public.
Though individual-level trust work remains interesting, the long-term consequences of
process-oriented declines in trust may be best approached from a macro-level perspective.
Keele’s (2007) work on social capital demonstrates that dynamic causal linkages can help clarify
our understanding of phenomena like trust. Like social capital, process-oriented effects like
polarization and alienation have serious and deep-reaching implications for American
democracy: The absence of trust may create a political climate where elites are unable to avoid
gridlock. Schattschneider (1960) worried that strong (i.e., polarized) parties might alienate voters
and, in turn, decrease trust. Polarization- and alienation-induced trust declines might in turn
trigger mass disengagement from the political process. These defections (especially by
moderates) could lead to politics dominated by ideologues who initiate a downward spiral by
alienating more and more members of the citizenry until trust reaches levels that threaten regime
stability.
To effectively address Schattschneider’s concerns, scholars must better understand how
elites and the mass public respond to one another. To the extent that elites lead the citizenry, we
may observe citizens polarizing in-step with the parties, as the over-time alienation data
presented in Figure 5 suggest may be happening (Shea 2003; Layman, Carsey, & Horowitz 2006).
As citizens polarize, they would (on average) become less and less alienated by the closest party.
Alternatively, parties may respond to lower trust by moving closer to the citizens they are
alienating. If this is the case, alienation would not be as dangerous as it seems now. What
ultimately happens speaks to the heart of the performance versus process debate that has
alienation may be relatively ephemeral, easily cured diseases. However, if the political process
Tables
Table 1. The Effect of Perceived Polarization and Alienation on Trust, 1980-2004^
Predictor OLS Estimate ML Estimate
Polarization -0.51
(0.16) -0.04* (0.02)
Alienation -1.04*
(0.28) -0.11* (0.03)
Strength of Partisanship 1.47*
(0.25) (0.03) 0.10*
Ideological Self-Placement -0.37*
(0.16) -0.06* (0.02)
Presidential Approval 3.09*
(0.21)
0.31* (0.02)
Congressional Approval 9.69*
(0.47) (0.05) 0.84*
Economic Retrospections 1.25*
(0.26)
0.08* (0.03)
Economic Prospections 2.82*
(0.34) (0.04) 0.28*
Age 0.01
(0.01)
0.003* (0.002)
Black (0/1) -1.17*
(0.80) -0.37* (0.09)
Female (0/1) -1.11*
(0.44)
-0.04 (0.05)
South (0/1) -1.12*
(0.50) (0.06) 0.04
Income (Quintile) -0.06
(0.22)
-0.05 (0.02)
Education (1/7) 0.72*
(0.15) (0.02) 0.02
Constant 7.02*
(1.69)
-2.57* (0.20) R2/McKelvey & Zavoina's R2 0.19 0.17
-- -5059.46
Wald 2 -- 903.83*
Notes: The dependent variable in the OLS estimation is trust in government measured using the ANES
trust index scaled from 0 for “least trusting” to 100 for “most trusting.” The dependent variable in the ML estimation is trust in government measured using a binary scale of 1 for “trust” and 0 for “do not trust.” Table entries are OLS/ML estimates with robust standard errors in parentheses. Year dummies in Appendix A, Table B. ANES supplied weights used to ensure data accurately represent population. *p < 0.05 (two-tailed); N = 8,904 (OLS); N = 8,901 (ML). ^2002 not included.
Table 2. Predicted Probabilities of Trust by Polarization and Alienation Values, 1980-2004^
Polarization/Alienation
Value Probability of Trust = 1 for Polarization
95% Confidence
Interval
Probability of Trust = 1 for
Alienation
95% Confidence
Interval
0 0.35 0.33-0.38 0.35 0.33-0.36
1 0.34 0.32-0.36 0.32 0.31-0.33
2 0.33 0.32-0.35 0.30 0.28-0.32
3 0.32 0.31-0.33 0.28 0.25-0.30
4 0.31 0.30-0.33 0.25 0.22-0.29
5 0.30 0.28-0.32 0.23 0.19-0.28
6 0.29 0.27-0.32 0.22 0.16-0.27
Notes: Predicted probabilities calculated using the prvalue command from the SPost add-on package for Stata
while holding all predictors at their mean (Long & Freese 2005). Predicted probabilities are based on ML estimation results in Table 1. ^2002 not included.
Table 3. Discrete Change in Predicted Probability of Trust, 1980-2004^
Predictor
Polarization -0.014
Alienation -0.019
Strength of Partisanship 0.019 Ideological Self-Placement -0.018
Presidential Approval 0.080
Congressional Approval 0.090
Economic Retrospections 0.020
Economic Prospections 0.044
Age 0.012
Black (0/1) -0.024
Notes: Only statistically significant predictors included. To analyze change in discrete predicted probabilities, I use
the prchange command from the SPost add-on package for Stata while holding all predictors at their mean
II. LEFT BEHIND: COMPETITIVE NOMINATIONS AND COMPARATIVE CANDIDATE AMBIVALENCE
The 2008 presidential election featured the most competitive Democratic Party nomination
contest since 1984. Both frontrunners, New York Senator Hillary Clinton and Illinois Senator
Barack Obama, presented strong candidacies: Clinton attracted key traditional Democratic
constituencies (working-class whites, seniors, Hispanics, and women) and touted her experience
advantage over Obama, a relative newcomer to the national political scene. Obama’s support
base in the primaries consisted of young (under 45 years old), well-educated, affluent, and black
voters. Throughout the primary and caucus season, prominent Democrats worried about facing
their first brokered convention since 1984.14 Clinton claimed an overall popular vote lead,
winning primaries in several delegate-rich states including California, New York, and
Pennsylvania.15 By the time the final primaries ended in June, Clinton had amassed 1,640 pledged
delegates to Obama’s 1,763 and 286 superdelegates to Obama’s 395. Obama lacked enough
pledged delegates to clinch the nomination outright; it was only after a last-minute surge in
superdelegate commitments that he surpassed the required 2,118 delegates to secure the
nomination.16 Clinton officially withdrew from the race on June 7. Democrats found themselves
consolidating support for their nominee against an opponent with a four month head start.
14 For example, see Van Natta & Becker (2008).
non-Competitive nominations like the Democrats experienced in 2008 are purported to
weaken a party and its nominees by: (1) causing intra-party conflict that divides the party into
factions; (2) exposing the eventual nominee’s weaknesses that the opposing party can exploit; (3)
diverting resources from the general election to the nomination campaign; and (4) causing
disaffected supporters of nomination losers (including activists) to demobilize, defect, or abstain
from voting for the party nominee on Election Day due to “sour grapes” (see Key 1958; White
1961; Ranney 1975; Comer 1976; Kirkpatrick 1976; Sullivan 1977-1978; Ware 1979; Polsby &
Wildavsky 1980; Wayne 1981; Polsby 1983). Political scientists have extensively studied the
effects of so-called “divisive” nominations on general election behavior across gubernatorial,
senatorial, and presidential races, using mostly aggregate (state-level) data.17 Some studies find
that such primaries have negative “carryover effects” on the general election campaign
(Bernstein 1977; Born 1981; Kenney & Rice 1984; Southwell 1986; Stone 1986; Kenney & Rice
1987; Lengle, Owen, & Sonner 1995), whereas others find they have insignificant or mixed
effects (Hacker 1965; Pierson & Smith 1975; Born 1981; Buell 1986; Kenney & Rice 1987;
Atkeson 1998) or even positive ones (Stone, Atkeson, & Rapoport 1992; Atkeson 1993; Hogan
2003; Shafer & Wichowsky 2009).
Most competitive nomination studies that find negative aggregate-level effects loosely
attribute them to unmeasured individual-level disaffection among thwarted primary voters
toward their party for failing to nominate their preferred candidate. These “sour grapes” are
typically assumed to mediate the causal linkage between nomination competitiveness and
state-level general election results. As Ware (1979) points out, this disconnect between individual-state-level
17 “Divisive primary” analyses typically operationalize divisiveness as the competitiveness of the primary (i.e.,
theory and aggregate-level data makes any causal interpretation tenuous. Individual-level analyses
have attracted far less scholarly attention (but see Lengle 1980; Southwell 1986; Stone 1986;
Kenney & Rice 1988; Pierce 2003).18 Notable recent work by Henderson, Hillygus, & Tompson
(2010) finds that “sour grapes” did not increase the probability of McCain defection among
Democratic primary voters in 2008. However, the authors operationalize “sour grapes” as a
non-specific “frustrated” response on a checklist of feelings about the upcoming presidential election
instead of something nomination-specific (524).19 The preponderance of both state- and
individual-level competitive nomination studies focus on vote choice impacts, potentially
missing less obvious but equally important impacts on thwarted voters’ attitudes that occur prior
to Election Day and may provide a necessary causal link to their voting behavior.
Surprisingly, no studies to date have considered potential competitive nomination
carryover effects on the attitudes of thwarted voters. In this paper, I argue that thwarted voters
may be susceptible to increased levels of attitudinal ambivalence toward the general election
candidates after their preferred candidate (the competitive nomination loser) withdraws from the
election. Attitudinal ambivalence is not a normal attitude structure – it is an inherently unstable
state of internal attitude conflict. Attitudinal ambivalence, which has been developed and studied
in the psychology literature, can be broadly understood as “an individual’s endorsement of
competing considerations relevant to evaluating an attitude object” (Lavine 2001, 915). In a
political context, ambivalence occurs when (1) an individual simultaneously holds positive and
negative attitudes toward the same candidate, party, or policy; or (2) an individual holds positive
attitudes toward competing candidates, parties, or policies (Lavine 2001; Basinger & Lavine
18 Two of these analyses employ simultaneous equation models in which nomination candidate preference indirectly
2005). In order to signify ambivalence, the competing attitudes must be similar in magnitude and
of at least moderate intensity. Thus, weakly held but conflicting beliefs do not generate sufficient
conflict to denote ambivalence (Mowrer 1960; Thompson, Zanna, & Griffin 1995; Lavine 2001).
Ambivalence is important because it has meaningful implications for how citizens think
and behave. It can paralyze a voter’s decision-making process, delaying formation of voting
intentions and diminish the impact of these intentions on vote choice (Lavine 2001; Alvarez &
Brehm 2002). Ambivalence makes political attitudes more moderate, less stable, and less
accessible (Huckfeldt & Sprague 2000; Lavine 2001; Meffert, Guge, & Lodge 2004; Lodge &
Taber 2005) and partisan attachments and policy judgments more variable (Alvarez & Brehm
2002; Rudolph 2005; Keele & Wolak 2006). Ambivalence affects the accuracy and processing of
candidate evaluations, as well as how issues inform them (Lavine 2001; McGraw, Hasecke, and
Conger 2003; Meffert, Guge, & Lodge 2004; Basinger & Lavine 2005; Craig et al. 2005). These
effects may result in poorly reasoned voting decisions where the voter ignores competing
considerations in an effort to avoid the discomfort they cause, instead relying on cues or gut
feelings. Ambivalence may also discourage political participation (Mutz 2002). However,
ambivalence also tends to make citizens more deliberative, receptive to new messages, and
even-handed decision makers than their less conflicted counterparts (Sniderman 1981; Guge &
Meffert 1998; Green, Visser, & Tetlock 2000). Rather than ignorance, ambivalence suggests
sophisticated multi-dimensional political thinking.
To date, scholars have largely treated ambivalence as an exogenous variable, focusing on
its consequences and magnitude as it pertains to issues (e.g., Craig, Kane, & Martinez 2002),
institutions (e.g., McGraw & Bartels 2005), candidate evaluation (e.g., McGraw, Hasecke, &
Conger 2003; Meffert, Guge, & Lodge 2004), and partisanship (e.g., Keele & Wolak 2006).
sources of ambivalence. This fledgling work finds that partisan and ideological strength
discourage ambivalence, but exposure to diverse social messages, education, information, and
need for cognition encourage it (Mutz 2002; Huckfeldt, Mendez, & Osborn 2004; Steenbergen
& Brewer 2004; Rudolph & Popp 2007). Other work suggests that ambivalent attitudes result
from value conflict (Alvarez & Brehm 2002; Steenbergen & Brewer 2004; Keele & Wolak 2006),
affective reactions (Lavine et al. 1998), and group and candidate trait evaluations (Meffert, Guge,
& Lodge 2004; Lavine & Steenbergen 2005).
Limited research has attempted to uncover sources of ambivalence during a campaign:
Keele & Wolak (2008) investigate the effect of state-level campaign context on ambivalence,
finding that it tends to be higher among residents of battleground states where voters are
exposed to a greater quantity of conflicting political messages. Only one published paper has
investigated campaign ambivalence longitudinally: Using the same dataset I use in this paper,
Rudolph (2011) models ambivalence change over the course of the 2008 presidential campaign,
though he only makes a first cut at decomposing the sample to examine possible between-group
heterogeneity.20 While he finds that ambivalence generally declines as the campaign progresses
and is weaker among devout partisans than dispassionate ones, he does not investigate
ambivalence as a possible nomination carryover effect.21 Therefore, important work remains to
be done to determine whether intra-party competition causes ambivalence among thwarted
voters toward the general election candidates.
20 This was preceded by an unpublished paper (Steenbergen, Lavine, & Goolsby 2006) that used data from two
ANES panels to study the stability of partisan ambivalence across election years, though the data did not permit analysis within a single campaign.
21 He does attempt to examine whether Democrats’ comparative candidate ambivalence toward McCain and Obama