Collective frequency variation in network synchronization and
reverse PageRank
Per Sebastian Skardal1,*, Dane Taylor2, Jie Sun3,4, and Alex Arenas5
1Department of Mathematics, Trinity College, Hartford, CT 06106, USA
2Carolina Center for Interdisciplinary Applied Mathematics, Department of Mathematics,
University of North Carolina, Chapel Hill, NC 27599, USA
3Department of Mathematics, Clarkson University, Potsdam, NY 13699, USA
4Department of Physics, Clarkson University, Potsdam, NY 13699, USA
5Departament d’Enginyeria Informàtica i Matemàtiques, Universitat Rovira i Virgili, 43007
Tarragona, Spain
Abstract
A wide range of natural and engineered phenomena rely on large networks of interacting units to reach a dynamical consensus state where the system collectively operates. Here we study the dynamics of self-organizing systems and show that for generic directed networks the collective frequency of the ensemble is not the same as the mean of the individuals’ natural frequencies. Specifically, we show that the collective frequency equals a weighted average of the natural frequencies, where the weights are given by an out-flow centrality measure that is equivalent to a reverse PageRank centrality. Our findings uncover an intricate dependence of the collective frequency on both the structural directedness and dynamical heterogeneity of the network, and also reveal an unexplored connection between synchronization and PageRank, which opens the possibility of applying PageRank optimization to synchronization. Finally, we demonstrate the presence of collective frequency variation in real-world networks by considering the UK and Scandinavian power grids.
I. INTRODUCTION
The emergence of synchronization in ensembles of dynamical units is a universal
phenomenon that is vital to the functionality of many natural and man-made systems [1–3]. In addition to the ability of the individuals that make up such systems to operate in unison, in many instances the particular frequency or velocity with which they evolve is crucial. For example, the sources and loads that make up power grids must reach consensus to avoid power failures, but reaching a common frequency alone is not enough; the system is most efficient near a certain reference frequency of approximately 50 – 60 Hz, and may fail if the collective dynamics are too far from this range [4, 5]. In a wide variety of disciplines, from
HHS Public Access
Author manuscript
Phys Rev E
. Author manuscript; available in PMC 2017 April 25.Published in final edited form as:
Phys Rev E. 2016 April ; 93: 042314. doi:10.1103/PhysRevE.93.042314.
A
uthor Man
uscr
ipt
A
uthor Man
uscr
ipt
A
uthor Man
uscr
ipt
A
uthor Man
uscr
biology and neuroscience to mechanical and electrical engineering, there are vital systems whose functionality is jeopardized if the collective frequency or velocity differs too much from a given reference frequency; examples include brain dynamics, cardiac excitation, consensus networks, and coordination of muscle movements in the digestive track [6–9]. In the case of cardiac excitation, for instance, rapid oscilations can give rise to dynamical instabilities that often precede ventricular fibrillation and eventually heart failure.
In the majority of works studying the dynamics of network synchronization, it is often assumed that the collective frequency of the synchronized state is precisely the mean natural frequency of the individual units [2, 3, 10]. In other words, the synchronized state reaches an oscillation frequency that is equal to the unweighted average of the oscillation frequencies of the individual elements when acting in isolation, i.e., uncoupled. In this Article we study the collective frequency of self-organizing systems of oscillators and show that it is not in general equal to the mean of the individuals’ natural frequencies. We find that collective frequency variation is a consequence of the directedness of network and heterogeneity of the dynamics. For networks lacking either, e.g., undirected networks or identical oscillators, we find that that the collective frequency does recover the mean oscillator frequency [11, 12]. Importantly, systems with directed connections and non-identical agents are ubiquitous [1], and therefore collective frequency variation is a fundamental–yet unexplored–property of real-world self-organizing systems [13, 14].
To investigate this phenomenon, we consider the general linearized dynamics of N coupled units, xi, for i = 1,…, N, given by
(1)
where ωi is the natural frequency of oscillator i, K is the global coupling strength, and L is
the network Laplacian matrix. The entries of L are defined , where Aij is the
network adjacency matrix and is the in-degree of node i. We also define the
out-degree of node i, . We assume the network encoded by A to be strongly-connected [15]. In principle, our analysis allows the network to be directed and weighted, although unless otherwise noted we will focus on the case of unweighted edges: Aij = 1 if a
directed link j → i exists, and otherwise Aij = 0. We note that there are several ways to
define a Laplacian matrix for directed networks [16]; we study a version that is appropriate for the dynamics of interest. These linearized dynamics represent a versatile description of a wide range of dynamical processes on networks [17, 18]. For instance, Eq. (1) can be obtained from linearizing self-organizing systems around the synchronized manifold, for instance the Kuramoto model which serves as a model for a wide range of synchronization phenomena including power grid dynamics [19, 20], as well as other systems with more general coupling which are utilized in modeling excitable-and reaction-diffusion-type systems [21–23]. This linear relaxation has been found to accurately capture the dynamics of
A
uthor Man
uscr
ipt
A
uthor Man
uscr
ipt
A
uthor Man
uscr
ipt
A
uthor Man
uscr
the system, provided that initial conditions are within the basin of attraction of the synchronized state [24]. In the case of a network of coupled oscillators, this tends to be particularly robust, capturing the dynamics provided that the overall coupling is not too small in comparison to the spread in the natural frequencies (which we illustrate in Sec. V).
We study the frequency-synchronized state, given by ẋ1 = ⋯= ẋN, and quantify the
collective frequency variation by examining Ω − 〈ω〉, where Ω denotes the collective frequency of the synchronized population and 〈ω〉 = N−1Σ
i ωi is the mean natural frequency.
We call this difference the collective frequency variation. We show that under generic conditions which are present in most practical application, when the frequencies ωi are
non-identical and the in- and out-degrees and are not perfectly balanced, then Ω − 〈ω〉 ≠
0. However, when the in- and out-degrees match for each node in the network, , then the collective frequency variation vanishes, i.e., Ω = 〈ω〉, for any choice of frequencies. We calculate the collective frequency variation directly from Eq. (1) and show that Ω − 〈ω〉 is given by a weighted average of the natural frequency vector, where the weights
correspond to entries of the first left singular vector u1 of L that is associated with the trivial singular value σ1 = 0. We find that u1 represents an out-flow centrality measure, and in fact
the entries of u1 are often well-approximated by the out-to-in-degree ratio, . Interestingly, the first-left-singular-vector centrality is a reverse analogue of Google’s PageRank centrality [25], which provides a cornerstone to Google’s ranking of webpages and favors nodes with strong in-flow [26]. These findings reveal an interesting and surprising link between synchronization dynamics and PageRank, paving a path for new theoretical exploration and the possibility of applying well-established PageRank methods to synchronization. We will also demonstrate the presence of collective frequency variation in real-world UK and Scandinavian power grid networks. However we emphasize that our findings fit in a much broader and more interdisciplinary framework.
The remainder of this Article is organized as follows. In Sec. II we derive the collective frequency variation of a network. In Sec. III we study the range of possible collective frequency variation for a given network structure. In Sec. IV we show that the weights that contribute to the collective frequency admit a centrality that is the reverse analogue of Google’s PageRank centrality. In Sec. V we study collective frequency variation in the power grid as a real example. In Sec. VI we conclude with a discussion of our results.
II. DERIVATION OF COLLECTIVE FREQUENCY VARIATION
We begin by writing Eq. (1) in vector form,
(2)
Our aim is to calculate the collective frequency of the synchronized population, and therefore we propose the ansatz
A
uthor Man
uscr
ipt
A
uthor Man
uscr
ipt
A
uthor Man
uscr
ipt
A
uthor Man
uscr
(3)
where x* is a vector encoding the steady-state value of each xi in an appropriate rotating frame, 1 = [1,…, 1]T, and Ω is the collective frequency. To proceed, we will utilize the pseudoinverse L† of the Laplacian matrix, which satisfies LL†L = L and L†LL† = L† [27]. In the undirected case, L† can be found using the eigenvalue decomposition of L, whereas in the more general case of a directed network, L† is formulated in terms of the singular value
decomposition (SVD) of L. In particular, if , where σj ≥ 0 are
the singular values which are ordered 0 = σ1 < σ2 ≤ ⋯ ≤ σN and make up the diagonal
entries of Σ, and uj and vjT are the corresponding left and right singular vectors that make up
the columns of U and V, respectively, then the pseudoinverse is given by
. An important distinction between L and L† is that, while
L maps all constant vectors to zero since its rows sum to zero, this is not generally true of
L†, whose nullspace is nontrivial. Furthermore, the sets of singular vectors and (appropriately normalized) each form an orthonormal basis for ℝN.
Proceeding with the analysis, we insert Eq. (3) into Eq. (2) and rearrange to obtain
(4)
Left-multiplying by LL†, and using that LL†L = L, we find
(5)
Equations (4) and (5) thus imply that
(6)
Next, since σ1 = 0, the matrix I − LL† can be simplified to u1u1T. Finally, we left-multiply
Eq. (6) by 1, rearrange, and subtract 〈ω〉 from the right- and left-hand sides to obtain
(7)
A
uthor Man
uscr
ipt
A
uthor Man
uscr
ipt
A
uthor Man
uscr
ipt
A
uthor Man
uscr
where 〈a, b〉 = aTy = Σi aibi denotes the inner product. This result is in good agreement with
previous research on consensus systems. In particular, by differentiating Eq. (2) with respect to time, using the initial condition ẋ(0) = ω − KLx(0), and noting that the first left singular vector and first left eigenvector are equal, we find that our derivation of Eq. (7) provides a complementary derivation of Eq. (23) in Ref. [28].
Equation (7) gives the collective frequency variation Ω − 〈ω〉 of a synchronized population as the projection of the natural frequency vector ω − 〈ω〉 1 (shifted to have zero mean) onto the first left singular vector u1. The physical interpretation of Eq. (7) is that the collective frequency variation is a weighted average of the natural frequencies, wherein the weights are proportional to the entries of u1. Thus, nodes with large entries in u1 contribute more to the collective frequency variation than those with small entries, allowing for non-zero values of Ω − 〈ω〉 provided that the entries of u1 are not identical. Furthermore, we can formulate the
full range of collective frequencies for a given network as the maximum of |Ω − 〈ω〉| over all choices of ω with some fixed variance. As we will show below, the first left singular vector
u1 induces a centrality measure for the network that is related to the out-flow of each node. Interestingly, we will show that this centrality is analogous to a “reverse” PageRank. In fact, it is equivalent to Google’s PageRank centrality for the network obtained by reversing the direction of each link in the original network.
III. RANGE OF COLLECTIVE FREQUENCY VARIATION
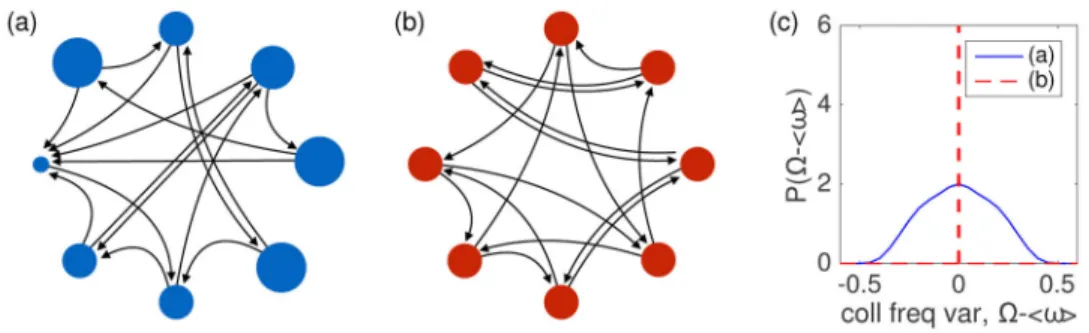
We demonstrate our main result, Eq. (7), with a simple example using two small networks of size N = 8, which are illustrated in Fig. 1(a) and (b). Both networks contain 16 links, yielding a mean in- and out-degree of 〈k〉 = 2; however, in network (a) the links are made randomly so the in-and out-degrees at each node are not necessarily equal, while network (b)
is balanced so that the links are made to satisfy for all i, but is still directed. For
visual distinction, each node’s area is proportional to the out-to-in-degree ratio . Next, we draw a set of normally distributed natural frequencies with mean 〈ω〉 = 0 and variance σ2 = 1 and calculate for each network the collective frequency variation Ω − 〈ω〉
using Eq. (7) for 104 different permutations of these frequencies. In Fig. 1(c), we plot the observed density P (Ω − 〈ω〉) for networks (a) and (b) (solid blue and dashed red,
respectively). In the generic case, network (a), where in- and out-degrees are not necessarily equal at each node, we observe a wide range of collective frequencies, while for network (b),
where the balance is maintained, the collective frequency is zero in each case, resulting in a delta function P (Ω − 〈ω〉) = δ(Ω − 〈ω〉). This example highlights two important properties. First, the collective frequency variation is intimately linked with the
directedness of a network: once the balance is broken, a non-zero value of Ω − 〈ω〉 should be expected. Second, the precise value of Ω − 〈ω〉 depends not only on the network and set of natural frequencies, but the arrangement of natural frequencies (dynamical heterogeneity) on the network. Therefore, for a fixed network and set of oscillator frequencies, depending on how the oscillators are assigned on the network, the system’s collective frequency may either be faster or slower than the mean frequency.
A
uthor Man
uscr
ipt
A
uthor Man
uscr
ipt
A
uthor Man
uscr
ipt
A
uthor Man
uscr
A natural question to ask of a given network is: What is the range of possible collective frequency variations? We formalize this by considering for a given network, the magnitude of the maximum collective frequency variation across all frequency vectors with fixed variance σ2, i.e., max
var(ω)=σ2 |Ω − 〈ω〉|. Inspecting Eq. (7), it is straight-forward to see that
the collective frequency variation is maximized when the shifted natural frequency vector ω − 〈ω〉 1 is aligned with the first left singular vector u1. Thus, the choices of ω that maximize
|Ω − 〈ω〉| with mean 〈ω〉 and variance σ2 are precisely
(8)
where and the + and − symbols correspond to maximizing and minimizing Ω − 〈ω〉, respectively (that is, assuming for each i). This yields a collective frequency variation range of
(9)
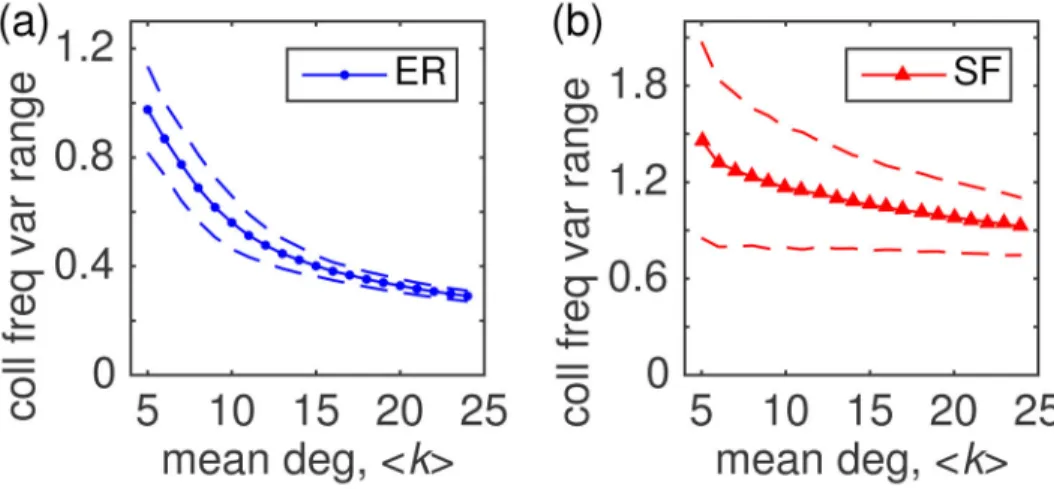
To investigate how the range of collective frequency variation depends on network structure, we consider a variety of Erdős-Rényi [29] (ER) and scale-free (SF) networks. ER networks are constructed using a link probability p that describes the probability of directed link j → i existing. SF networks are built using the configuration model [30] for target in- and out- degrees drawn from the distribution P(k) ∝ k−γ for k ≥ k
0, where k0 is an enforced minimum
degree. The mean degree for ER and SF networks can be tuned according to 〈k〉 = (N − 1)p and 〈k〉 = (γ − 1)k0/(γ − 2), respectively. In our experiment, we fix γ = 3 and construct
networks of size N = 200 with various mean degrees and compute the collective frequency range according to Eq. (9) with σ2 = 1. In Fig. 2(a) and (b), we plot the results for over 1000
ER and SF network realizations, respectively; we denote the mean and standard deviations using the symbols and dashed curves, respectively. For both network families, the collective frequency variation range tends to increase as the networks become more sparse. The central difference we observe is that both the mean collective frequency variation range and its standard deviation tend to be larger for SF networks than for ER networks. This suggests that structural heterogeneity has an amplifying effect on the range of collective frequency variation for a network – however this effect can be mitigated on average by saturating the network structure: as the average connectivity increases, the range of collective frequency variation diminishes.
To better understand the role of network structure in determining collective frequency variation, we ask the following: For which network structures is the collective frequency variation exactly zero? That is, which network structures yield Ω − 〈ω〉 = 0 regardless of the choice of ω? From Eq. (7), it follows that Ω − 〈ω〉= 0 for any ω whenever the entries of u1
are all identical, i.e., u1 ∝ 1. We note that since L = Din − A, where ,
A
uthor Man
uscr
ipt
A
uthor Man
uscr
ipt
A
uthor Man
uscr
ipt
A
uthor Man
uscr
and σ1 = 0, then u1 must satisfy , or equivalently u1 is the leading right
eigenvector of . At each entry, we must have , and therefore by inserting u1 = c1 (for any c ≠ 0) it is easy to see then that u1 ∝ 1 implies that the network
must be degree-balanced, i.e., for all i. The converse follows from a simple application of the Perron-Frobenius theorem [31]. Specifically, u1 ∝ 1 is a solution of the leading right eigenvalue equation for , and the Perron-Frobenius theorem implies that it is in fact the unique solution, provided that the network is strongly connected. Therefore, any given network generically has zero collective frequency variation if and only
if for all i.
IV. SINGULAR VECTOR CENTRALITY AND GOOGLE’S PAGERANK
Given the non-uniformity of each oscillator’s contribution to a network’s collective frequency variation, we now turn our attention to the properties of the first left singular vector u1, which dictates the contribution of each oscillator to the collective frequency variation. First, we note that the entries are positive, and thus u1 induces a centrality
measure for the network. The positiveness of the entries follows from applying the
Perron-Frobenious theorem [31] to the irreducible and non-negative matrix and noting that
u1 is the leading right eigenvector of the matrix. The role of u1 as the leading right eigenvector of also elucidates its structural properties. In particular, Google’s PageRank centrality – which tends to favor nodes with strong in-flow – is given by the
leading right eigenvector v of the matrix , where
and q ∈ [0, 1) is a damping factor [26]. Formally the PageRank of a network represents the steady-state of a Markovian random-walk on the network. When the damping factor is set to zero and each directed link is reversed, the matrix M from which
PageRank is calculated is equal to (for which u1 is the leading right eigenvector). Thus, the centrality induced by the first left singular vector represents a reverse PageRank, i.e., the steady-state of a Markovian random walk on the network with each link reversed.
To provide further insight into the structure of u1, we consider instead , where is the field counterpart to A. In particular, the corresponding
mean-field approximation of u1, which satisfies , is precisely
(10)
where is a normalizing factor. Thus, the centrality induced by u1 can be approximated by the out-to-in-degree ratio – a local indicator of the out-flow
at a given node. In Fig. 3(a), we plot the entries vs for an ER network of size N = 200 with p = 0.2, and we denote the mean field approximation given by Eq. (10) with a
A
uthor Man
uscr
ipt
A
uthor Man
uscr
ipt
A
uthor Man
uscr
ipt
A
uthor Man
uscr
dashed black line. In Fig. 3(b), we compare the centrality induced by u1 to PageRank centrality induced by v; we plot the entries vi vs for both a damped case (q = 0.15) and the
undamped case (q = 0) in red triangles and blue dots, respectively. The black curve indicates an approximate inverse relationship between the entries of v and u1. Specifically, we use an approximation similar to the derivation of ũ1 to find , which implies that the
mean field approximations satisfy
(11)
where the right-hand side is a constant. The strong agreement between Eq. (11) and the actual entries of u1 and v illustrates the strong and opposite relationship between the centrality induced by the first left singular vector u1 and PageRank v.
This relationship between synchronization and PageRank that is revealed by the collective frequency variation of a network represents a new direction for network analysis and, immediately, the potential for applying PageRank-based techniques to self-organizing networks. PageRank and random walker dynamics remains one of the most popular topics of research connecting various disciplines, and has a rich literature [32]. Specifically, various algorithms and techniques exist for analysis and optimization which might be applied to manipulate a network’s collective frequency variation. For instance, given the inverse relationship between the first left singular vector centrality and PageRank, we expect that increasing (decreasing) a node’s PageRank corresponds to decreasing (increasing) its contribution to the collective frequency variation.
V. POWER GRID DYNAMICS
The power grid represents a prime example of a network of self-organizing dynamical systems whose functionality we rely on everyday – without robust synchronization near a specified range (~ 50–60 Hz), our power supply is jeopardized. Power grids [33] are widely modeled using the following system of second-order differential equations:
(12)
where θi represents the mechanical phase of oscillator i, Hi and Ci represent the inertial and
damping constants, respectively, Pi represents the generated or consumed power of oscillator
i, K is the global coupling strength, and αij is a phase-lag parameter for the interaction
between oscillators i and j. Although the adjacency matrix A is taken to be undirected, the presence of heterogeneity in the damping coefficients yields an effective directedness in the network coupling. Specifically, dividing Eq. (12) through by Ci and linearizing around the
synchronized state θ̇= ⋯= θ̇N, where we expect θ1 ≈ ⋯ ≈ θN, yields the system
A
uthor Man
uscr
ipt
A
uthor Man
uscr
ipt
A
uthor Man
uscr
ipt
A
uthor Man
uscr
(13)
where the new Laplacian L̃ is defined , where Aij = Aij cos αij/Ci,
, Hi = Hi/Ci, ω̃j = (Pi − KΣj Aij sin αij)/Ci. Note in particular that the effective
coupling matrices are directed, i.e., L̃T ≠ L̃ and ÃT ≠ Ã. Different power grid models treat the inertial term in Eq. (12) differently [33]. In certain models the inertial term Hi depends
on the role of oscillator i: if oscillator i is a source, or power generator, Hi is nonzero, but if
it is a load, or power consumer, Hi is zero and thus the equation for oscillator i is a
first-order differential equation. Some models treat all Hi’s as non-zero, resulting in a full system
of second-order differential equations, and others treat all Hi’s as zero, resulting in a full
system of first-order differential equations. We note that regardless of the treatment of the inertial terms, in the synchronized state θ̈i holds for all i, and therefore the collective
frequency of the synchronized state is preserved, and thus Eq. (7) holds.
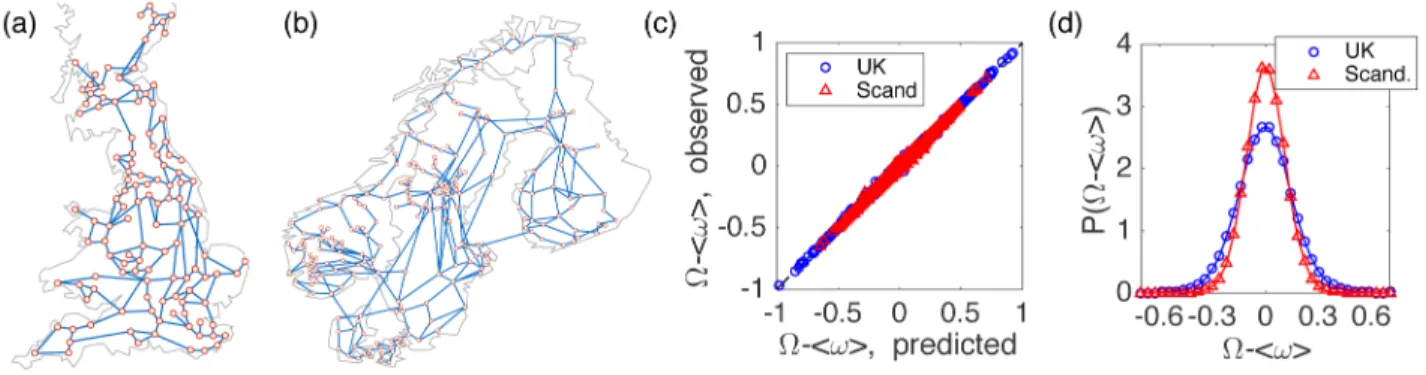
To demonstrate the presence of collective frequency variation in a real-world setting, we consider the power grid model in Eq. (12) on empirical power grids. Specifically, we consider course-grain versions of the UK and Scandinavian power grids [4, 34, 35], which we illustrate in Fig. 4(a) and (b), respectively, and which consist of N = 119 and 236 nodes and M = 165 and 320 links, respectively. It is well-known that in real-world power grids the power Pi of sources and loads are positive and negative with respect to their mean, and
damping coefficients are all positive, and with an appropriate rescaling of time can be set to have mean one [36]. Therefore, we draw each Pi from the bimodal normal distribution
and each Ci from the gamma distribution
g(C) = ααCα−1e−αC/Γ(α). For simplicity, inertial coefficients H
i and phase lags αij are all
set to zero. We simulate Eq. (12) using K = 3, , σ = 1/2, and α = 4 on both the UK and Scandinavian power grid networks, calculating the collective frequency variation Ω − 〈ω〉 from direct observation, and compare to the theoretical prediction of Eq. (7) given Eq. (13) in Fig. 4(c) for 50, 000 realizations of the parameters Pi and Ci. The dashed black curve (which is almost completely covered) underscores perfect agreement. In Fig. 4(d) we plot the distribution of collective frequencies found in the 50, 000 trials on each network, demonstrating that collective frequency variation can be a significant effect in important, real-world networks such as power grids. Furthermore, our numerical exploration indicate that by appropriately adding and/or deleting links, the collective frequency variation can be either amplified or mitigated, suggesting that the collective frequency variation could be tuned with a collection of judiciously chosen perturbations to the network structure.
VI. DISCUSSION
In this Article, we have studied the collective frequency of self-organizing systems in general directed networks. In particular, we have shown that in generic directed networks the collective frequency variation is nonzero and is given by a weighted average of the natural
A
uthor Man
uscr
ipt
A
uthor Man
uscr
ipt
A
uthor Man
uscr
ipt
A
uthor Man
uscr
frequencies. In other words, the collective frequency of the synchronized state is not equal to the mean of the oscillators’ individual natural frequencies. The weights that determine the collective frequency variation are associated with the left singular vector u1 of the Laplacian matrix L corresponding to the singular value σ1 = 0. This formalism allows us to define and
calculate the full range of collective frequency variations possible for any given network. We have shown that the only networks with generically zero collective frequency variation are degree-balanced networks in which the in- and out-degrees match for every node (i.e.,
).
We have found that the first left singular vector in fact induces a centrality measure on the network. This centrality is intimately linked with the directedness of the network and measures an effective out-flow at each node. Interestingly, we have found that this centrality is a reverse analogue of PageRank centrality [25]; PageRank is a cornerstone to Google’s ranking of webpages and is well-known to quantify the in-flow at each node [26]. Moreover, we have shown that the mean field approximations to the first-left-singular-vector centrality and the PageRank centrality are precisely the inverse of one another.
We believe that these results will have significant impact on the study of self-organizing processes on networks, since in many application the collective dynamics of the
synchronized state, i.e., the collective frequency, plays an important role in the functionality of the system. As a prime example we have considered the dynamics of two real-world power grids – a particularly important complex network of oscillators (i.e., sources and loads) that governs the flow of energy [37]. In particular, power grids must synchronize to avoid power failures, but must also evolve close enough to a reference frequency of approximately 50 – 60 Hz [36]. We have demonstrated that, despite the fact that power grid networks are structurally undirected, dynamical heterogeneity yields an effectively directed network structure, and therefore allows significant collective frequency variation. However, we emphasize that our results have broader applications than just power grid dynamics. In fact, the collective frequency of an ensemble plays a crucial roll in the functionality of a wide range of systems from disciplines including biology, neuroscience, and engineering. Examples of systems whose functionality can be compromised if the collective frequency differs too much from a given reference include oscillations of brain waves, propagation of activity through cardiac tissue, consensus in sensor networks, and the coordination of muscle contractions in the digestive track [8, 9, 38, 39].
Moreover, these results demonstrate a novel relationship between a widely used topological quantity used to rank the importance of nodes and the dynamical process of synchronization. The implications point towards a new method of ranking nodes using synchronization – a notion consistent with other findings where synchronization can be utilized to uncover topological properties of networks [40]. A particularly interesting finding is the link between the synchronization dynamics of a network ensemble and the role of PageRank in
determining each oscillator’s contribution to the collective frequency. This link opens the possibility for analysis and optimization of the synchronization properties of networks using PageRank – a topic with a large body of literature and well-established algorithms for optimization [32]. In particular, we expect that pre-existing methods for optimizing the
A
uthor Man
uscr
ipt
A
uthor Man
uscr
ipt
A
uthor Man
uscr
ipt
A
uthor Man
uscr
PageRank in networks can be applied to manipulate the collective frequency of generic various oscillator networks.
Acknowledgments
We thank M. Timme for the UK and Scandinavian power grid networks. DT acknowledges support from NIH Award Number R01HD075712. JS acknowledges funding from the Simons Foundation Grant No. 318812 and the Army Research Office Grant No. W911NF-12-0276. AA acknowledges support by the European Commission FET-Proactive project MULTIPLEX (Grant No. 317532), the ICREA Academia, the James S. McDonnell Foundation, and by FIS2015-71582-C2-1.
References
1. Strogatz, SH. Sync: the Emerging Science of Spontaneous Order. Hypernion; New York: 2003. 2. Pikovsky, A.; Rosenblum, M.; Kurths, J. Synchronization: A Universal Concept in Nonlinear
Sciences. Cambridge University Press; 2003.
3. Arenas A, Díaz-Guilera A, Kurths J, Moreno Y, Zhou C. Synchronization in complex networks. Phys Rep. 2008; 469:93–153.
4. Rohden M, Sorge A, Timme M, Witthaut D. Self-organized synchronization in decentralized power grids. Phys Rev Lett. 2012; 109:064101. [PubMed: 23006269]
5. Motter AE, Myers SA, Anghel M, Nishikawa T. Spontaneous synchrony in power-grid networks. Nat Phys. 2013; 9:191–197.
6. Antzoulatos EG, Miller EK. Increases in functional connectivity between the prefrontal cortex and striatum during category learning. Neuron. 2014; 83:216–225. [PubMed: 24930701]
7. Karma A, Gilmour RF. Nonlinear dynamics of heart rhythm disorders. Phys Today. 2007; 60:51–57. 8. Olafti-Saber R, Fax JA, Murray RM. Consensus and cooperation in networked multi-agent systems.
Proc IEEE. 2007; 95:215–233.
9. Aliev RR, Richards W, Wikswo JP. A simple nonlinear model of electrical activity in the intestines. J Theor Biol. 2000; 7:21–28.
10. Kuramoto, Y. Chemical Oscillations, Waves, and Turbulence. Springer; New York: 1984. 11. Ott E, Antonsen TM. Low dimensional behavior of large systems of globally coupled oscillators.
Chaos. 2008; 18:037113. [PubMed: 19045487]
12. Restrepo JG, Ott E, Hunt BR. Onset of synchronization in large networks of coupled oscillators. Phys Rev E. 2005; 71:036151.
13. Restrepo JG, Ott E, Hunt BR. Synchronization in large directed networks of coupled phase oscillators. Chaos. 2006; 16:015107. [PubMed: 16599773]
14. Assenza S, Gutiérrez R, Gómez-Gardeñes J, Latora V, Boccaletti S. Emergence of structural patterns out of synchronization in networks with competitive interactions. Sci Rep. 2011; 1:00099. 15. Newman MEJ. The structure and function of complex networks. SIAM Rev. 2003; 45:167–256. 16. Chung F. Laplacians and the Cheeger inequality for directed graphs. Ann Comb. 2005; 9(1):1–19. 17. Grabow C, Grosskinsky S, Timme M. Small-world spectra in mean-field theory. Phys Rev Lett.
2012; 108:218701. [PubMed: 23003310]
18. Grabow C, Grosskinsky S, Kurths J, Timme M. Collective relaxation dynamics of small-world networks. Phys Rev E. 2015; 91:052815.
19. Dörfler F, Chertkov M, Bullo F. Synchronization in complex oscillator networks and smart grids. Proc Natl Acad Sci. 2013; 110:2005–2010. [PubMed: 23319658]
20. Skardal PS, Arenas A. Control of coupled oscillator networks with application to microgrid technologies. Sci Adv. 2015; 1:e1500339. [PubMed: 26601231]
21. Kopell, N.; Ermentrout, GB. Handbook of Dynamical Systems II. Fiedler, B., editor. Vol. 2. Elsevier; New York: 2002. p. 3-54.
22. Skardal PS, Taylor D, Sun J. Optimal synchronization of complex networks. Phys Rev Lett. 2014; 113:144101. [PubMed: 25325646]
A
uthor Man
uscr
ipt
A
uthor Man
uscr
ipt
A
uthor Man
uscr
ipt
A
uthor Man
uscr
23. Skardal PS, Taylor D, Sun J, Arenas A. Erosion of synchronization in networks of coupled oscillators. Phys Rev E. 2015; 91:010802(R).
24. Menck PJ, Heitzig J, Marwan N, Kurths J. How basin stability complements the linear-stability paradigm. Nat Phys. 2013; 9:89–92.
25. Brin S, Page L. The anatomy of a large-scale hypertextual Web search engine. Computer Networks and ISDN Systems. 1998; 30:107–117.
26. Gleich DF. PageRank beyond the web. SIAM Rev. 2015; 57:321.
27. Ben-Israel, A.; Grenville, TNE. Generalized Inverses. Springer; New York: 1974.
28. Olafti-Saber R, Murray RM. Consensus problems in networks of agents with switching topology and time-delays. IEEE Trans Autom Control. 2004; 49:1520–1533.
29. Erdős P, Rényi A. On the evolution of random graphs. Publ Math Inst Hung Acad Sci. 1960; 5:17– 61.
30. Molloy M, Reed B. A critical point for random graphs with a given degree sequence. Random Struct Algor. 1995; 6:161–180.
31. MacCluer CR. The many proofs and application of Perron’s theorem. SIAM Rev. 2000; 42:487– 498.
32. Langville, AN.; Meyer, CD. Google’s PageRank and Beyond: The Science of Search Engine Rankings. Princeton University Press; 2006.
33. Nishikawa T, Motter AE. Comparative analysis of existing models for power-grid synchronization. New J Phys. 2015; 17:015012.
34. Simonsen I, Buzna L, Peters K, Bornholdt S, Helbing D. Transient dynamics increasing network vulnerability to cascading failures. Phys Rev Lett. 2008; 100:218701. [PubMed: 18518644] 35. Witthaut D, Rohden M, Zhang X, Hallerberg S, Timme M. Critical links and nonlocal rerouting in
complex supply networks. Phys Rev Lett. 2016; 116:138701. [PubMed: 27082006]
36. Lozano S, Buzna L, Díaz-Guilera A. Role of network topology in the synchronization of power systems. Euro Phys J B. 2012; 85:231–238.
37. Dörfler F, Bullo F. Synchronization and transient stability in power networks and non-uniform Kuramoto oscillators. SIAM J Control Optim. 2012; 50:1616–1642.
38. Schnitzler A, Gross J. Normal and pathological oscillatory communication in the brain. Nat Rev Neurosci. 2005; 6:285–296. [PubMed: 15803160]
39. Karma A. Physics of cardiac arrhythmogenesis. Annu Rev Condens Matter Phys. 2013; 4:313–337. 40. Arenas A, Díaz-Guilera A, Pérez-Vicente CJ. Synchronization reveals topological scales in
complex networks. Phys Rev Lett. 2006; 96:114102. [PubMed: 16605825]
A
uthor Man
uscr
ipt
A
uthor Man
uscr
ipt
A
uthor Man
uscr
ipt
A
uthor Man
uscr
FIG. 1. Collective frequency variation
(a),(b) Two networks of size N = 8 with 16 links. In (b), the in- and out-degrees match at
each node, in particular . In (a) this balance is broken, so . Each node’s
area is proportional to the ratio , which represents a mean field approximation to the first left singular vector u1 of the Laplacian matrix L. (c) The density P (Ω) of collective frequencies Ω observed in networks (a) and (b) (solid blue and dashed red, respectively) for different permutations of a normally distributed frequency vector ω with mean 〈ω〉 = 0 and variance σ2 = 1. We find Ω to relate closely to the alignment of ω with vector u1, which
represents an out-flow centrality.
A
uthor Man
uscr
ipt
A
uthor Man
uscr
ipt
A
uthor Man
uscr
ipt
A
uthor Man
uscr
FIG. 2. Range of collective frequency variation
For (a) ER and (b) SF networks of size N = 200 and various mean degrees, the collective frequency variation range maxvar(ω)=σ2 |Ω − 〈ω〉| for σ2 = 1.
A
uthor Man
uscr
ipt
A
uthor Man
uscr
ipt
A
uthor Man
uscr
ipt
A
uthor Man
uscr
FIG. 3. First-left-singular-vector centrality and PageRank
(a) Entries of the first left singular vector vs the out-to-in-degree ratio for an ER network of size N = 200 and p = 0.1. (b) The relationship between PageRank entries vi (damped and undamped cases are plotted with red triangles and blue dots, respectively) and first-left-singular-vector entries for the same network. The expected inverse relationship
. is plotted as a black curve.
A
uthor Man
uscr
ipt
A
uthor Man
uscr
ipt
A
uthor Man
uscr
ipt
A
uthor Man
uscr
FIG. 4. Collective frequency variation in power grid networks
(a),(b) Course-grain representations of the UK and Scandinavian power grids, respectively. (c) Collective frequency variation Ω − 〈ω〉 as observed from direct simulations of the power grid model given by Eq. (12) on the UK and Scandinavian power grid networks compared to the theoretical prediction of Eq. (7) given Eq. (13) in 50, 000 realizations. Parameters Pi and
Ci are drawn from a bimodal normal distribution and a gamma distribution with mean one,
respectively, as described in the text. (d) Distribution of collective frequency variation found for each network.