Sheng Yang,1,2 Stefano Valenti,1 Enrico Cappellaro,2 David, J. Sand,3
and
Leonardo Tartaglia,3,1 Alessandra Corsi,4 Daniel E. Reichart,5
and
Joshua Haislip,5 Vladimir Kouprianov5
Received ; accepted
ApJL, 851, 2.
1Department of Physics, University of California, 1 Shields Avenue, Davis, CA
95616-5270, USA
2INAF Osservatorio Astronomico di Padova, Vicolo dellOsservatorio 5, I-35122 Padova,
Italy
3Department of Astronomy/Steward Observatory, 933 North Cherry Avenue, Room
N204, Tucson, AZ 85721-0065, USA
4Physics & Astronomy Department, Texas Tech University, Lubbock, TX 79409, USA
0000-0003-3433-1492
5Department of Physics and Astronomy, University of North Carolina at Chapel Hill,
Chapel Hill, NC 27599, USA
ABSTRACT
Binary neutron star mergers are important to understand stellar evolution,
the chemical enrichment of the universe via the r-process, the physics of short
gamma-ray bursts, gravitational waves and pulsars. The rates at which these
co-alescences happen is uncertain, but it can be constrained in different ways. One
of those is to search for the optical transients produced at the moment of the
merging, called a kilonova, in ongoing SN searches. However, until now, only
the-oretical models for kilonovae light curve were available to estimate their rates.The
recent kilonova discovery AT 2017gfo/DLT17ck gives us the opportunity to
con-strain the rate of kilonovae using the light curve of a real event. We concon-strain the
rate of binary neutron star mergers using the DLT40 Supernova search, and the
native AT 2017gfo/DLT17ck light curve obtained with the same telescope and
software system. Excluding AT 2017gfo/DLT17ck due to visibility issues, which
was only discovered thanks to the aLIGO/aVirgo trigger,no other similar
tran-sients detected during 13 months of daily cadence observations of∼2200 nearby
(<40 Mpc) galaxies. We find that the rate of BNS mergers is lower than 0.47
-0.55 kilonovae per 100 years per 1010 LB (depending on the adopted extinction
distribution). In volume, this translates to < 0.99×10⁻⁴ +0.19
−0.15,Mpc
−3yr−1(SNe
Ia-like extinction distribution), consistent with previous BNS coalescence rates.
Based on our rate limit, and the sensitivity of aLIGO/aVirgo during O2, it is
very unlikely that kilonova events are lurking in old pointed galaxy SN search
datasets.
1. Introduction
Binary neutron star (BNS) systems (Hulse & Taylor 1975) have been studied with
great interest by the astronomical community because of their connection with many open
problem of astrophysics, from short GRB to r-process element production, from the physics
of very high density matter to gravitational waves. The number of known BNS today is
limited to a dozen systems (Lattimer 2012) and the rate of BNS coalescences is known
with order of magnitudes of uncertainty(Coward et al. 2012; Petrillo et al. 2013; Scolnic
et al. 2017; Fong et al. 2015; de Mink & Belczynski 2015; Dominik et al. 2015; Vangioni
et al. 2016; Kim et al. 2015; Abadie et al. 2010; Abbott et al. 2017a; Jin et al. 2015; Drout
et al. 2014; Berger et al. 2013). The rate of BNS coalescences can be constrained from the
population of galactic pulsars (Kalogera et al. 2004), from modeling the evolution of binary
system (de Mink & Belczynski 2015; Dominik et al. 2015), from the cosmic abundance of
r-process elements (Vangioni et al. 2016) or measuring the rate of short Gamma-Ray Bursts
(GRBs), most likely produced at the moment of the coalescence (Berger et al. 2013).
An alternative method to constrain the rate of BNS mergers is to constrain the rate
of kilonovae detected in supernova (SN) search surveys. Kilonovae are thought to be the
ubiquitous, isotropically emitting counterparts to neutron star mergers. They are expected
to eject at very high velocity a small mass (0.01-0.05 Msun) mainly made of high opacity
r-process heavy elements, hence are predicted to have a ‘red’ spectrum, to be faint at
maximum light (MV ∼ −16 mag) and declining quickly over the course of 1-2 weeks(e.g.
Metzger et al. 2010; Piran et al. 2013; Kasen et al. 2013). This is in contrast to the most
common SNe, which evolve of 0−100 day timescales (e.g. see Figure 1.1 of Kasliwal et al.
2011).
One clear hindrance to calculate the kilonova rate has been the lack of observed
transients searches. Some progress has been made by using theoretical kilonova light curves
to calculate the upper limit of their rate in programs like the Dark Energy Survey (Doctor
et al. 2017). Additionally, there have been several recent attempts to estimate the rate of
fast optical transients that evolve on sub-day timescales (τ ∼ 0.5 hours to 1 day; Berger
et al. 2013) all the way up to ∼10 day timescales (Drout et al. 2014).
With the discovery of AT 2017gfo (Abbott et al. 2017a,b), we can directly constrain the
rate of kilonovae by using its light curve as a templatewhile allowing for possible diversity
in kilonova light curves and a range of extinction values. Here we present the rate estimate
for kilonovae using our observed light curve of AT 2017gfo and the data from the ongoing
Distance less then 40 Mpc (DLT40) Supernova search (Tartaglia et al. 2017). DLT40 is a
SN search that points galaxies within D . 40 Mpc with a one day cadence 1. Given the
magnitude limit of the program (r∼19 mag) DLT40 is well suited to detect nearby kilonova
event.An advantage of DLT40, is that we can directly use the light curve of AT 2017gfo
obtained with the same instrumental set-up(Valenti et al. 2017) to get a direct limit for
similar transients in the DLT40 program.
This letter is organized as follows. In Section 2 we describe the DLT40 search and the
survey operation during the O2 run. In Section 3 we will highlight the steps necessary
to measure the rates, while in Section 4, we will compare our results with previous
rate estimates and discuss the future prospects on how the improve the rates with or
independently from LIGO/Virgo next observing run.
2. The DLT40 search
DLT40 is a one-day cadence2 search for SNe, targeting galaxies in the nearby universe
(D .40 Mpc) and designed for the goal of discovering ∼10 SNe per year within one day
of explosion (Tartaglia et al. 2017). Running continuously since September 2016, DLT40 is
observing∼400-600 galaxies every night using a 0.41 m PROMPT telescope (Reichart et al.
2005) at the Cerro Tololo Inter-American Observatory (CTIO).
With a field of view (FoV) of 10×10 arcmin2, DLT40 is suitable to map nearby
galaxies down to a limiting magnitude of r ∼ 19 mag in 45 s unfiltered exposures. The
DLT40 catalog includes galaxies from the Gravitational Wave Galaxy Catalogue (GWGC;
White et al. 2011) at declination <20 degrees, with an absolute magnitude MB <−18 mag,
galactic extinction AV <0.5 mag and recessional velocity vr <3000 km s−1 (corresponding to D . 40 Mpc). An additional constraint is that the field of view should not include
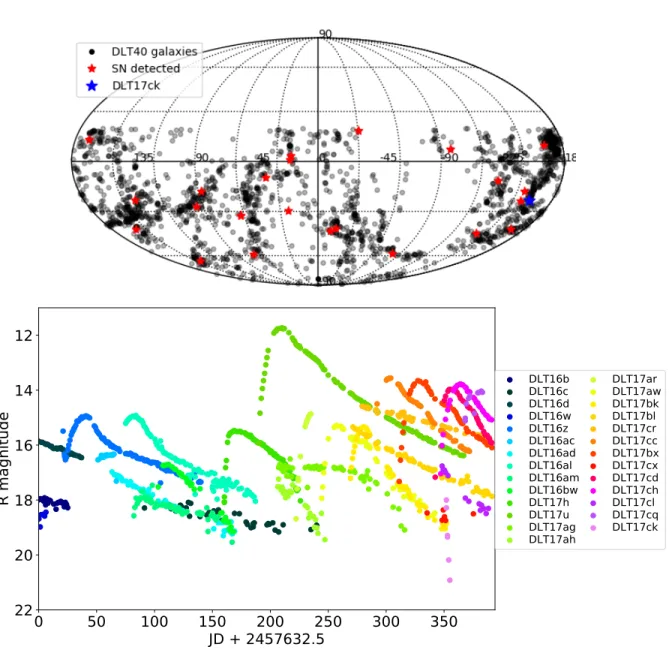
stars brighter than 8th mag. These selections led to a sample of 2220 bright galaxies. In
Figure 1, we show the sky distribution of galaxies in the DLT40 catalog. By comparing
the integrated luminosity of DLT40’s galaxy sample with the total integrated luminosity
of the GWGC catalog, we estimated that the DLT40 catalog contains ∼60% of the total
luminosity (and therefore roughly mass) of the GWGC catalog. Notice that the GWGC is
supposed to be complete out to 40 Mpc (White et al. 2011). The DLT40 galaxy catalog is
not biased with respect to morphological type of galaxy (Sheng et al. in preparation) but
by construction it is biased against low luminosity galaxies (for example dwarf galaxies).
In order to find SNe within a day from explosion, the DLT40 data are processed in
2This is the goal however the reader should be aware that weather losses and technical
problems may randomly affect our cadence of observations. As an example, during the first
nearly real time. Pre-reduced images are transferred within ∼ 1 minute to our dedicated
server where new candidates are detected by image subtraction with respect to a template
image (using Hotpants Becker 2015), so that new candidates are available for scanning
by human operator within a few minutes after acquisition. Confirmation images of new
SN candidates are taken within a few hours of their DLT40 discovery, often with the Las
Cumbres Observatory telescope network (Brown et al. 2013).
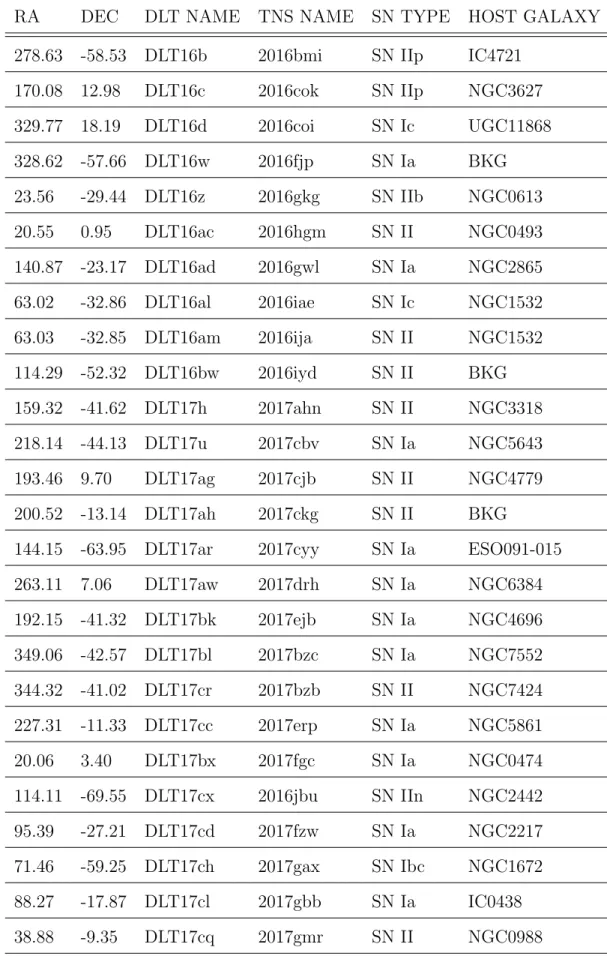
Since the beginning of the search (September 2016), we have discovered 26 SNe, twelve
of which were first announced by DLT40. Seven were discovered within 48 h of explosion
(see Table 2 for a list of transients discovered by DLT40). The late discovery of the
remaining transients by DLT40 was due to poor weather conditions.
While searching for SNe, DLT40 also reacted to LIGO/Virgo triggers during the O2
observing run, prioritizing the galaxies from the DLT40 catalog within the LIGO/Virgo
localization region for each trigger. Following the LIGO/Virgo trigger of GW170817
(Collaboration 2017a,b), DLT40 independently discovered and monitored the evolution
of the kilonova AT 2017gfo/DLT17ck (Valenti et al. 2017). Given the daily cadence of
the search, DLT40 is well suited to discover similar fast kilonova-like transients. In the
particular case of DLT17ck, we did have to revise our target priority list because the GW
localization placed it near the horizon at sunset in Chile. During the course of the normal
survey, however, any other kilonova-like transient would have been visible in the DLT40
search fields, given that DLT17ck itself was ∼1.5 magnitudes brighter than our typical
3. Rate Measurement
One approach to measuring the rate of an astronomical transient makes use of the
control time concept (Zwicky 1942; Cappellaro et al. 1993, 1997). For eachi-th galaxy, the
control time (cti) is defined as the time during which a hypothetical transient is above the
detection limit. It depends on the magnitude limit of each observation and the light curve
of the transient. The total control time per unit luminosity of our search is computed by
multiplying the cti control time by the luminosity of the i-th galaxy, and then summing
over all of the galaxies in our sample:3
ct= n
X
i=1
Li∗cti
The ratio between the number of transients detected and the sum of the control times
for all galaxies observed gives immediately the rate as:
r = N
ct
In order to measure the control time, the first step is evaluate the transient detection
efficiency for each image or, in other words, to measure the apparent magnitude limit for
transient detection. In order to do that, we performed artificial star experiments for a
subset of frames, implanting stars with different magnitudes using the proper point-spread
functions (PSFs), and registering the fraction of artificial stars automatically identified by
our pipeline on the difference images.
3The control time ct
i depends also on the absolute magnitude of the transient (brighter
transients will remain visible for a longer time above threshold). To account for the transient
luminosity function, we use a monte carlo approach, simulating a number of transients for
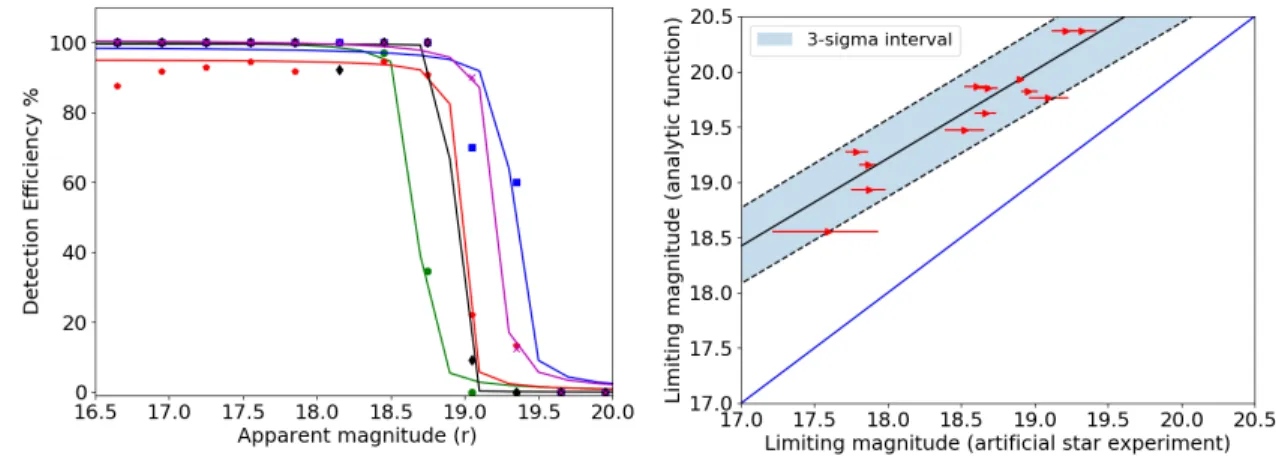
Hereafter we will adopt the magnitude corresponding to a 50% detection efficiency as
the limiting magnitude for the DLT40 survey, while we use the 16% and 84% detection
efficiencies as lower/upper limits to determine its uncertainty. We found that the magnitude
limit of our search is in the rangeMr ∼18−20 mag (see left panel of Figure 2) depending on
weather and seeing conditions of the specific observation. Since artificial star experiments
are time consuming, instead of repeating the simulation for all of the ∼ 120,000 frames
observed so far, we exploited a linear relation between the limiting magnitude for transient
detection computed through artificial star experiments and the limiting magnitude for
stellar source detection computed for each target frame (i.e. not the difference image).
The latter was derived through an analytic equation using information on the noise
and photometric calibration for each image. The comparisons between the two limiting
magnitudes is shown in the right panel of Figure 2. In general, the limiting magnitude
computed with the analytic function on the target image (y axes) is ∼1 magnitude deeper
than the limit magnitude from artificial stars experiment (x axes). This is expected since
the difference imaging technique effectively adds the template image noise to that of the
target image.
The second ingredient to measure the control time is simulation of kilonova light
curves in the time window each galaxy was observed. The time that the transient is
above our detection limit contributes to the control time. The observed light curve of
AT 2017gfo/DLT17ck was used as a reference, scaled to the distance of each galaxy with an
explosion epoch randomly distributed in the observed time window. We took into account
that kilonovae may have a range of absolute magnitudes, and that they may experience a
variety of host galaxy extinction due to dust. For the range in kilonova magnitudes, we
varied the absolute magnitude of the kilonova using a Gaussian distribution centered on the
absolute magnitude of AT 2017gfo/DLT17ck and a sigma of 0.5 magnitudes (e.g. 95% of
For the extinction distribution, we notice that the host environment of neutron stars mergers
is often compared to the host environment of SNe Ia since both types of systems are found
in early-type and star-forming galaxies (Fong et al. 2013). For this reason, we adopted for
the extinction distribution P(AV) = e−AV/τV, with τV = 0.334±0.088 mag(Kessler et al. 2009), which we label ‘SN Ia extinction’ scenario. We also computed the control time
using either no extinction (low extinction scenario) or an extinction distribution with a τ
value inflated by a factor 2 (high extinction scenario). We want to stress that, giving that
DLT17ck is the first clear case of a kilonova, any choice of absolute magnitude range and
reddening law is somehow arbitrary and those quantities will be better constrained when a
larger number of kilonovae was discovered.
In summary, for each galaxy, we have simulated 20,000 light curves randomly
distributed in the 13 months of the search, with a range of absolute magnitudes and
reddening. If at any epoch of observation, the simulated light curve was brighter than our
detection limit, the simulated transient would have been detected. The fraction of detected
simulated transients, multiplied by the time window each galaxy was observed, gives the
control time. The uncertainty on the detection limits (right panel of Figure 2), are reported
as systematic errors, while the three extinction distributions used (low, similar to SNe Ia
and high extinction) are reported separately.
During the 13 months of the search, the average number of observed frames per galaxy
was 64, while the average control time per galaxy was 80 days. This means that any fast
evolving transient like AT 2017gfo/DLT17ck would likely not be detected a second time if
the survey cadence was 2 days or larger. Our strategy of triggering a confirmation image
for each new target within a few hours of first detection well fits the need for these fast
transients. Excluding AT 2017gfo/DLT17ck, which was discovered only thanks to the
a limit to the rate of kilonovae of<0.47+0−0..0304SNuB4(low extinction),<0.50+0.05
−0.04SNuB (SNe
Ia extinction) and <0.55+0−0..0705SNuB (high extinction), where the rate has been normalized to the galaxy integrated luminosity. This translates to a limit in our Galaxy of <0.94+0−0..3837 (low extinction), < 1.00+0−0..4336 (SN Ia extinction), < 1.10+0−0..5140 (high extinction) per 100 years. These limits and the systematic error are reported in Table 2. As a cross check, we
have also computed from DLT40 the SN rates for SNe Ia, Ibc and II that will be reported
in a dedicated paper (Yang et al in preparation). We stress that our SN rates estimates are
consistent with previous measurements (Cappellaro et al. 1993, 1997; Leaman et al. 2011),
despite the poor statisitcs a few simplifications in the calculation of the control time.
4. Summary and Future Prospects
In this paper, we have used the observed light curve of a kilonova to constrain the
rate of BNS mergers to less than 0.47+0−0..0403SNuB (low extinction), 0.50+0−0..0504SNuB (SNe Ia extinction) and 0.55+0−0..0705SNuB (high extinction). Since some published measurements
of the BNS coalescence rates are expressed in units of co-moving volume, we convert
SNu rates to volumetric rates similarly to Botticella et al. (2012), that is multiplying
the SNuB rate by the galaxy B−band luminosity density reported in Kopparapu et al.
(2008) (1.98±0.16)×10−2 ×10¹⁰LB
M pc3. The kilonova volumetric rate upper limit
is 0.93+0−0..161810−4Mpc−3yr−1, 0.99+0.19
−0.1510−4Mpc−3yr−1 or 1.09−+00..281810−4Mpc−3yr−1
(depending on the extinction law used) and is compared with previous measurements in
Figure 3. Our rate is one order of magnitude higher than the BNS merger rate limit
obtained by LIGO/Virgo during the observing run O1 (Abadie et al. 2010) and two order
of magnitude higher than the optimistic rates of short Gamma-ray bursts (Coward et al.
4SNuB = 1 SN per 100 yr per 1010L
2012; Petrillo et al. 2013).
We can also investigate how long it would on average take for our search to discover
(independently from LIGO/Virgo) a kilonova. During the LIGO O2 run (∼ 1 yr), 117 d of
simultaneous LIGO-detector observing time has been used to discover one BNS coalescence
(Abbott et al. 2017a), which means there are 1/(117/365)=3.12 BNS sources in the LIGO
searching volumn, while our control time for kilonovae in the same period (monitoring
galaxies within 40 Mpc) is 0.22 yr (on average 80 days per year per galaxy). Comparing
the total luminosity of the DLT40 galaxy sample and the total luminosity of the GWGC
catalog, within 40 Mpc, gives 60% of the GWGC catalog sample monitored by the DLT40
survey. In order to independently discover a kilonova we would need to run the DLT40 for
3.12 / (control time * completeness )× the volume ratio of the two surveys aLIGO/aVirgo
and DLT40. During the O2 run, aLIGO/aVirgo were sensitive up to a volume of 78.5 Mpc
(Abbott et al. 2016b) and taking into account the different volumes of the two surveys
(78.5/40)3, we would need to run DLT40 for∼18.4 years in order to independently discover
a kilonova. This explains why historical optical searches (like the Lick SN search; Leaman
et al. 2011) never detected a kilonova.
Given that it is quite unlikely to independently discover a kilonova with a search like
DLT40, we may at least understand what a DLT40-like search may be able to do during
the O3 aLIGO/aVirgo run. During O3, LIGO will be able to detect BNS coalescences out
to 150 Mpc, while Virgo should be sensitive out to 65−85 Mpc (Abbott et al. 2016a). If all
kilonovae would be as bright as DLT17ck, with the current DLT40 observing strategy, we
could detect kilonovae within a distance of 70 Mpc. In order to cover the full Virgo volume
(85 Mpc), we would need to go ∼ 0.4 mag deeper (to a limiting magnitude ∼ 19.4 mag),
hence increasing the exposure time by a factor of 2.2 (100 seconds per exposure, instead
45 s exposures, increasing the exposure time to 100 seconds would still allow us to observe
∼230 galaxies during a single night. Randomly selecting galaxies within 85 Mpc from the
GLADE5 catalog in typical aLIGO/aVirgo regions (30 sq degrees) the average number of
galaxies is ∼230 – almost exactly the same number of galaxies observable by DLT40 each
night with an exposure time of 100 seconds. Here we neglect that the GLADE catalog is
only ∼85−90% complete in the integrated luminosity up to 85 Mpc (GLADE catalog).
Therefore, within 85 Mpc, small telescopes can still play a useful role (unless DLT17ck
turns out to be a particularly bright kilonova), but the incompleteness of the available
catalogs, especially for faint galaxies, may suggest that a wide-field of view strategy to
directly tile the full aLIGO/aVirgo localization region may be preferred to avoid possible
biases in sampling of the stellar population. In this respect the association of GRBs
(Savaglio et al. 2009) and SLSN (Perley et al. 2016) with dwarf galaxies is a lesson learned.
Research by DJS and L.T. is supported by NSF grants AST-1412504 and AST-1517649.
The DLT40 web-pages structure were developed at the Aspen Center for Physics, which is
supported by National Science Foundation grant PHY-1066293 AC acknowledges support
from the NSF award #1455090 ”CAREER: Radio and gravitational-wave emission from
the largest explosions since the Big Bang”. The work of SY was supported by the China
Scholarship Council(NO. 201506040044).
REFERENCES
Abadie, J., Abbott, B. P., Abbott, R., et al. 2010, Classical and Quantum Gravity, 27,
173001
Abbott, B. P., Abbott, R., Abbott, T. D., et al. 2016a, Living Reviews in Relativity, 19, 1
Abbott, B. P., Abbott, R., Abbott, T. D., et al. 2016b, ApJ, 832, L21
Abbott, B. P., Abbott, R., Abbott, T. D., et al. 2017a, PRL, 1, L21
Abbott, B. P., Abbott, R., Abbott, T. D., et al. 2017b, ApJ, 1, L21
Becker, A. 2015, HOTPANTS: High Order Transform of PSF ANd Template Subtraction,
Astrophysics Source Code Library, ascl:1504.004
Berger, E., Leibler, C. N., Chornock, R., et al. 2013, ApJ, 779, 18
Botticella, M. T., Smartt, S. J., Kennicutt, R. C., et al. 2012, Astronomy & Astrophysics,
537, A132
Brown, T. M., Baliber, N., Bianco, F. B., et al. 2013, PASP, 125, 1031
Cappellaro, E., Turatto, M., Benetti, S., et al. 1993, Astronomy & Astrophysics, 268, 472
Cappellaro, E., Turatto, M., Tsvetkov, D. Y., et al. 1997, Astronomy & Astrophysics, 322,
431
Collaboration, L. 2017a, GRB Coordinates Network, 21509
Collaboration, L. 2017b, GRB Coordinates Network, 21527
Coward, D. M., Howell, E. J., Piran, T., et al. 2012, MNRAS, 425, 2668
Doctor, Z., Kessler, R., Chen, H. Y., et al. 2017, ApJ, 837, 57
Dominik, M., Berti, E., O’Shaughnessy, R., et al. 2015, ApJ, 806, 263
Drout, M. R., Chornock, R., Soderberg, A. M., et al. 2014, ApJ, 794, 23
Fong, W., Berger, E., Chornock, R., et al. 2013, ApJ, 769, 56
Fong, W., Berger, E., Margutti, R., & Zauderer, B. A. 2015, ApJ, 815, 102
Gehrels, N. 1986, The Astrophysical Journal, 303, 336
Hulse, R. A., & Taylor, J. H. 1975, ApJ, 195, L51
Jin, Z.-P., Li, X., Cano, Z., et al. 2015, ApJ, 811, L22
Jin, Z.-P., Hotokezaka, K., Li, X., et al. 2016, Nature Communications, 7, 12898
Kalogera, V., Kim, C., Lorimer, D. R., et al. 2004, ApJ, 601, L179
Kasen, D., Badnell, N. R., & Barnes, J. 2013, ApJ, 774, 25
Kasliwal, M. M., Cenko, S. B., Kulkarni, S. R., et al. 2011, ApJ, 735, 94
Kessler, R., Becker, A. C., Cinabro, D., et al. 2009, ApJS, 185, 32
Kim, C., Perera, B. B. P., & McLaughlin, M. A. 2015, MNRAS, 448, 928
Kopparapu, R. K., Hanna, C., Kalogera, V., et al. 2008, ApJ, 675, 1459
Lattimer, J. M. 2012, Annual Review of Nuclear and Particle Science, 62, 485
Leaman, J., Li, W., Chornock, R., & Filippenko, A. V. 2011, MNRAS, 412, 1419
Metzger, B. D., Mart´ınez-Pinedo, G., Darbha, S., et al. 2010, MNRAS, 406, 2650
Petrillo, C. E., Dietz, A., & Cavagli`a, M. 2013, ApJ, 767, 140
Piran, T., Nakar, E., & Rosswog, S. 2013, MNRAS, 430, 2121
Reichart, D., Nysewander, M., Moran, J., et al. 2005, Nuovo Cimento C Geophysics Space
Physics C, 28, 767
Savaglio, S., Glazebrook, K., & Le Borgne, D. 2009, ApJ, 691, 182
Siellez, K., Bo¨er, M., & Gendre, B. 2014, MNRAS, 437, 649
Scolnic, D., Kessler, R., & Brout, D. 2017, ApJ, arXiv:1710.05845
Tartaglia, L., Sand, D. J., Valenti, S., et al. 2017, arXiv:1711.03940
Valenti, S., David, J., & Soung, S. e. a. 2017, ApJ, 848, 2
van der Kruit, P. C. 1987, A&A, 173, 59
Vangioni, E., Goriely, S., Daigne, F., Fran¸cois, P., & Belczynski, K. 2016, MNRAS, 455, 17
White, D. J., Daw, E. J., & Dhillon, V. S. 2011, Classical and Quantum Gravity, 28, 085016
Zwicky, F. 1942, ApJ, 96, 28
0
50
100
150
200
250
300
350
JD + 2457632.5
12
14
16
18
20
22
R magnitude
DLT16b DLT16c DLT16d DLT16w DLT16z DLT16ac DLT16ad DLT16al DLT16am DLT16bw DLT17h DLT17u DLT17ag DLT17ah DLT17ar DLT17aw DLT17bk DLT17bl DLT17cr DLT17cc DLT17bx DLT17cx DLT17cd DLT17ch DLT17cl DLT17cq DLT17ckFig. 1.— Top panel: The DLT40 galaxy catalog (black points). The SNe discovered during
the first year of DLT40 are also shown (red points) together with the kilonova DLT17ck
(blue point). Lower panel: DLT40 light curves of all the SNe (and the kilonova) discovered
Fig. 2.— Left panel: Transient detection efficiency as a function of apparent magnitude for
5 DLT40 fields. The lines are the best fit to the curve. The limiting magnitude is chosen at
50% efficiency. Right panel: We compare the limiting magnitude computed for each image
using its zeropoint and an analytical function with the limiting magnitude computed with
artificial star experiments on difference images. This linear relation has been used to scale
the limiting magnitude computed for each frame (given its zeropoint) to a more realistic
Fig. 3.— DLT40 limit on the kilonova rate (all three reddening scenarios) compared with
the rate of sGRB (orange symbols, Coward et al. 2012; Petrillo et al. 2013; Scolnic et al.
2017; Fong et al. 2015), the rates of BNS merger from stellar evolution (blue lines, de Mink
& Belczynski 2015; Dominik et al. 2015), cosmic nucleosynthesis (green line, Vangioni et al.
2016), galactic pulsar population (magenta line, Kim et al. 2015), gravitational waves (black
lines, Abadie et al. 2010; Abbott et al. 2017a) and fast optical transients (red symbols, Jin
Table 1: Summary table of the supernovae detected with DLT40. Their light curves are
shown in Figure 1. Supernovae detected in background galaxies are marked as BKG.
RA DEC DLT NAME TNS NAME SN TYPE HOST GALAXY
278.63 -58.53 DLT16b 2016bmi SN IIp IC4721
170.08 12.98 DLT16c 2016cok SN IIp NGC3627
329.77 18.19 DLT16d 2016coi SN Ic UGC11868
328.62 -57.66 DLT16w 2016fjp SN Ia BKG
23.56 -29.44 DLT16z 2016gkg SN IIb NGC0613
20.55 0.95 DLT16ac 2016hgm SN II NGC0493
140.87 -23.17 DLT16ad 2016gwl SN Ia NGC2865
63.02 -32.86 DLT16al 2016iae SN Ic NGC1532
63.03 -32.85 DLT16am 2016ija SN II NGC1532
114.29 -52.32 DLT16bw 2016iyd SN II BKG
159.32 -41.62 DLT17h 2017ahn SN II NGC3318
218.14 -44.13 DLT17u 2017cbv SN Ia NGC5643
193.46 9.70 DLT17ag 2017cjb SN II NGC4779
200.52 -13.14 DLT17ah 2017ckg SN II BKG
144.15 -63.95 DLT17ar 2017cyy SN Ia ESO091-015
263.11 7.06 DLT17aw 2017drh SN Ia NGC6384
192.15 -41.32 DLT17bk 2017ejb SN Ia NGC4696
349.06 -42.57 DLT17bl 2017bzc SN Ia NGC7552
344.32 -41.02 DLT17cr 2017bzb SN II NGC7424
227.31 -11.33 DLT17cc 2017erp SN Ia NGC5861
20.06 3.40 DLT17bx 2017fgc SN Ia NGC0474
114.11 -69.55 DLT17cx 2016jbu SN IIn NGC2442
95.39 -27.21 DLT17cd 2017fzw SN Ia NGC2217
71.46 -59.25 DLT17ch 2017gax SN Ibc NGC1672
88.27 -17.87 DLT17cl 2017gbb SN Ia IC0438
38.88 -9.35 DLT17cq 2017gmr SN II NGC0988
Table 2: DLT40 rate estimation results
Type extinction (mag)
control time
(days)
lums ratea
(SNuB)
vol rateb
(10−4M pc−3yr−1)
Milky Way ratec
((100yr)−1)
no reddening P(AV) = 0 79.67−+45..5153 <0.47 +0.04
−0.03 <0.93 +0.16
−0.18 <0.94 +0.38
−0.37
Ia reddening P(AV) =e−AV/0.334 75.07+5−6..3556 <0.50 +0.05
−0.04 <0.99 +0.19
−0.15 <1.00 +0.43
−0.36
high reddening P(AV) = 2×e−AV/0.334 69.46+6−7..1528 <0.55 +0.07
−0.05 <1.09 +0.24
−0.18 <1.10 +0.51
−0.40
(a) : DLT40 only detected DLT17ck because of the LIGO detection and subsequent localization, therefore it is not
considered in our rate calculations, which we report here as 95% confidence level Poisson single-sided upper limits,
given zero events (Gehrels 1986).
(b) : We converted the rates in units of SNuB to volumetric rates with luminosity density:
(1.98±0.16)×10−2×10¹⁰LB
M pc3 (Kopparapu et al. 2008).
(c) : The total B-band luminosity of the MW is quite uncertain; we adopt (2.0±0.6)×1010LB