Special Focus: Mobilising Migrants’
Consult this publication on line at http://dx.doi.org/10.1787/migr_outlook-2014-en.This work is published on the OECD iLibrary, which gathers all OECD books, periodicals and statistical databases. Visit www.oecd-ilibrary.org for more information.
International Migration
Outlook 2014
International Migration Outlook 2014
Contents
Editorial
Executive summary
Chapter 1. Recent developments in international migration trends
Chapter 2. Labour market integration of immigrants and their children: Developing, activating and using skills
Chapter 3. Managing labour migration: Smart policies to support economic growth
Chapter 4. Country notes: Recent changes in migration movements and policies
Statistical Annex
www.oecd.org/migration/imo
ISBN 978-92-64-21118-6In
te
rnat
iona
l Mi
g
rat
ion
O
u
tlo
o
k 2
01
4
International Migration
Outlook
opinions expressed and arguments employed herein do not necessarily reflect the official views of OECD member countries.
This document and any map included herein are without prejudice to the status of or sovereignty over any territory, to the delimitation of international frontiers and boundaries and to the name of any territory, city or area.
ISBN 978-92-64-21118-6 (print) ISBN 978-92-64-22352-3 (PDF)
Annual: International Migration Outlook ISSN 1995-3968 (print)
ISSN 1999-124X (online)
The statistical data for Israel are supplied by and under the responsibility of the relevant Israeli authorities. The use of such data by the OECD is without prejudice to the status of the Golan Heights, East Jerusalem and Israeli settlements in the West Bank under the terms of international law.
Photo credits:Cover © David Rooney.
Corrigenda to OECD publications may be found on line at:www.oecd.org/about/publishing/corrigenda.htm.
© OECD 2014
Please cite this publication as:
OECD (2014),International Migration Outlook 2014, OECD Publishing. http://dx.doi.org/10.1787/migr_outlook-2014-en
Foreword
T
his publication constitutes the thirty-eighth report of the OECD’s Continuous Reporting System on Migration. The report is divided into four chapters plus a Statistical annex. It is a special edition prepared for the OECD High-Level Policy Forum on Migration, held in Paris, December 2014. This forum aimed at discussing and analysing challenges in managing migration and fostering integration of immigrants and their children in the context of current and future skills needs of OECD and key partner countries. The overarching theme was on “Mobilising migrants’ skills for economic success”.Chapter 1 provides a broad overview of recent trends in international migration flows. Chapters 2 and 3 are devoted to special topics. Chapter 2 takes stock of the broad issues involved in the labour market integration of immigrants and their offspring from a human capital perspective, as well as of the policies at hand to free their full skills potential through the identification and utilisation, the activation, and the development of their skills. It builds on the extensive work of the OECD on integration issues, together with new evidence. Chapter 3 provides a systematic and comparative overview of labour migration management; identifying key elements which can help policy makers match concrete measures to overarching objectives. It discusses how the landscape for labour migration policy is changing, due to both structural factors and the breakdown of traditional categories, posing new challenges for policy makers.
Chapter 4 presents succinct country-specific notes and statistics on developments in international migration movements and policies in OECD countries in recent years. Finally, the Statistical annex includes a broad selection of recent and historical statistics on immigrant flows, the foreign and foreign-born populations and naturalisations.
This year’s edition of the OECDInternational Migration Outlookis the joint work of staff of the International Migration Division in the Directorate for Employment, Labour and Social Affairs. Chapters 1 and 4 are a collective work of the staff of the International Migration Division with contributions from John Salt (University College London, the United Kingdom) and Martina Lubyova (Slovak Academy of Sciences, the Slovak Republic) for Chapter 4. Chapter 2 was prepared by Thomas Liebig and Thomas Huddleston (Consultant to the OECD). Chapter 3 was prepared by Jonathan Chaloff and Sankar Ramasamy. Jean-Christophe Dumont edited the report. Research assistance and statistical work were carried out by Véronique Gindrey and Philippe Hervé. Editorial assistance was provided by Sylviane Yvron. Finally, thanks go to Ken Kincaid for his editing work on Chapters 2 and 3.
Table of contents
Editorial: Migration policy in a time of uncertainty . . . 9
Executive summary. . . 13
Chapter 1.Recent developments in international migration trends. . . 17
Key findings . . . 18
Recent trends in international migration . . . 19
Notes. . . 33
Chapter 2.Labour market integration of immigrants and their children: Developing, activating and using skills. . . 35
Key policy findings . . . 36
Introduction. . . 45
The labour market integration context . . . 46
What policies matter for immigrant integration? . . . 69
Conclusion: Integration as investment . . . 106
Notes. . . 108
Bibliography . . . 110
Annex 2.A1.Supplementary tables and figures . . . 115
Chapter 3.Managing labour migration: Smart policies to support economic growth. . . 133
Key policy findings . . . 134
Introduction. . . 145
The changing landscape of labour migration . . . 146
Setting and balancing goals for migration policy intervention . . . 152
The policy toolbox for achieving labour migration policy goals . . . 160
Building a migration management infrastructure. . . 204
Conclusions . . . 214
Notes. . . 215
Bibliography . . . 218
Chapter 4.Country notes: Recent changes in migration movements and policies . . . 233
Sources and notes of the country tables of Chapter 4. . . 310
Statistical annex. . . 313
Introduction. . . 314
General comments . . . 314
Inflows and outflows of foreign population . . . 316
Inflows of asylum seekers . . . 341
Stocks of foreign and foreign-born populations. . . 361
Acquisitions of nationality . . . 400
Abbreviations. . . 421
List of the members of the OECD Expert Group on Migration. . . 423
List of OECD Secretariat members involved in the preparation of this publication . . 425
Australia. . . 234 Austria . . . 236 Belgium . . . 238 Bulgaria . . . 240 Canada . . . 242 Chile . . . 244 Czech Republic . . . 246 Denmark . . . 248 Estonia . . . 250 Finland . . . 252 France. . . 254 Germany . . . 256 Greece. . . 258 Hungary . . . 260 Ireland . . . 262 Israel. . . 264 Italy. . . 266 Japan. . . 268 Korea . . . 270 Latvia . . . 272 Lithuania . . . 274 Luxembourg . . . 276 Mexico . . . 278 Netherlands . . . 280 New Zealand. . . 282 Norway . . . 284 Poland . . . 286 Portugal . . . 288 Romania . . . 290 Russian Federation . . . 292 Slovak Republic . . . 294 Slovenia . . . 296 Spain . . . 298 Sweden . . . 300 Switzerland. . . 302 Turkey . . . 304 United Kingdom. . . 306 United States . . . 308
Look for the StatLinks2at the bottom of the tables or graphs in this book. To download the matching Excel® spreadsheet, just type the link into your Internet browser, starting with the http://dx.doi.org prefix, or click on the link from the e-book edition.
This book has...
StatLinks
2
A service that delivers Excel files from the printed page! ® http://twitter.com/OECD_Pubs http://www.facebook.com/OECDPublications http://www.linkedin.com/groups/OECD-Publications-4645871 http://www.youtube.com/oecdilibrary http://www.oecd.org/oecddirect/ OECD Alerts
Editorial: Migration policy in a time of uncertainty
M
igration has become a constant factor in the economic and social landscape.Most OECD countries are net immigration countries, and the share of immigrants has been rising in almost all of them. There are now more than 115 million immigrants in OECD countries, about 10% of the population. A further 5% of the native-born population has at least one immigrant parent. Migration flows are close to four million annually.Just as constant as migration are concerns about whether immigrants and their children will integrate in the labour market. These concerns have only grown since the crisis, which hit immigrants disproportionately hard. Migrants account for more than one in five of additional unemployed in the OECD since 2007, and in many countries they have a harder time in getting back into work. One reason is that, compared to natives there are fewer immigrants who are outside the labour market. Indeed, in a number of OECD countries, migrants, notably those with less than upper secondary education, are more likely to be employed than their native counterparts.
Migration is in constant evolution.The context in which migration happens, as well as migration flows themselves, is always evolving. Temporary labour migration and free movement, notably in Europe, have experienced wide swings before and during the crisis. Free movement for example decreased by more than 35 % between 2007 and 2010. Since then, it has strongly rebounded, although these flows have shifted from southern Europe to Germany.
Another change is in where migrants come from. China continues to top the list of origin countries, but flows from other countries have ebbed and flowed: Migration from Eastern Europe rose and then fell, while migration from Latin America has been in a more consistent decline.
There has been a change, too, in the sort of people who are migrating. Today’s migrants are better educated than their predecessors. The number of foreign-born who are highly-educated has grown by 70% over the past decade to exceed 31 million in the OECD area. Over that period, highly educated immigrants accounted for 45% of the increase in the foreign born population. Despite this boost to the supply of skills, educated migrants don’t always have a success story to tell. They fare worse on skill tests than native-born with the same education, largely, but not entirely, because of a language handicap. They also have a higher rate of unemployment than their native peers. And their over-qualification rate is 50% higher than that of natives.
Policy needs to keep up.Migration and integration policy need to keep pace with these changes, some of which have been visible for a long time and so cannot have come as a shock to policymakers. In the face of more qualified immigrants, for example, countries such as Germany and Denmark have invested in processes to assess and recognise foreign
qualifications. Growing backlogs of qualified candidates led Canada and other countries to fast-track skilled migrants with a job offer in hand. A shortage of young people to fill low-skill jobs led Korea to rethink its temporary labour migration system.
Yet, compared to even five years ago, we are now seeing more disorienting shifts in migration, which complicate the task of matching policy to changing circumstances. The policy objectives for migration have also shifted, as has the perception of the role of migration. Today’s policy debate places greater emphasis on social cohesion and less on urgent recruitment needs. Greater importance has been given to the ability to adapt to new circumstances and build in more flexibility. Public opinion clamours for more information about today’s migrants, wanting more reassurance that integration measures are on track and that labour migration management is well suited to foster economic growth.
This report puts the spotlight on important challenges facing policy makers:
● First, there is the challenge ofreconciling short-term and long-term policy considerations. Short political cycles and hostile public opinion can work against longer-term planning. For example, integration programmes may involve an upfront investment, yet may raise migrants’ employment performance only in the long term. Similarly, permanent migration has an effect on long-term demographic developments but also has to respond to rapidly changing economic circumstances.
● Second, there is the challenge ofreconciling conflicting objectives. The need to protect local workers must be balanced against requests from employers to recruit quickly from the broadest possible pool of candidates. The need to be attractive in a competitive global market for talent must be weighed against the need to ensure the integrity of admission processes and to protect the local labour force. Efficiency must be balanced against procedural safeguards. The objective of filling short-term demand with temporary migrants may also conflict with the need to offer integration opportunities to migrants with long-term plans. In the realm of integration policy, the need to target immigrants with specific and appropriate measures must be balanced against the need to ensure fair and equal treatment, avoid stigmatising vulnerable categories, and mainstream services and policies.
● Third, there is the challenge ofdealing with uncertainties. Geopolitical events affect international migration flows as well as public attitudes toward migration. Even though geopolitical shocks mostly provoke refugee and asylum seeker flows, labour migration policy is not decided in a sealed compartment. The needs of business are also not easy to predict: Short-term labour needs may turn out to be protracted, making a temporary labour force ill-suited to meeting them. At the same time, structural changes may affect long-standing industries, undermining the need for permanent labour migrants. Another area of uncertainty is the behaviour of migrants themselves: Migrants are more mobile than natives and more likely to move on when circumstances change, although it is impossible to predict how many will do so. It is also impossible to predict how many natives will leave if the economy turns sour: Since, the crisis struck, a number of OECD countries have had to react to unexpectedly large outflows of both migrants and natives. Finally, migration is increasingly multipolar. More and more countries compete
The most efficient way to respond to these challenges and uncertainties is to adopt a dynamic migration management system as well as an adaptable and flexible integration framework. This, in itself, is a challenge. First of all, building consensus among stakeholders on changes in migration and integration policies has proven arduous in many countries. Secondly, migrants are rational agents who quickly adapt their behaviour to policy changes, amplifying or possibly neutralising the intended effects. Lastly, policymakers are expected to justify and explain their policy choices to a sometimes unforgiving public. It may be tempting to use blunt and direct – if not inflexible – policy measures, since these are easier to communicate. Dynamic systems, on the other hand, require informing and communicating with the public about results, and about changes and adaptations. Sweden is one example of a country that has changed its integration and labour migration frameworks several times in recent years in response to changing circumstances and evidence from practice.
There are three main lessons in addressing these challenges:
● Migrants need to be seen as a resource rather than a problem and integration policies as an investment to make the best use of their skills.
● Even labour migration management systems that work today may not work tomorrow. The costs, short- and long-term, of standing still in the face of rapidly changing economic, demographic and geopolitical environments can be high.
● Although underdeveloped in many countries, evaluation and feedback in both integration and labour migration management are crucial to building public confidence on migration.
There are many ways for migrants to contribute to economic growth. Getting migration right is not about the volumes of admission, or the size of public expenditures, or about finding a magic formula so that “everyone wins”, but about transparently prioritising objectives and using well-designed tools to achieve them.
This report, prepared for theOECD High-Level Policy Forum on Migration in December 2014, brings together some of the lessons for dealing with these challenges, and identifies a number of good practices. The OECD last held a High Level Policy Forum in 2009 and, since then, not only have circumstances changed but so has our knowledge and understanding of migration and integration policy.
Stefano Scarpetta, OECD Director for Employment,
Executive summary
Main trends
Permanent migration flows to the OECD have begun to rebound, according to preliminary data for 2013. Compared with 2012, they grew slightly by 1.1% to reach around 4 million new permanent immigrants. This modest increase is the consequence of conflicting evolutions in several major immigration countries. Migration to Germany recorded a double-digit increase, its fourth consecutive annual rise. By contrast, several major immigration countries saw declines, notably the United States, Italy, Portugal and Spain. Net migration is still well below pre-crisis levels, but it remains positive in most OECD countries. Notable exceptions are Mexico, Iceland, and Ireland.
The rebound in permanent migration is driven mainly by a rise in free-movement migration, which rose by 10% in 2012. Across OECD countries, most of this free-movement migration is accounted for by people moving between EU states. In 2012, and for the first time ever, such movements within Europe matched legal permanent migration from outside Europe. Germany was the most important destination, receiving almost a third of free-movement migrants.
Overall, however, family migration continues to account for the bulk of migration flows in OECD countries, even though it has been declining since 2008. In 2012, it dropped by 1.7% on the previous year, mainly due to falls in Spain, Italy, the United States, the United Kingdom and Belgium. Labour migration has also declined continuously since the economic downturn, falling 12% in 2012. The fall was particularly notable in the European Economic Area, where labour migration decreased by almost 40% between 2007 and 2012. As a result, for the first time in 2012, legal permanent migration from third countries to Europe was slightly lower than legal permanent migration to the United States.
Like permanent migration, temporary migration flows remain below their peak of 2.5 million in 2007. In 2012, they stood at 1.9 million, about a quarter below the figure for 2007. The conflict in Syria contributed to push asylum claims up by 20% in 2013 to 560 000 applications. Claims to Germany rose for the sixth year in a row, making it the world’s largest recipient with 110 000 claims. It was followed by the United States, France, Sweden and Turkey. As a proportion of its population, Sweden received the most asylum seekers and refugees.
International students continue to attract significant policy attention in many OECD countries. Worldwide, 4.5 million students were enrolled outside their country of citizenship in 2012, with 75% of them studying in OECD countries. That share is largely unchanged on recent years. The number of international students in OECD countries continues to grow but the rise was only 3% in 2012, well down on average annual growth rates of 8% in 2000-05 and 6% in 2005-11.
Investing in the labour market integration of immigrants
First- and second-generation immigrants are playing a growing role in the workforce. In countries settled through immigration, such as Australia, Canada, New Zealand, and the United States, as well as in Western Europe, immigrants are well established. Elsewhere, in Southern Europe for example, they are a relatively recent but growing presence in the education system and the labour market.
The integration of immigrants and their families has been a prime policy objective in many OECD countries for at least the past 15 years. Perhaps the most important challenge is unleashing immigrants’ full skills potential. A number of policy approaches can help make this happen:
● Make information on foreign qualifications more widely available and improve their recognition.
● Ensure immigrants have access to active labour market programmes and that they benefit from them.
● Put immigrants more directly in contact with employers.
● Provide immigrants’ children with high-quality early childhood education and care.
● Provide language training adapted to immigrants’ skills.
Developing smart labour migration management systems
Even though unemployment remains high in OECD countries, migration still has role to play in meeting labour market needs and in driving economic growth. While this role varies enormously across countries, there is a shared aspiration to create the conditions for “better” labour migration, especially against a backdrop of close public scrutiny.
Labour migration policy can be used to achieve different and sometimes competing goals. These may include satisfying short-term labour needs and contributing to long-term demographic and labour force development. There may also be wider economic development objectives in areas like investment and trade, innovation and productivity and development co-operation. There are inherent trade-offs in balancing these objectives, and policy actors in different areas should co-ordinate to ensure coherent approaches.
A very wide range of tools can be used to ensure that labour migration meets its policy objectives. These can range from numerical limits on migration to “points-based” selection of would-be immigrants, and much more. Flexibility is important in applying these tools to ensure a dynamic and reactive management system. A range of policy approaches can help labour migration play a better role in meeting current and future skills needs:
● Develop a clear labour migration framework.
● Assemble a policy toolbox with a range of instruments for different objectives.
● Improve management of admission criteria and adopt a dynamic approach to migration management.
Key figures
● Preliminary data suggests permanent migration flows to the OECD rose by about 1% in 2013 compared to 2012, following a 0.8% drop in 2012 compared to the previous year.
● Labour migration has declined continuously since the economic downturn and fell by about 12% in 2012. By contrast, free-movement migration rose 10%.
● Asylum seeking increased by 20% in 2013 compared to 2012.
● Worldwide, the number of students enrolled outside their country of citizenship more than doubled since 2000 to reach 4.5 million in 2012, with 75% enrolled in OECD countries.
● With a little over half a million emigrants, China accounted for almost 10% of all flows to OECD countries in 2012, followed by Romania (5.6%) and Poland (5.4%).
● There are more than 115 million immigrants in the OECD, about 10% of the total population.
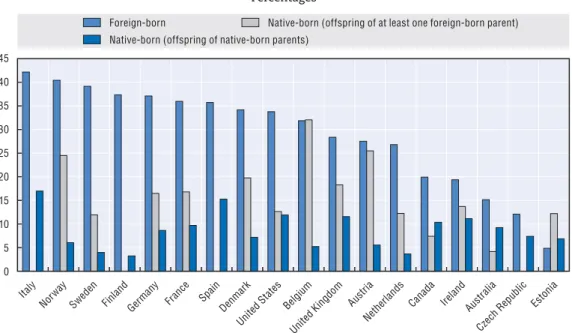
● In 2012, about 12.5% of all 15 year-olds had two foreign-born parents – 50% more than a decade earlier. Their integration, particularly those with parents with low levels of education, is a growing concern.
● The crisis hit immigrants disproportionately hard: of the additional 15 million unemployed in the OECD since 2007, about 1 in 5 is foreign-born.
● Despite the crisis most immigrants are in work. On average, a higher proportion of low-educated immigrants (54.1%) are in work than their native-born peers (52.6%).
● By contrast, tertiary educated immigrants are less likely to be in work than their native-born counterparts (77% versus 84%). And when employed, they are 50% more likely to be over-qualified for their jobs.
Chapter 1
Recent developments in international
migration trends
This chapter provides an overview of recent developments in international migration movements in OECD countries. It begins with a description, based on preliminary data and estimates, of permanent migration flows in 2013, before going on to a more detailed analysis of trends from the start of the financial crisis to 2012. This is followed by an analysis of the changes in the composition of these flows by main category of migration in which particular attention is paid to labour migration – including employment-related free movement. Permanent migration for family or humanitarian motives is then analysed. Temporary migration follows with brief highlights on seasonal and intra-company transfers as well as tracing the continuing growth of asylum seekers especially in the wake of the Syrian conflict since 2011, before turning on to the international mobility of students, a policy focus of many OECD countries. The chapter concludes with a look at the key countries of origin from which migrants leave for OECD countries and the changing trends in net migration as international migration movements have responded to the crisis and its aftermath.
The statistical data for Israel are supplied by and under the responsibility of the relevant Israeli authorities. The use of such data by the OECD is without prejudice to the status of the Golan Heights, East Jerusalem and Israeli settlements in the West Bank under the terms of international law.
Key findings
● Preliminary data suggest that permanent migration flows to the OECD have begun to rebound in 2013 – rising by approximately 1% compared with 2012. This rebound has partially been driven by the large increase recorded in the number of migrants to Germany. These increased migration flows to Germany were, to some extent, offset by declining flows to the United States – which remains the largest receiving OECD country – and to Italy and Spain – where tough economic conditions continued to prevail.
● The full data for 2012 showed a modest fall in permanent migration flows, of 0.8% compared to the previous year. This slowdown reflects the slow pace of the global economic recovery, as well as the economic climate in Europe. An interesting trend in Europe is the declining levels of migration from countries outside of the European Union (EU) area. Even then, migration from third countries to the EU has been substantial, with an average of 1.2 million per year over the period 2007-12, more than the equivalent for the United States.
● Labour migration has declined continuously since 2007/08 and fell across the OECD by about 12% in 2012. Within the EU, the fall has been more substantial still and a large drop-off in the numbers of migrants arriving in Spain and Italy have contributed to a fall of almost 40% between 2007 and 2012. However, this has to be nuanced as, in the context of free-circulation areas, at least half of free-movement migration flows are estimated to be employment-related.
● The rebound, observed since 2010, in free-movement migration continued in 2012 with a 10% increase in 2012 compared to 2011. Much of this increase has been driven by the large increase in the number of migrants to Germany – which has now become the single most important destination for free-mobility migrants. For several EU/EFTA countries free-movement migration accounts for a sizeable portion of their permanent inflows – reaching three-quarters of total inflows in Switzerland and Austria.
● Flows of humanitarian migrants have declined by about 6% in 2012. This has mostly resulted from decreased flows to the United States, to Canada and to the Netherlands. Settlement countries1receive the majority of resettled refugees – hosting 68% of such flows into the OECD – while the rest are mostly settled in Northern European OECD countries. In contrast, European OECD countries host approximately three-quarters of those migrants arriving through the asylum channel where the settlement countries host only 16%.
● Temporary migration flows, which had been rising until 2007 when they reached a high of 2.5 million, have since fallen. In 2012, temporary migration flows fell by 4.4% and stood at approximately 75% of their 2007 peak. Since 2007, Working Holiday Schemes
● Flows of migrants seeking asylum increased by 20% in 2013. This was primarily due to the conflict in Syria, and indeed Syria continues to be the major origin country of asylum seekers. On a per capita basis, Sweden is the country receiving the largest number of both asylum seekers and refugees.
● Worldwide, the number of students enrolled outside their country of citizenship has more than doubled since 2000, reaching 4.5 million in 2012, with 75% enrolled in an OECD country. However, the pace of this growth has slowed, and the number of foreign students enrolling in OECD countries increased by only 3% in 2012 compared to 8% per annum during 2000-05 and 6% in 2005-11. More than half of all international students arrive from Asia, with China representing 22%, followed by India. Outside Asia, the major countries of origin are Germany and France.
● With over half a million emigrants in 2012, China maintained its position as the country sending the largest number of migrants to OECD countries – contributing almost 10% of all flows to the OECD. Romania (5.6%) and Poland (5.4%) also contributed substantially to migration flows to the OECD. Indeed, relative to their population, these two countries have much higher expatriation rates to OECD countries than China.
● Overall net migration continues to be positive among OECD countries. However, the effects of the global slowdown have been reflected in these flows. Average net migration has almost halved, from 4.4 persons per thousand population in 2005-08 to 2.6 persons per thousand in 2009-12.
Recent trends in international migration
Preliminary data for 2013 suggest that permanent migration flows to the OECD have begun to rebound, growing by 1.1% since 2012 (Table 1.1).2This modest increase is the consequence of counter-balancing changes in several major immigration countries. Preliminary estimations indicate another double-digit growth in the number of migrants to Germany. This fourth consecutive annual increase is driven largely by inflows from Central and Eastern Europe and, to some extent, Southern Europe and takes Germany well above 400 000 immigrants in 2013. After the United States, Germany is now the OECD’s second most important destination country, up from eighth position in 2009. Permanent migration flows to the United States, in contrast, were 4% lower in 2013 than in 2012. And, while the United States remains by far the OECD’s largest receiving country, for the first time in ten years, it has received less than 1 million permanent migrants. Reflecting the ongoing economic situation, migration flows to Italy and Spain appear to have declined rather markedly. These countries, which were second or third largest immigration countries in the OECD from 2007 to 2011, now hold seventh and eighth positions, even though flows to these countries, at around 200 000 persons annually, remain substantial.
Outside of these countries, the United Kingdom saw inflows stabilise at just below 300 000 persons. Permanent migration flows rose by 3% in Australia, by 4% in New Zealand and a small increase was also recorded in Canada. Switzerland, whose annual immigration flows represented 1.7% of the population in 2013 – the highest among OECD countries for which data are available – showed an annual growth in the numbers of arriving migrants of over 8%, mainly driven by free movement migration. Inflows to Sweden also increased again and reached a new high, primarily due to the increase in humanitarian flows. This is likely to continue into 2014, as preliminary data show that the number of refugees – notably from Syria – continues to rise, while other migration categories remain stable.
Table 1.1. Inflows of permanent immigrants into selected OECD countries, 2007-13 2007 2008 2009 2010 2011 2012 2013 Variation (%) 2013/12 2012/11 2012/07 Standardised statistics United States 1 052 400 1 107 100 1 130 200 1 041 900 1 061 400 1 031 000 989 900 -4 -3 -2 Germany 232 900 228 300 201 500 222 500 290 800 399 900 .. .. 38 72 United Kingdom 343 300 317 300 359 200 394 800 322 600 286 100 291 000 2 -11 -17 France 213 700 222 400 221 400 233 700 240 700 258 900 .. .. 8 21 Italy 571 900 490 400 390 300 355 700 317 300 258 400 .. .. -19 -55 Canada 236 800 247 200 252 200 280 700 248 700 257 900 258 600 0 4 9 Australia 191 900 205 900 221 000 208 500 219 500 245 100 253 500 3 12 28 Spain 691 900 409 600 334 100 300 000 291 000 209 800 .. .. -28 -70 Switzerland 122 200 139 100 114 800 115 000 124 300 125 600 136 200 8 1 3 Netherlands 80 600 90 600 89 500 95 600 105 600 | 96 800 105 500 9 -8 20 Sweden 74 400 71 000 71 500 65 600 71 800 81 700 86 700 6 14 10 Austria 47 100 49 500 45 700 45 900 58 400 | 67 100 65 000 -3 15 42 Japan 108 500 97 700 65 500 55 700 59 100 66 800 63 600 -5 13 -38 Norway 43 900 49 300 48 900 56 800 61 600 59 900 .. .. -3 36 Belgium 50 300 51 200 64 500 61 500 61 800 58 900 .. .. -5 17 Korea 44 200 39 000 36 700 51 100 56 900 55 500 66 700 20 -2 26 Denmark 30 300 45 600 38 400 42 400 41 300 43 800 52 400 20 6 45 New Zealand 51 700 51 200 47 500 48 500 44 500 42 700 44 400 4 -4 -17 Ireland 120 400 89 700 50 700 23 900 33 700 32 100 40 200 25 -5 -73 Portugal 42 800 71 000 57 300 43 800 36 900 30 700 27 000 -12 -17 -28 Czech Republic 98 800 71 800 39 000 30 500 22 600 30 300 .. .. 34 -69 Finland 17 500 19 900 18 100 18 200 20 400 23 300 .. .. 14 33 Mexico 6 800 15 100 23 900 26 400 21 700 21 000 | 54 400 159 -3 209 Total number of persons
All countries 4 474 200 4 180 300 3 921 700 3 818 700 3 812 600 3 782 900 3 824 000 1.1 -1 -15 Settlement countries 1 532 800 1 611 400 1 650 900 1 579 600 1 574 100 1 576 700 1 546 400 -2 0 3 EU included above 2 615 900 2 228 300 1 981 200 1 934 100 1 914 900 1 877 800 .. .. -2 -28 EU free movements 1 215 700 899 900 734 900 739 300 831 600 929 600 .. .. 12 -24 Annual % change All countries .. -7 -6 -3 -0.2 -0.8 1.1 .. .. .. Settlement countries .. 5 2 -4 -0.3 0.2 -1.9 .. .. .. EU included above .. -15 -11 -2 -1.0 -1.9 .. .. .. .. EU free movements .. -26 -18 1 12 12 .. .. .. ..
National statistics (unstandardised)
Chile 79 400 68 400 57 100 63 900 76 300 100 100 132 100 32 31 26 Poland 40 600 41 800 41 300 41 100 41 300 47 100 .. .. 14 16 Hungary 22 600 35 500 25 600 23 900 22 500 20 300 .. .. -10 -10 Luxembourg 15 800 16 800 14 600 15 800 19 100 19 400 20 000 3 2 23 Greece 46 300 42 900 46 500 33 400 23 200 17 700 .. .. -24 -62 Slovenia 30 500 43 800 24 100 11 200 18 000 17 300 .. .. -4 -43 Israel 18 100 13 700 14 600 16 600 16 900 16 600 16 900 2 -2 -8 Slovak Republic 14 800 16 500 14 400 12 700 8 200 | 2 900 .. .. .. .. Iceland 9 300 7 500 3 400 3 000 2 800 2 800 3 900 39 0 -70 Estonia 2 000 1 900 2 200 1 200 1 700 1 100 1 600 45 -35 -45 Turkey .. .. .. 29 900 .. .. .. .. .. ..
Total (except Slovenia, Turkey) 279 400 288 800 243 800 222 800 230 000 245 300 .. .. .. ..
Evolution of immigration since the financial crisis
While data for 2013 are not yet fully available for all OECD countries, a complete picture is available for 2012, when flows of international migrants saw a modest fall of 0.8% compared with 2011. After reaching a low in 2009 following the financial crisis, permanent immigration has slowly recovered, though flows are still below the 2007 level of 4.5 million. The high number of migrants in 2007 reflects the pre-crisis situation, but also the first effects of the EU enlargement to Romania and Bulgaria. The numbers were temporarily inflated by large additional numbers of migrants from these two countries recorded in some countries, most notably in Italy. The modest fall in overall flows during 2012 reflected the slow pace of the economic recovery as well as the situation in some EU countries and continuing caution shown by employers in hiring overseas workers.
In Europe in 2012, flows from “third countries” (countries outside the EU area) dropped to about 950 000, from a high of 1.4 million in 2007. And, for the first time in 2012, intra-EU migration in Europe recorded flows equal to those from third countries. Migration from third countries to Europe is now slightly lower than legal migration to the United States. In settlement countries, the effects of the financial crisis on permanent migration flows are more modest and flows since 2007 have been relatively stable, except in Australia where migration increased more or less continuously during the past five years.
When comparing the inflows in 2012 with the previous five years (Figure 1.1), one observes that a number of countries such as Germany, Austria, Finland and Korea, have experienced significant growth in migration flows they receive. The declining flows to some countries such as Spain, Italy and the United Kingdom, that have traditionally been large recipients of international migrants, has driven down the number of international migrants arriving in the OECD as a whole.
Figure 1.1. Change in permanent flows between 2007-11 average and 2012
Percentages
Note:The average refers to the countries presented.
Source: OECD International Migration Database.
1 2 http://dx.doi.org/10.1787/888933157287 -60 -40 -20 0 20 40 60 80 Irela nd Czec h Rep ublic Italy Por tugal Spain Unite d Kin gdom Japan New Zealand Unite d Sta tes Aver age Belg ium Cana da Swit zerla nd Nethe rlands Den mar k Mexi co Fran ce Norw ay Swed en Aus tralia Kor ea Finl and Aus tria Germ any
Trends in the composition of migration flows
Family migration continues to account for the bulk of overall migration flows, despite an ongoing downward trend in this category since 2008 (Figure 1.2). In 2012, family migration dropped marginally (-1.7%) from 2011, mainly due to decreases in Spain, Italy, the United States and the United Kingdom. Family motives continue to account for the vast majority of migrant inflows into the United States, and are also the main category in France.
Labour migration has declined continuously since the economic downturn and fell by 12% in 2012. The fall in labour migration has been considerable, especially among European OECD countries, where it has fallen by almost 40% between 2007 and 2012 (Figure 1.3). This fall is largely driven by reduced inflows to Spain and Italy where economic conditions remain unfavourable. However, even excluding these two large receiving countries, the remaining European OECD countries have nonetheless observed a 10% decrease since 2009. Several countries experienced an increase in the number of labour migrants they received in 2012 including Australia and Canada where labour migrant inflows increased by 6%, as well as Japan which showed a sharp increase of 21%.
On average, there was little change in the number of family members accompanying workers. Interestingly, despite the reduced inflows of labour migration, family migrants accompanying workers represent the only group whose numbers stand at a level higher than they were in 2007.
The overall fall in labour migration, however, does not tell the full story of migration for employment, as substantial work-related migration occurs within the framework of free
Figure 1.2. Permanent immigration in OECD countries by category of entry, standardised statistics, 2007-12
Millions
Note:Excludes the Czech Republic and the countries for which standardised data are not available (see Table 1.1).
Source: OECD International Migration Database.
1 2 http://dx.doi.org/10.1787/888933157291 2007 2008 2009 2010 2011 2012 0 0.2 0.4 0.6 0.8 1.0 1.2 1.4 1.6
Work Accompanying Family Humanitarian Other Free movements family of workers
significant in a number of other European countries that receive little non-EU/EFTA labour migration (see Figure 3.1 in Chapter 3). This is the case in Austria, Germany, Ireland, Belgium and Denmark but also, and especially in the non-EU countries of Switzerland and Norway. In the traditional settlement countries of Canada, Australia and New Zealand, about 25% of inflows of permanent migrants are primary applicants under the economic, skill or employment channels.3
Mobility within the EU/EFTA zone greatly increased following the EU enlargements of 2004 and 2007. Furthermore, the expansion of the EU has added to labour markets’ adjustment capacity and recent estimates suggest that as much as a quarter of the asymmetric labour market shock – that is occurring at different times and with different intensities across countries – may have been absorbed by migration within a year (Jauer et al., 2014).
The key driver of current inflows is the rebound, observed since 2010, in free-movement migration, with an increase of 12% in 2012. Much of this is driven by Germany, which has risen to become the single most important destination for free-mobility migrants. Within the EU/EFTA, Germany alone receives almost a third of all free-movement flows, followed by Spain and Italy. For several EU/EFTA countries, such as Switzerland, Austria, Germany, Ireland, and the Netherlands, free movement accounts for the vast majority, over two-thirds, of permanent inflows. Elsewhere, free movement of citizens between Australia and New Zealand under the Trans-Tasman Travel Agreement, sees Australia receiving more migrants than New Zealand.
Looking at migration flows relative to the total population, in 2012, OECD countries received on average about six permanent migrants for every thousand persons in the population (Figure 1.4). For some large countries such as Mexico and Japan, this figure remains low at less than one migrant per thousand, while for many countries in Europe as well, as in the settlement countries it is above the average. Switzerland, a large recipient of free movement flows, stands apart with almost 16 migrant entries per thousand population, followed by Norway.
Figure 1.3. Labour migration to Europe
Thousands
Source: OECD International Migration Database.
1 2 http://dx.doi.org/10.1787/888933157309 0 100 200 300 400 500 600 2007 2008 2009 2010 2011 2012 EU OECD countries + Switzerland + Norway Without Spain and Italy
The EU/OECD (based on the countries for which data are available), taken as a whole – i.e. excluding intra-EU movements – received 2.5 permanent migrants per thousand population, while in the United States, this ratio stood at 3.2.
In 2012, humanitarian migration flows declined by 6% in the OECD area. This decrease was largely driven by decreases seen in the United States, Canada and the Netherlands. In contrast, Sweden witnessed its third consecutive rise in humanitarian migration absorbing 1 800 humanitarian migrants per million inhabitants. Norway and Canada also admitted a large number of humanitarian migrants, absorbing 1 150, and 920, humanitarian migrants per million inhabitants respectively – this is well above the OECD average of 455.4 Humanitarian migrants in settlement countries are largely made up of resettled refugees. Indeed, settlement countries account for 68% of such flows into the OECD, with the remainder mostly going to Northern European OECD countries. However, when it comes to those migrants who obtained humanitarian status through the asylum channel, European OECD countries account for around three-quarters of the total, and the settlement countries account only for 16%.5
Temporary labour migration
Temporary labour migration is a much larger phenomenon than permanent labour migration and tends to reflect the prevailing economic conditions and short-term changes in demand for labour and skills. Flows, which had been rising through the 2000s, reached a high of 2.5 million in 2007 and have fallen since then. In 2012, such flows stood at just 75%
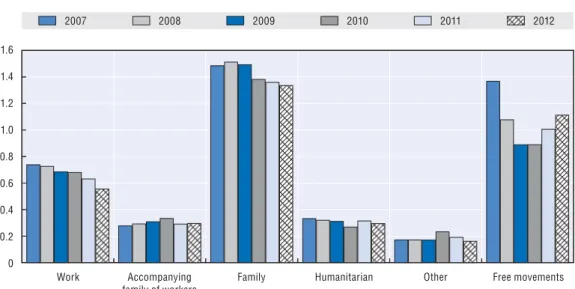
Figure 1.4. Permanent immigration by category of entry or of status change into selected OECD countries, 2012
Percentage of the total population
Source: OECD International Migration Database.
1 2 http://dx.doi.org/10.1787/888933157312 0 0.2 0.4 0.6 0.8 1.0 1.2 1.4 1.6
Other Free movement Humanitarian
Work Accompanying family of workers
2011 total Family Mexi co Japan Kor ea EU-O ECD Por tugal Unite d Sta tes Fran ce Italy Finl and Unite d Kin gdom Germ any Belg ium Nethe rlands Spai n OECD aver age Irela nd Cana da Den mar k Aus tria Swed en New ZealandAus tralia Norw ay Swit zerla nd
The situation in 2012 compared with previous years shows some shifts across entry categories as well as within countries. The Working Holiday Schemes (WHSs) – more established in the traditional settlement countries – have the primary objective of fostering cultural connections and international goodwill by providing short-term work for young people. The settlement countries account for the bulk of these young global holiday makers – around 90% between 2007-12 – with the remainder going largely to the United Kingdom and Japan. The flows of WHS workers have increased by 10% (38 000) from 2007, however, more than half of this increase is driven by increased WHS flows to Australia. Over the same period, an increase of 82% was observed in Canada and of 43% in New Zealand. In contrast, the United States – the main destination country in this category in 2007 – has experienced a decrease in the number of WHS entries from 148 000 in 2007 to 80 000 in 2012.7
Seasonal workers, who numbered over half a million in 2007, have fallen by 64% between 2007 and 2012. The main reason behind this substantial drop is the fact that seasonal workers from new EU countries no longer require a permit to work in EU countries (in particular Germany). Further, two of those countries that, previously, received large numbers of seasonal labour migrants from outside of the EU – Italy and Spain – now each receive less than 10 000 annually. In other OECD countries, seasonal worker flows were stable.
Table 1.2. Temporary-type labour migration, by category, 2007-12
2007 2008 2009 2010 2011 2012 2012/11 2012/07 2012/07 Thousands Change (%) Index = 100
in 2007 Intra-company transfers OECD total 110 117 106 124 130 126 -3 15 115
United States 85 84 65 75 71 62 -12 -26 74 United Kingdom .. .. 13 18 21 23 8 72 172
Canada 9 10 10 14 13 14 .. 47 147
Australia .. 7 6 4 8 10 23 46 146
Germany 5 6 4 6 7 7 2 33 133
Seasonal workers OECD total 571 577 520 505 356 203 -43 -64 36 United States 51 64 60 56 55 65 18 29 129
Canada 23 28 23 24 25 25 4 13 113
Mexico 28 23 31 29 28 23 -16 -16 84
Finland 14 12 13 12 12 14 17 .. 100
Belgium 17 20 5 6 6 10 60 -39 61
Trainees OECD total 164 146 114 108 114 117 2 -29 71
Japan 102 102 80 78 82 86 4 -16 84
Korea 14 14 11 12 13 12 -8 -14 86
Germany 5 5 5 5 5 4 -17 -15 85
Australia 6 5 5 4 3 4 10 -40 60
United States 3 3 2 2 2 3 39 -5 95
Working holiday makers OECD total 397 431 423 419 414 435 5 10 110 Australia 135 154 188 176 185 215 16 59 159 United States 148 153 116 118 98 80 -18 -46 54
Canada 32 41 45 50 55 59 8 82 182
New Zealand 36 40 41 45 45 51 13 43 143 United Kingdom 39 35 25 21 21 20 -5 -50 50 Other temporary workers OECD total 1 285 1 234 928 913 945 992 5 -23 77
Total 2 526 2 505 2 091 2 069 1 958 1 873 -4 -26 74
Note:The table includes all the countries for which standardised data are available (see Table 1.1) except the Czech Republic.
Source: OECD International Migration Database.
Intra-company transfers (ICTs) have increased by 15% since 2007, indicating sustained global business demand for specific skills. The United States continues to be the major destination for such transfer workers, although the number of entries declined slightly in 2012. Europe has seen approximately 16 500 ICT entries in 2012 – corresponding to about 4% of temporary migrant workers. In 2014, the EU adopted a council directive (2010/0209) that aims, among other objectives, at facilitating the temporary assignment of highly-skilled employees of international companies to subsidiaries situated in the EU. The United Kingdom, which is one of the main destinations for ICT workers, did not opt into the EU directive.
Asylum seeking
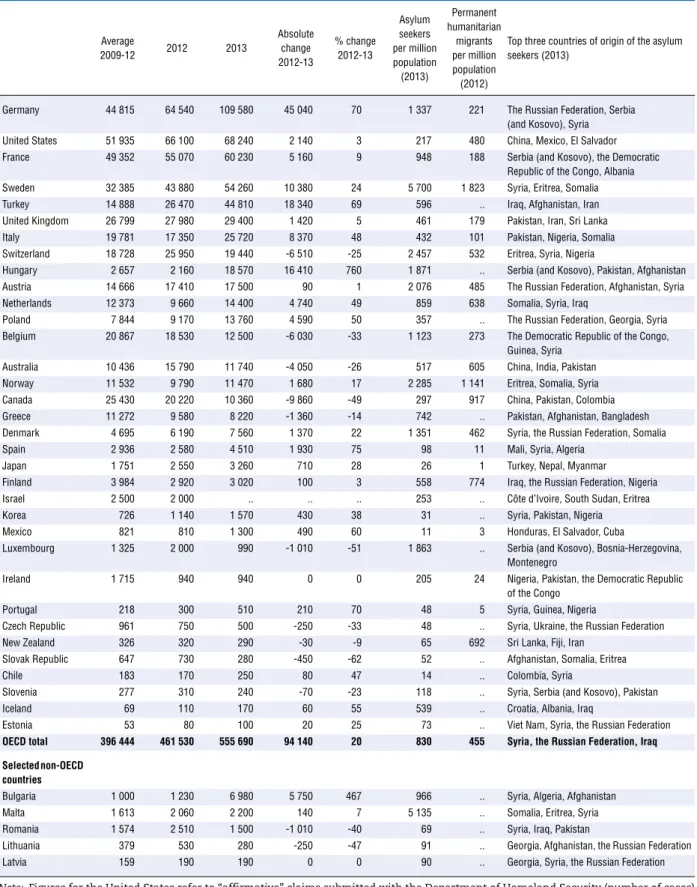
In 2013, 556 000 persons sought asylum in the OECD, a 20% increase from the previous year (Table 1.3). This growth in the numbers of asylum seekers stems mostly from the continuing situation in Syria. Not surprisingly Syria, with 47 800 asylum seekers, overtook Afghanistan (34 500) as the major country of origin of asylum seekers. At the same time, the number of asylum seekers from the Russian Federation, Iraq, Afghanistan and Serbia (and Kosovo) has increased considerably, and levels originating from these countries now reach approximately 35-40 000 each.
Germany has emerged as the world’s largest single recipient of new asylum claims and, in 2013, recorded its sixth consecutive annual increase. The main origin countries of asylum seekers in Germany were the Russian Federation, Serbia (and Kosovo) and Syria. Following Germany, the United States, France, Sweden and Turkey also received a large number of asylum seekers. The number of asylum seekers has increased substantially in Turkey as a result of the arrival of asylum seekers from Iraq, Afghanistan and Iran. Hungary also saw significant increase in the number of asylum seekers, recording 18 900 asylum applications in 2013, eight times as many as in 2012. Most of these were from Serbia (and Kosovo), Pakistan and Afghanistan.
When comparing asylum inflows on a per capita basis, all major receiving countries are in Europe, namely Sweden, Luxembourg, Switzerland, Austria, Norway and Denmark. Sweden – with about 5 700 asylum seekers per million of the population – hosts the most asylum seekers on a per capita basis, with most asylum seekers coming from Syria, Eritrea and Somalia. While typically the smaller countries have had the highest per capita asylum flows, two large countries – Germany (1 340) and France (950) – host more than the OECD average of 830 asylum seekers per million inhabitants.
Preliminary data for the first five months of 2014 suggest that some of the countries receiving the largest numbers of asylum seekers are receiving substantially more asylum seekers than in the same period the previous year. Much of this is due to the conflict in Syria which started in 2011. During this 5-month period, Germany has received 53 600 (about 20% of whom are from Syria), followed by the United States (30 560), France (24 400), Sweden (23 800), and Turkey (19 300). Syria now accounts for about 15% of asylum flows directed to the OECD (Figure 1.5).
Table 1.3. Inflows of asylum seekers by country of destination, 2009-13 Average 2009-12 2012 2013 Absolute change 2012-13 % change 2012-13 Asylum seekers per million population (2013) Permanent humanitarian migrants per million population (2012)
Top three countries of origin of the asylum seekers (2013)
Germany 44 815 64 540 109 580 45 040 70 1 337 221 The Russian Federation, Serbia (and Kosovo), Syria United States 51 935 66 100 68 240 2 140 3 217 480 China, Mexico, El Salvador France 49 352 55 070 60 230 5 160 9 948 188 Serbia (and Kosovo), the Democratic
Republic of the Congo, Albania Sweden 32 385 43 880 54 260 10 380 24 5 700 1 823 Syria, Eritrea, Somalia Turkey 14 888 26 470 44 810 18 340 69 596 .. Iraq, Afghanistan, Iran United Kingdom 26 799 27 980 29 400 1 420 5 461 179 Pakistan, Iran, Sri Lanka Italy 19 781 17 350 25 720 8 370 48 432 101 Pakistan, Nigeria, Somalia Switzerland 18 728 25 950 19 440 -6 510 -25 2 457 532 Eritrea, Syria, Nigeria
Hungary 2 657 2 160 18 570 16 410 760 1 871 .. Serbia (and Kosovo), Pakistan, Afghanistan Austria 14 666 17 410 17 500 90 1 2 076 485 The Russian Federation, Afghanistan, Syria Netherlands 12 373 9 660 14 400 4 740 49 859 638 Somalia, Syria, Iraq
Poland 7 844 9 170 13 760 4 590 50 357 .. The Russian Federation, Georgia, Syria Belgium 20 867 18 530 12 500 -6 030 -33 1 123 273 The Democratic Republic of the Congo,
Guinea, Syria Australia 10 436 15 790 11 740 -4 050 -26 517 605 China, India, Pakistan Norway 11 532 9 790 11 470 1 680 17 2 285 1 141 Eritrea, Somalia, Syria Canada 25 430 20 220 10 360 -9 860 -49 297 917 China, Pakistan, Colombia Greece 11 272 9 580 8 220 -1 360 -14 742 .. Pakistan, Afghanistan, Bangladesh Denmark 4 695 6 190 7 560 1 370 22 1 351 462 Syria, the Russian Federation, Somalia Spain 2 936 2 580 4 510 1 930 75 98 11 Mali, Syria, Algeria
Japan 1 751 2 550 3 260 710 28 26 1 Turkey, Nepal, Myanmar
Finland 3 984 2 920 3 020 100 3 558 774 Iraq, the Russian Federation, Nigeria Israel 2 500 2 000 .. .. .. 253 .. Côte d’Ivoire, South Sudan, Eritrea Korea 726 1 140 1 570 430 38 31 .. Syria, Pakistan, Nigeria Mexico 821 810 1 300 490 60 11 3 Honduras, El Salvador, Cuba
Luxembourg 1 325 2 000 990 -1 010 -51 1 863 .. Serbia (and Kosovo), Bosnia-Herzegovina, Montenegro
Ireland 1 715 940 940 0 0 205 24 Nigeria, Pakistan, the Democratic Republic of the Congo
Portugal 218 300 510 210 70 48 5 Syria, Guinea, Nigeria
Czech Republic 961 750 500 -250 -33 48 .. Syria, Ukraine, the Russian Federation New Zealand 326 320 290 -30 -9 65 692 Sri Lanka, Fiji, Iran
Slovak Republic 647 730 280 -450 -62 52 .. Afghanistan, Somalia, Eritrea
Chile 183 170 250 80 47 14 .. Colombia, Syria
Slovenia 277 310 240 -70 -23 118 .. Syria, Serbia (and Kosovo), Pakistan Iceland 69 110 170 60 55 539 .. Croatia, Albania, Iraq
Estonia 53 80 100 20 25 73 .. Viet Nam, Syria, the Russian Federation
OECD total 396 444 461 530 555 690 94 140 20 830 455 Syria, the Russian Federation, Iraq
Selected non-OECD countries
Bulgaria 1 000 1 230 6 980 5 750 467 966 .. Syria, Algeria, Afghanistan Malta 1 613 2 060 2 200 140 7 5 135 .. Somalia, Eritrea, Syria Romania 1 574 2 510 1 500 -1 010 -40 69 .. Syria, Iraq, Pakistan
Lithuania 379 530 280 -250 -47 91 .. Georgia, Afghanistan, the Russian Federation Latvia 159 190 190 0 0 90 .. Georgia, Syria, the Russian Federation
Note:Figures for the United States refer to “affirmative” claims submitted with the Department of Homeland Security (number of cases) and “defensive” claims submitted to the Executive Office for Immigration Review (number of individuals).
Source:UNHCR.
Figure 1.5. New Syrian asylum seekers in 44 industrialised countries by quarter, 2011-14
Thousands
Note:The 44 countries are the 28 member states of the EU, Albania, Bosnia and Herzegovina, Iceland, Liechtenstein, Montenegro, Norway, Serbia (and Kosovo), Switzerland, the Former Yugoslav Republic of Macedonia (FYROM), Turkey, Australia, Canada, Japan, New Zealand, Korea and the United States. This group of 44 countries received an estimated 612 700 new asylum applications in 2013.
Source:UNHCR.
1 2 http://dx.doi.org/10.1787/888933157329
Figure 1.6. Foreign students worldwide and in OECD countries, 2000-12
Millions
Note:Note that Figure 1.6 refers to foreign students, that is, students of foreign nationality, which is not necessarily the same as international students who are defined as students who are those who left their country of origin and moved to another country to study. Unfortunately, data on international students are not available for most countries before 2008.
Source:OECD,Education Database.
2011 2012 2013 2014 0 5 10 15 20 25 Q1 Q2 Q3 Q4 Q1 Q2 Q3 Q4 Q1 Q2 Q3 Q4 Q1 2000 2001 2002 2003 2004 2005 2006 2007 2008 2009 2010 2011 2012 1.6 1.6 1.9 2.1 2.3 2.4 2.4 2.5 2.6 2.8 3.2 3.3 3.4 2.1 2.1 2.4 2.6 2.8 3.0 3.1 3.2 3.5 3.8 4.2 4.4 4.5
number of students enrolled outside their country of citizenship has more than doubled since 2000, reaching 4.5 million in 2012. The share of those enrolled in an OECD country remained relatively stable and stood at 75% in 2012.
However, the pace of growth seems to be slowing down. The number of international students in OECD countries increased by only 3% in 2012 (Table 1.4), in comparison with average annual growth rates of 8% between 2000 and 2005, and 6% between 2005 and 2011.
Table 1.4. International tertiary-level students in OECD countries, 2012
International/foreign students Foreign students
Category 2012 Change from 2011 (%) Share in total tertiary enrolment 2012 (%) Market share 2012 (%) Difference with 2000 (% points) Share of students from OECD countries 2012 (%) Difference with 2004 (% points) Australia International 249 588 -5.0 18.3 5.5 0.45 12.6 -0.6 Austria International 58 019 9.4 15.4 1.7 0.24 72.5 3.9 Belgium International 42 926 13.4 9.0 1.2 -0.62 67.6 7.8 Canada International 120 960 13.8 8.2 4.9 0.37 24.1 0.3 Chile International 3 461 17.8 0.3 0.3 0.11 10.1 10.1 Czech Republic Foreign 39 455 3.7 9.0 0.9 0.61 73.1 9.3 Denmark International 22 363 10.4 8.1 0.7 0.10 62.7 2.1 Estonia International 1 573 10.0 2.3 0.1 0.02 37.6 .. Finland International 15 636 10.7 5.1 0.4 0.12 27.9 -12.3 France Foreign 271 399 1.2 11.8 6.0 -0.57 23.3 -0.9 Germany International 184 594 4.5 .. 6.3 -2.61 47.5 1.0 Greece Foreign 29 012 -11.6 4.4 0.6 0.23 6.2 3.6 Hungary International 17 520 6.4 4.6 0.4 -0.03 53.7 5.7 Iceland International 971 -11.6 5.1 0.0 0.01 80.3 10.6 Ireland International 11 100 -12.6 5.8 0.6 0.26 52.6 .. Israel Foreign 4 506 14.2 1.2 0.1 .. 86.0 .. Italy Foreign 77 732 5.8 4.0 1.7 0.52 20.5 -20.3 Japan International 136 215 -1.7 3.5 3.3 0.14 19.7 -3.6 Korea Foreign 59 472 -5.1 1.8 1.3 1.15 5.8 -9.9 Luxembourg International 2 468 10.9 40.6 0.1 0.04 80.3 .. Mexico Foreign .. .. .. 0.0 -0.07 .. .. Netherlands International 57 509 49.9 7.2 1.4 0.71 71.6 11.2 New Zealand International 40 994 0.3 15.8 1.6 1.22 31.4 11.1 Norway International 3 956 16.1 1.7 0.4 -0.01 49.1 -4.3 Poland International 23 525 13.6 1.2 0.6 0.28 36.0 9.1 Portugal International 18 525 38.7 4.7 0.6 0.10 32.1 12.3 Slovak Republic International 9 059 3.6 4.1 0.2 0.13 84.7 30.8 Slovenia International 2 357 19.3 2.3 0.1 0.04 14.9 .. Spain International 55 759 -11.0 2.8 2.2 0.21 34.7 -2.8 Sweden International 28 629 -21.6 6.3 0.9 -0.29 43.2 -30.3 Switzerland International 44 468 6.4 16.5 1.4 0.17 70.9 -2.8 Turkey Foreign 38 590 24.0 0.9 0.9 0.01 14.5 -0.8 United Kingdom International 427 686 1.8 17.1 12.6 1.88 37.3 -7.3 United States International 740 475 4.4 3.5 16.4 -6.41 28.0 -8.3
OECD 2 840 502 3.1 7.6 75.4 -1.52 33.6 -2.2
Source:OECD,Education Database.
Where the Netherlands, Portugal and Turkey observed considerable increase of their international student population in 2012, the number in Sweden declined by more than 20%. And, while it remains a large destination country for international students, the number studying in Australia also declined by 5%. In contrast, the number of international students studying in Canada and the United States increased by 14% and 4% respectively and France and the United Kingdom also saw increases, of 1.2% and 1.8%, respectively.
In spite of the increase in international students studying in the United States, its share in the global market for international tertiary education has dropped significantly since 2000 – standing at just 16% in 2012. Nevertheless, the United States, followed by the United Kingdom, continues to be the most popular destination for international students. Apart from the United States, all English-speaking OECD countries and Spain have increased their global market share, whereas that of France, Germany and Japan has declined.
International students account, on average, for around 8% of all tertiary students in OECD countries. This share varies widely, ranging from 1% in Poland to over 40% in Luxembourg. International students represent between 15% and 20% of the overall student population in Australia, the United Kingdom, Switzerland, New Zealand and Austria.
More than half of international students in OECD countries come from Asia. China now represents 22% of all international students in OECD countries, up 4 percentage points from 2008 (Figure 1.7). India remains the second main origin country though its share has declined to under 6%. Saudi Arabia on the other hand, has seen its contribution to the international student population double in four years and, in 2012, had more than 50 000 citizens studying in OECD countries – more than half of them in the United States. The main non-Asian countries sending international students are Germany and France. Overall, 30% of all international students in OECD countries are from another OECD country. This proportion remains virtually unchanged since 2008.
Figure 1.7. Main countries of origin of the international students in tertiary education of OECD countries, 2008 and 2012
Percentages 2008 2012 0 5 10 15 20 25 Chin a Indi a Germany Kor ea Fran ce i Ara bia Viet Nam Mala ysia d Sta tes Italy Cana da Moroc co erat ion c Japan
Origin country of international migrants
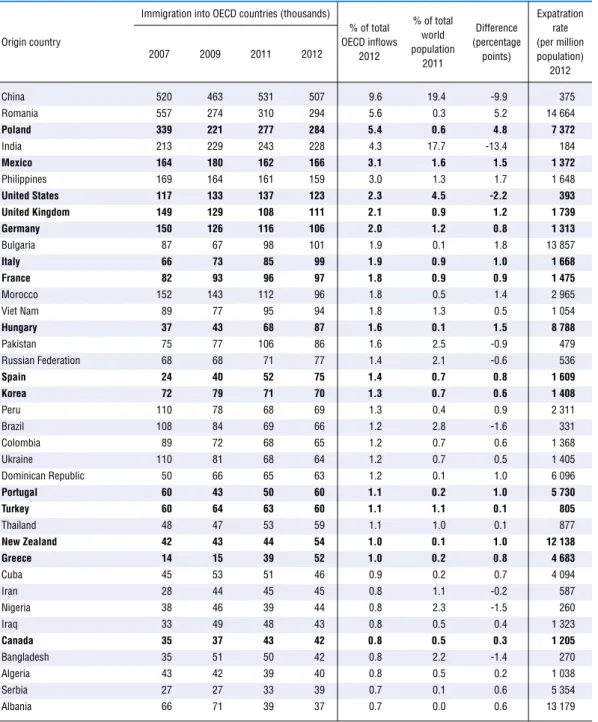
Turning to the origin of all international migrants to the OECD, China remains the country sending the largest number of international migrants. With a little over half a million emigrants, China contributed 9.6% of all flows in 2012 (Table 1.5). As almost every fifth person in the world is a Chinese, it is thus still underrepresented among migration flows to the OECD. India, the second most populated country, accounts for a much smaller percentage than China in total migration flows to the OECD (4.3%). This percentage goes down to 2.3% in the case of the United States, the third most populated country.
Table 1.5. Immigration into OECD countries, top 50 countries of origin, 2007, 2009, 2011 and 2012
Origin country
Immigration into OECD countries (thousands)
% of total OECD inflows 2012 % of total world population 2011 Difference (percentage points) Expatration rate (per million population) 2012 2007 2009 2011 2012 China 520 463 531 507 9.6 19.4 -9.9 375 Romania 557 274 310 294 5.6 0.3 5.2 14 664 Poland 339 221 277 284 5.4 0.6 4.8 7 372 India 213 229 243 228 4.3 17.7 -13.4 184 Mexico 164 180 162 166 3.1 1.6 1.5 1 372 Philippines 169 164 161 159 3.0 1.3 1.7 1 648 United States 117 133 137 123 2.3 4.5 -2.2 393 United Kingdom 149 129 108 111 2.1 0.9 1.2 1 739 Germany 150 126 116 106 2.0 1.2 0.8 1 313 Bulgaria 87 67 98 101 1.9 0.1 1.8 13 857 Italy 66 73 85 99 1.9 0.9 1.0 1 668 France 82 93 96 97 1.8 0.9 0.9 1 475 Morocco 152 143 112 96 1.8 0.5 1.4 2 965 Viet Nam 89 77 95 94 1.8 1.3 0.5 1 054 Hungary 37 43 68 87 1.6 0.1 1.5 8 788 Pakistan 75 77 106 86 1.6 2.5 -0.9 479 Russian Federation 68 68 71 77 1.4 2.1 -0.6 536 Spain 24 40 52 75 1.4 0.7 0.8 1 609 Korea 72 79 71 70 1.3 0.7 0.6 1 408 Peru 110 78 68 69 1.3 0.4 0.9 2 311 Brazil 108 84 69 66 1.2 2.8 -1.6 331 Colombia 89 72 68 65 1.2 0.7 0.6 1 368 Ukraine 110 81 68 64 1.2 0.7 0.5 1 405 Dominican Republic 50 66 65 63 1.2 0.1 1.0 6 096 Portugal 60 43 50 60 1.1 0.2 1.0 5 730 Turkey 60 64 63 60 1.1 1.1 0.1 805 Thailand 48 47 53 59 1.1 1.0 0.1 877 New Zealand 42 43 44 54 1.0 0.1 1.0 12 138 Greece 14 15 39 52 1.0 0.2 0.8 4 683 Cuba 45 53 51 46 0.9 0.2 0.7 4 094 Iran 28 44 45 45 0.8 1.1 -0.2 587 Nigeria 38 46 39 44 0.8 2.3 -1.5 260 Iraq 33 49 48 43 0.8 0.5 0.4 1 323 Canada 35 37 43 42 0.8 0.5 0.3 1 205 Bangladesh 35 51 50 42 0.8 2.2 -1.4 270 Algeria 43 42 39 40 0.8 0.5 0.2 1 038 Serbia 27 27 33 39 0.7 0.1 0.6 5 354 Albania 66 71 39 37 0.7 0.0 0.6 13 179
Romania and Poland, with emigration rates to the OECD of 1.5% and 0.7%, became, respectively, the second and third most important countries of origin of migrants to the OECD. Relative to their population, flows to OECD countries from these countries are thus more than 20 times larger than flows from India and China. Bulgaria replaced Morocco among the top ten origin countries of new flows in 2012. However, aside from this, the list of the top ten origin countries has seen little variation since 2000.
The countries included in Table 1.5 with the highest emigration rates are typically medium size countries, such as Romania, Bulgaria, Hungary, Poland, and New Zealand. Emigration rates from these countries range from 0.7% to 1.5%. What distinguishes these countries from other, smaller, countries with high emigration such as Albania, the Dominican Republic and Cuba, is that the vast majority of their outflows are linked to free movement. Romania and Poland have more or less tripled their outflows since 2000, following their accession to the EU.
Net migration
Net migration among OECD countries remains positive, with the exception of Iceland, Ireland, Mexico, Japan, Poland, Portugal and Spain. However, reflecting the economic conditions since the global slowdown, average net migration has almost halved in recent years – from 4.4 persons per thousand in 2005-08 to 2.6 persons per thousand in 2009-12
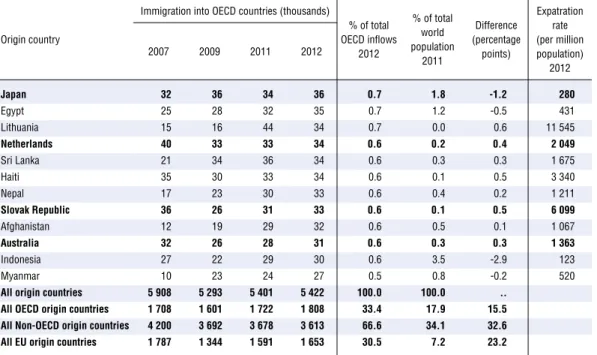
Japan 32 36 34 36 0.7 1.8 -1.2 280 Egypt 25 28 32 35 0.7 1.2 -0.5 431 Lithuania 15 16 44 34 0.7 0.0 0.6 11 545 Netherlands 40 33 33 34 0.6 0.2 0.4 2 049 Sri Lanka 21 34 36 34 0.6 0.3 0.3 1 675 Haiti 35 30 33 34 0.6 0.1 0.5 3 340 Nepal 17 23 30 33 0.6 0.4 0.2 1 211 Slovak Republic 36 26 31 33 0.6 0.1 0.5 6 099 Afghanistan 12 19 29 32 0.6 0.5 0.1 1 067 Australia 32 26 28 31 0.6 0.3 0.3 1 363 Indonesia 27 22 29 30 0.6 3.5 -2.9 123 Myanmar 10 23 24 27 0.5 0.8 -0.2 520
All origin countries 5 908 5 293 5 401 5 422 100.0 100.0 ..
All OECD origin countries 1 708 1 601 1 722 1 808 33.4 17.9 15.5
All Non-OECD origin countries 4 200 3 692 3 678 3 613 66.6 34.1 32.6
All EU origin countries 1 787 1 344 1 591 1 653 30.5 7.2 23.2
Note:Destination country data are not comparable across countries and may include more short-term movements for some countries than for others. Results should therefore be interpreted with caution. Countries in bold are OECD countries.
Source: OECD International Migration Database.
1 2 http://dx.doi.org/10.1787/888933157810
Table 1.5. Immigration into OECD countries, top 50 countries of origin, 2007, 2009, 2011 and 2012(cont.)
Origin country
Immigration into OECD countries (thousands)
% of total OECD inflows 2012 % of total world population 2011 Difference (percentage points) Expatration rate (per million population) 2012 2007 2009 2011 2012
Increases in net migration between these two periods have been particularly strong in the Netherlands, Germany, Finland, Belgium, Denmark, Sweden, Norway and Luxembourg. Luxembourg, experiencing one of the fastest rates of population growth, records very high net migration rates: 16 persons per thousand population per year. Germany, now the second most important destination for permanent migration in the OECD, saw its net migration increase from close to zero in 2005-08 to 370 000 in 2012.
Migration has a negative contribution to the demographic growth in Mexico, Poland and Japan. The former two, as a consequence of being next to a large prosperous neighbour or within a free movement area are characterised by relatively large emigration flows. But both countries have seen the magnitude of migration-related population losses reduce, with fewer migrants leaving and more coming. Iceland and Ireland also have a negative net migration rate of around 0.6%; this largely reflects the impact of the global economic crisis. Some southern European countries (Greece, Portugal and Spain), whose inflows have been consistently decreasing since the financial crisis, now have negative net migration, or net migration close to zero.
Notes
1. Australia, Canada, New Zealand and the United States.
2. These preliminary results are to be taken with caution, as they are based on partial data, and/or estimations for a number of countries. Preliminary data or estimates based on partial data for 2013 are available for 21 countries representing 93% of the migration flows to the OECD area.
3. For more information on the labour component of free-movement migration, please refer to Chapter 3.
Figure 1.8. Average annual net migration rates, 2005-08 and 2009-12
Per thousand population
Note:When 2012 data was not available, the 2009-12 average refers to the average from 2009 to the most recent available year.
Source: OECD International Migration Database.
1 2 http://dx.doi.org/10.1787/888933157350 2005-08 2009-12 -7.5 -5.0 -2.5 0 2.5 5.0 7.5 10.0 12.5 15.0 17.5 Mexi co Nethe
rlandsPolandJapan Germ any Chile Slov ak Republi c Fran ce Por tugal Hun gary New Z eala nd Finl and Uni ted S tate s Den mar k Gree ce Aus tria OECD aver age Belg ium Swed en Czec h Rep ublicItaly Norw ay Cana da Swit zerla nd Aus tralia Irela nd Icel and Luxe mbo urg Spain
4. Australia’s total number of visas granted in 2012-13 under the offshore resettlement component of the programme rose by 87% on the previous year to 12 500. A further 7 500 visa grants were made under the onshore protection component for asylum seekers.
5. Note that there is generally a time-lag between asylum seeking and the status grant of a humanitarian migrant. The rising inflows of asylum seekers to European OECD countries in 2012 may induce an increase in humanitarian migration in the following years.
6. Assuming there was no change in numbers in the countries for which full 2012 data are not available. Countries covered are those for which permit data are available (see Table 1.1) except the Czech Republic.
7. The reduction in the United States coincides with policy changes aimed at tightening procedures to ensure programme integrity and reduce impact on domestic workers as well as increase protection of participants.