1
Macromolecules
Abstract:
There are four broad classes of macromolecules that can be found in living systems. Each type of macromolecule has a characteristic structure and function in living organisms. You can use your knowledge of the basic structure of each macromolecule to perform tests in the lab that detect the presence or absence of key functional groups or overall characteristics in various substances. In this lab, you will utilize the following procedures to detect three of these macromolecules in everyday household items ‐ note what each procedure will detect in which macromolecules.
Test (procedure) Structure/ Molecule Detected:
Structure/Molecule Found in: Benedict’s Reducing sugars (sugars
with a free aldehyde or ketone group; typically mono or disaccharides)
Carbohydrates
Iodine Starch Carbohydrates
Sudan IV Water insoluble substances
Lipids
Biuret’s Peptide Bonds Protein
Table 1. A list of the detection reagents used to reveal the presence of specific macromolecules.
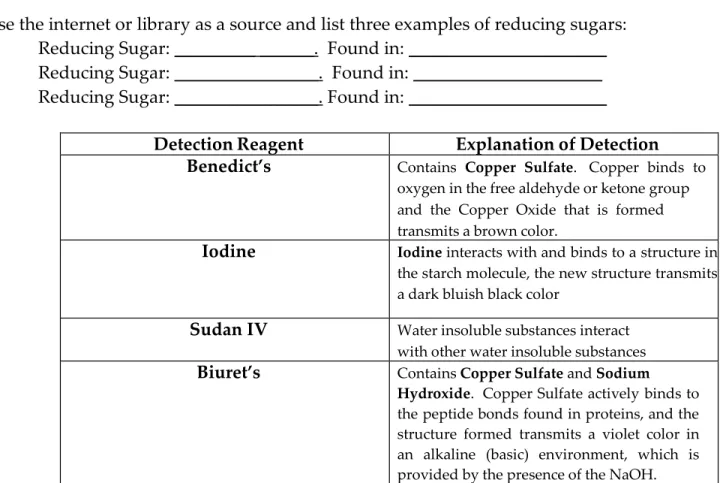
Use the internet or library as a source and list three examples of reducing sugars: a. Reducing Sugar: _________ ______. Found in: ______________________ b. Reducing Sugar: ________________. Found in: _____________________ c. Reducing Sugar: ________________. Found in: ______________________
Detection Reagent Explanation of Detection Benedict’s Contains Copper Sulfate. Copper binds to
oxygen in the free aldehyde or ketone group and the Copper Oxide that is formed transmits a brown color.
Iodine Iodine interacts with and binds to a structure in the starch molecule, the new structure transmits a dark bluish black color
Sudan IV Water insoluble substances interact with other water insoluble substances
Biuret’s Contains Copper Sulfate and Sodium Hydroxide. Copper Sulfate actively binds to the peptide bonds found in proteins, and the structure formed transmits a violet color in an alkaline (basic) environment, which is provided by the presence of the NaOH.
2
Designing Experimental Controls
Because you are going to be testing for the presence of different macromolecules in this lab, there are several important steps that you must first take to ensure that you properly interpret your results. In order for you to know which of the macromolecules are present in your samples, you must initially set up controls. Controls are samples or trials with an outcome that is already known. There are positive controls, which give positive results (Example: In the case of the reducing sugars test, a sample containing a known reducing sugar). There are also negative controls, which give negative results (Example: In the case of the reducing sugars test, a sample that contains no reducing sugars).
For the purpose of this experiment, we have provided you with the following:
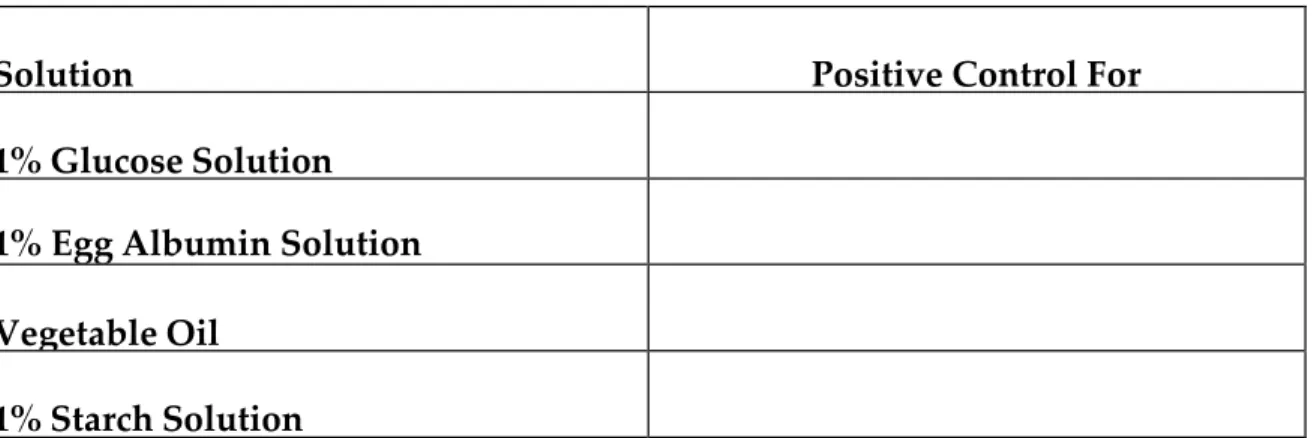
1% Glucose Solution 1% Egg Albumin Vegetable Oil 1% Starch Solution
Each of the above mentioned solutions will be used as a positive control for one of the macromolecule tests. Using the information from above, please state the macromolecule that these controls will help you identify.
Results:
Solution Positive Control For
1% Glucose Solution
1% Egg Albumin Solution
Vegetable Oil
1% Starch Solution
Table 3. Determination of solutions used for positive controls for each type of macromolecule.
3
Further Elucidation of Lipids and Their Chemical Properties
Unfortunately, the relative concentrations of lipids in each of the household substances are too low to detect using any kind of test available in this laboratory setting. Instead, the following experiments are intended to further your understanding about the chemical properties of lipids. Here you will observe the interaction between lipids and water, as well as the detection reagent that is used to indicate the lipid component of your solution. Finally, you will look at the effect that an emulsifier has on lipids. An emulsifier is a substance that has both hydrophobic and hydrophilic properties on different portions of the molecule.
Answer the following questions in preparation for this experiment:
Observe the lipid solution (vegetable oil) provided as your standard. Is it a saturated or unsaturated fat? How do you know?
Materials and Methods:
Sudan IV (Lipids)
Positive Control
1) Label a test tube “L(+)” (which stands for Lipids Positive Control). 2) Fill the tube up to the halfway point with water.
3) Add 10 drops of vegetable oil to the tube.
Where is the oil in the tube?
Negative Control
1) Label a test tube “L(-)“ (which stands for Lipids Negative Control). 2) Fill the tube up to the halfway point with water.
3) Add the equivalent of 10 drops of negative control (water) to the tube.
Adding the Detection Reagent to Both Tubes
4) Shake the tube to mix the contents.
5) Add 5 drops of Sudan IV to the tube and gently shake it again. 6) Place the tube in your test tube rack
4
Compare the positive and negative control. What do you see that distinguishes the lipid + solution from the lipid – solution?
Notice that the Sudan IV seems to associate primarily with the lipids in the positive control tube. What does this tell you about Sudan IV and its solubility in water?
Addition of an Emulsifier
1. Take your tube labeled “L(+)” and add a dropper full of detergent water. 2. Shake the test tube vigorously.
What is the emulsifier that you used in this experiment?
What happens to the oil in the test tube when you add the emulsifier?
What do these results tell you about the solubility of the emulsifier in water?
What do these results suggest about the emulsifier’s ability to interact with the lipids?
Identification of Macromolecules in Everyday Items
In this portion of the lab, you will make a complete set of controls to be used for comparison purposes when you identify macromolecules that exist in everyday items that you use or can be found at the grocery store.
Materials and Methods: Benedict’s (Reducing Sugars)
Positive Control:
1) Label a test tube “RS(+)” (which stands for Reducing Sugar Positive Control) 2) Add 2 ml of Glucose solution to the tube.
Negative Control:
5 All Tubes:
3) Add 2 ml of Benedict’s reagent to each tube. 4) Gently shake each tube to mix the solution.
5) Heat the test tubes for 3 minutes at 100°C (boiling water) in a beaker of water on your hotplate. 6) Remove the tubes from the beaker and place in a test tube rack.
What does a (+) Reducing Sugar test look like ______________ What does a (-) Reducing Sugar test look like: ______________
Starch
Positive Control
1) Label a test tube “S (+)” (which stands for Starch Positive Control). 2) Add 2 ml of Starch solution to the tube.
Negative Control
1) Label a test tube “S (-)“ (which stands for Starch Negative Control). 2) Add 2 ml of the negative control to the tube.
All Tubes
3) Add a dropper full of Iodine to each test tube (NOTE: A dropper full is the amount that goes up into the dropper when you fully squeeze and release the bulb).
4) Gently shake the test tubes.
5) Place the test tubes in your test tube rack.
What does a (+) Starch test look like: ___________________ What does a (-) Starch test look like: ___________________
Biuret’s (Proteins)
Positive Control
1) Label a test tube “P(+)” (which stands for Proteins Positive Control). 2) Add 2 ml of Egg Albumin to the tube.
Negative Control
1) Label a test tube “P(‐)“ (which stands for Proteins Negative Control). 2) Add 2 ml of your negative control to the tube.
All Tubes
1) Add 2ml of to each tube. 2) Gently shake the test tubes.
3) Let the test tubes sit for 2 minutes. 4) Place the tubes in your test tube rack.
6
4.3 Identification of Macromolecules in Household Substances
Now you are ready to test for the presence of macromolecules in various household substances. On the side of the room you will find beakers containing a variety of different substances including: Corn Fakes, Milk, Baby Formula, Sports Drink, Chicken Broth, and Lemon Lime Soda. As a group, select one of the solutions that you wish to test. Make your choices based on your interests! Using available sources plus your knowledge of these solutions and what they are used for, state a hypothesis regarding what macromolecules you believe you will find in these solutions and why.
NOTE: FOR THE REDUCING SUGARS TEST IN SODA AND SPORTS DRINK, RECORD THE RESULT IMMEDIATELY AFTER YOU ADD THE BIURET TO EACH SOLUTION, AND THEN MAKE NOTE OF ANY COLOR CHANGE OBSERVED TEN MINUTES AFTER THE ADDITION OF THE BIURET.
Solution 1:_________________
Write your hypothesis: ____________ will test positive for __________________________,
Because _________________________.
Materials and Methods:
1) Label three test tubes 1 ‐ 3.
2) For test tube 1, place 2 ml of Solution 1 into test tube, follow the previously listed procedure for detection of reducing sugars starting at Step 3.
3) For test tube 2, place 2 ml of Solution 1 into test tube, follow the previously listed procedure for detection of Starch starting at Step 3.
4) For test tube 3, place 2 ml of Solution 1 into test tube, follow the previously listed procedure for detection of Proteins starting at Step 3.
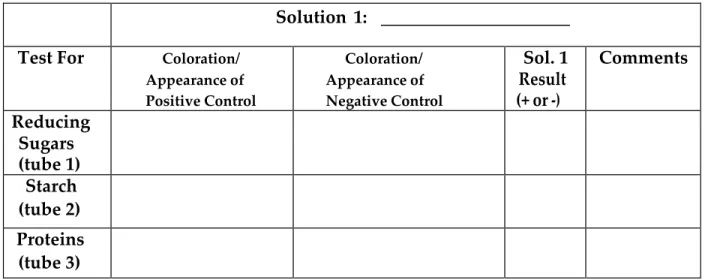
5) Record your findings for Solution 1 in the table below.
Results:
Solution 1: _____________________
Test For Coloration/ Appearance of Positive Control
Coloration/ Appearance of Negative Control
Sol. 1 Result (+ or ‐)
Comments
Reducing Sugars (tube 1) Starch (tube 2)
Proteins (tube 3)
7
Solution 2: ___________________
Write your hypothesis: __________________ will test positive for ____________________
Because ______ _________________.
Materials and Methods:
1) Label three test tubes 4 - 6.
2) For test tube 4, place 2 ml of Solution 2 into test tube, follow the previously listed procedure for detection of reducing sugars starting at Step 3.
3) For test tube 5, place 2 ml of Solution 2 into test tube, follow the previously listed procedure for detection of Starch starting at Step 3.
4) For test tube 6, place 2 ml of Solution 2 into test tube, follow the previously listed procedure for detection of Proteins starting at Step 3.
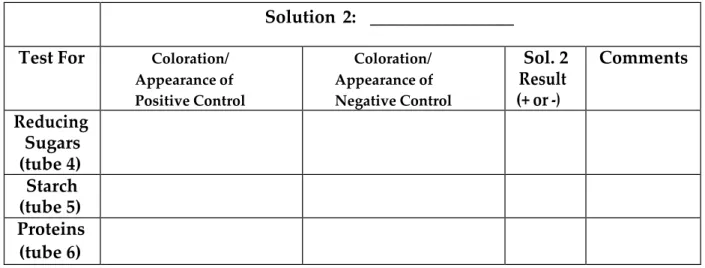
5) Record your findings for Solution 2 in the table below.
Results:
Solution 2: ________________
Test For Coloration/ Appearance of Positive Control
Coloration/ Appearance of Negative Control
Sol. 2 Result (+ or -)
Comments
Reducing Sugars
(tube 4)
Starch
(tube 5)
Proteins (tube 6)
Figure 5. Determination of macromolecules present in _______.
Solution 3: ______ __________________
Write your hypothesis: _______ _____________ will test positive for ______ _______________,
8
Materials and Methods:
1) Label three test tubes 7 - 9.
2) For test tube 7, place 2 ml of Solution 3 into test tube, follow the previously listed procedure for detection of Reducing sugars starting at Step 3.
3) For test tube 8, place 2 ml of Solution 3 into test tube, follow the previously listed procedure for detection of Starch starting at Step 3.
4) For test tube 9, place 2 ml of Solution 3 into test tube, follow the previously listed procedure for detection of Proteins starting at Step 3.
5) Record your findings for Solution 3 in the table below.
Results:
Solution 3: ____________________
Test For Coloration/ Appearance of Positive Control Coloration/ Appearance of Negative Control Sol. 3 Result (+ or -)
Comments Reducing Sugars (tube 7) Starch (tube 8) Proteins (tube 9)
Figure 6. Determination of macromolecules present in ___________.
Gather data about the solutions you did not test from other groups in the laboratory.
Solution: ____________________
Test For Coloration/ Appearance of Positive
Control
Coloration/ Appearance of Negative
Control
Sol. Result (+ or -‐‐)
9
Solution: _________________________
Test For Coloration/
Appearance of
Positive Control
Coloration/
Appearance of
Negative Control
Sol. Result (+ or -)
Comments
Reducing Sugars
Starch
Proteins
Solution: ________________________
Test For Coloration/
Appearance of
Positive Control
Coloration/
Appearance of
Negative Control
Sol. Result (+ or -)
Comments
Reducing Sugars
Starch
Proteins
Conclusions:
__________________________________________________________________________________________
__________________________________________________________________________________________
__________________________________________________________________________________________
10
Points for Discussion:
1. What macromolecule(s) did you find for each of your three solutions?
2. Looking at the results for the solutions that you did, were there any results that surprised you? Why?
3. Looking at the results for the class data regarding all of the solutions, were there any results that surprised you? Why?
4. Were there any differences between groups that did tests on the same solution? If so, what do you think may have caused this difference in results?
If you worked in the health sciences, how could the experiments that you performed here today help you with a patient who had specific dietary needs?
Addressing Unexpected Results
You may have noticed that the colorimetric results in the protein test for both Sports Drink and Lemon Lime soda looked normal initially, but then changed to a color that did not match the expected coloration for either a positive or negative result. It is not uncommon to obtain unexpected results in a laboratory setting. To investigate this phenomenon, you will use what you have learned from previous experiments and the nutritional facts for the soda and the sports drink (provided at the end of this manual). Can you find a common factor in both the soda and the sports drink that will allow you to make a reasonable hypothesis that explains why you observed the unexpected colorations in these two solutions?
Preliminary Research
11
2. What detection agent is used to test for the macromolecule test that you listed in question 1?
3. In Table 2 of this lab, four detection solutions are listed, along with the compounds in each that react with distinct molecules or substances. Are there any common component(s) found between the solution that you listed in question 2 and Biuret? Which component(s)?
4. What types of molecules typically interact with this solution? Are any of these types of molecules found in the soda or sports drink? Which ones?
5. Is there another molecule, found in both the Soda and the Sports Drink that you did not list in your answer to question 4? If so, what is the name of this molecule?
Based on your answers to questions 1 - 4, write a hypothesis that explains why you obtained the unexpected result during your protein test of Soda and Sports Drink.
We hypothesize that the unexpected result that we obtained in soda and sports drink was due to the reaction between ______________ and______________________
To test this hypothesis, you will now perform the following experiment: Materials & Methods:
NOTE: HALF OF THE CLASS CAN PERFORM FRUCTOSE AND GLUCOSE, AND THE OTHER HALF CITRIC ACID AND SUCROSE IF TIME IS LIMITED.
1) Label 8 test tubes in the following manner:
12
2 test tubes labeled: GR and GP 2 test tubes labeled: SR and SP: 2 test tubes labeled: CR and CP 2) Add 2mL of Fructose solution to the tubes labeled FR and FP. 3) Add 2mL of Glucose solution to the tubes labeled GR and GP. 4) Add 2mL of Sucrose solution to the tubes labeled SR and SP. 5) Add 2mL of Citric Acid solution to the tubes labeled CR and CP.
6) Add 2mL of Benedict’s reagent to the tubes labeled FR, GR, SR, and CR.
7) Heat the test tubes from step 6 for 1 minutes at 100°C in a beaker of water on your hotplate. 8) Add 2mL of Biuret Reagent to the test tubes labeled FP, GP, SP, and CP and allow them to incubate on the desktop for 10 minutes. DO NOT HEAT THESE TEST TUBES.
9) Record the results for each tube in Table 10.
Coloration of
Reducing Sugars Test (R)
Coloration of Protein Test (P)
Fructose (F)
Glucose (G)
Sucrose (S)
Citric Acid (C)
Table 10. Results for the coloration of reducing sugars test compared to protein test of Fructose, Glucose, Sucrose, and Citric Acid Solutions.
Conclusions:
__________________________________________________________________________________________
__________________________________________________________________________________________
__________________________________________________________________________________________