DETECTION OF OH
+IN TRANSLUCENT INTERSTELLAR CLOUDS:
NEW ELECTRONIC TRANSITIONS
AND PROBING THE PRIMARY COSMIC RAY IONIZATION RATE*
D. Zhao1, G. A. Galazutdinov2,3, H. Linnartz1, and J. Krełowski4
1
Sackler Laboratory for Astrophysics, Leiden Observatory, University of Leiden, PO Box 9513, 2300 RA Leiden, The Netherlands;[email protected]
2
Instituto de Astronomia, Universidad Catolica del Norte, Av. Angamos 0610, Antofagasta, Chile
3
Pulkovo Observatory, Pulkovskoe Shosse 65, Saint-Petersburg 196140, Russia
4
Center for Astronomy, Nicholas Copernicus University, Gagarina 11, Pl-87-100 Toruń, Poland
Received 2015 February 9; accepted 2015 April 6; published 2015 May 27
ABSTRACT
We present the detection of rotationally resolved electronic transitions in the OH+ A3Π–X3Σ− (0, 0)and (1, 0) bands toward CD-32 4348, HD 63804, HD 78344, and HD 80077. These four translucent clouds have been studied in a recent Very Large Telescope/Ultraviolet and Visual Echelle Spectrograph observational run. In total, seven absorption features of OH+are detected, and six of them are identified here for thefirst time, providing a precise tool to trace OH+in translucent interstellar clouds. An improved set of line positions and oscillator strengthsis compiled to support our data interpretation. A dedicated analysis of the observed features in individual targets
yields an accurate determination of OH+column densities. The results are applied to estimate the primary cosmic
ray ionization rate in the investigated translucent clouds, which yields a typical value of ∼1.0 × 10⁻¹⁶s−1. In addition, following this work, two of the new interstellar features recently reported by Bhatt & Cami, at∼3572.65
and 3346.96 Å, can be identified as OH+absorption lines now.
Key words:ISM: clouds –ISM: lines and bands– ISM: molecules–ultraviolet: ISM
1. INTRODUCTION
The hydroxyl cation OH+ plays a central role in the gas
phase oxygen chemistry of the interstellar medium (ISM), in
particular, in the gas phase formation scheme of water.
Astrochemical models(see the recent reviews by van Dishoeck
et al. 2013 and Tielens 2013 and references therein)suggest
that the gas phase formation of water in the diffuse ISM is driven by ion-neutral reactions, starting from the formation of
OH+. This ion has also been suggested as an important
diagnostic probe for the cosmic ray ionization rate in diffuse/
translucent clouds (Gerin et al. 2010; Neufeld et al. 2010;
Hollenbach et al.2012). The astronomical detection of this ion, however, was only realized after 2010, using the Atacama
Pathfinder Experiment (Wyrowski et al. 2010), the HIFI
instrument on boardthe Herschel Space Observatory (Gerin
et al. 2010; Neufeld et al. 2010)in the submillimeter region,
and the Ultraviolet and Visual Echelle Spectrograph (UVES)
of the Very Large Telescope (VLT) in the near-ultraviolet
(UV; Krełowski et al. 2010). OH+ has also been detected in emission with HIFI/Herschel(see, e.g., Barlow et al.2013; van
der Tak et al. 2013). These observations were immediately
used to infer the cosmic ray ionization rate and to constrain the
oxygen chemistry in the ISM(Hollenbach et al.2012; Indriolo
et al.2012,2015; van der Tak et al.2013; Porras et al.2014).
Thus far, observational detections of OH+ in the near-UV
domain only rely on one weak absorption line at 3583.76 Å with a central absorption depth that istypically less than 0.02 (Krełowski et al.2010; Gredel et al.2011; Porras et al.2014). In this Letter, we present the detection of seven absorption lines of OH+A3Π–X3Σ−(0, 0)and(1, 0)bands in the spectra of four translucent interstellar clouds. A set of molecular parameters, including the newly calculated line oscillator strengths, is
compiled to support our data analysis. A combined analysis of
the known 3583.76 Å line and the newly identified features
allows us to accurately determine OH+ column densities, as
well as to infer the primary cosmic ray ionization rate in translucent clouds.
2. OBSERVATIONS
Observations were made using UVES at the 8 m UT2
telescope (Paranal Observatory, ESO, Chile) from our
observational run in 2014 March (program 092.C-0019(A)).
Two standard modes of UVES, DIC1(346+580) and DIC2
(437–860), were used, covering the whole wavelength range
∼3050–10400 Å with a gap between∼5770 and 5830 Å due to
an inaccurate setting of the optical elements of the spectro-graph. Slit widths of 0″.4 and 0″.3for the blue and red branches, respectively, were applied to satisfy the two pixel criteria for the slit image projection to the corresponding CCD cameras,
providing the highest possible resolving power of∼80,000 for
the blue and∼110,000 for the red spectrograph branches.
Four highly reddened stars, CD-32 4348, HD 63804, HD 78344, and HD 80077, were exposed 12, 13, 10, and 12 times, with integrated exposure times of 9180, 5350, 7950, and 2160 s, respectively, to record their spectra. Individual spectra discussed in this Letter result from averaging all exposures for each target. The spectra were processed in a standard way using
both IRAF packages and our own DECH5codes. As shown in
Figure 1, in all four spectra, both the strong NaI doublet at
∼3302 Å and the relatively weak KIdoublet at 4044.142 and
4047.213 Å lack significant Doppler splittings, and therefore, the wavelength scale of each spectrum has been shifted using the NaIdoublet at∼3302 Å so that interstellar absorption lines
appear at rest wavelengths. © 2015. The American Astronomical Society. All rights reserved.
* Based on observations collected at the European Organisation for Astronomical Research in the southern hemisphere, Chile, under program
3. MOLECULAR DATA
Merer et al.(1975)studied the near-UV spectra of theA3Π– X3Σ−electronic transition system of OH+at high resolution in the laboratory and determined accurate molecular constants. In
Table 1, we summarize the line positions of electronic
transitions from the lowest ground state N=0 level in the
(0, 0)and(1, 0)bands as measured by Merer et al.(1975). The absolute wavelength accuracy is estimated to be better than 0.01 Å.
Recently, Porras et al. (2014) demonstrated that the A3Π– X3Σ−transition oscillator strengths calculated by de Almeida &
Singh(1981)are overestimated, and recommended a value of
f=0.00114 for therR11(0)3583.76 Å line, which is nearly a
factor of three smaller than that in de Almeida & Singh(1981).
Therefore, in this work, oscillator strengths of the OH+
absorption lines listed in Table 1 have been (re)calculated
using Pgopher software.6In our calculation, thefirst step is to
derive an effective 3Π–3Σ− Hamiltonian that reproduces the
experimental (0, 0) and (1, 0) band spectra as measured by
Merer et al. (1975). Because different definitions for the
A3Πv=0 and 1 states are used in Pgopher and in Merer et al. (1975), we refitted the experimental data to determine the input
parameters for A3Πv=0 and 1 states in Pgopher. The
perturbation in the (1, 0) band (Merer et al. 1975; Rodgers
et al. 2007)is also included in the Hamiltonian model. Since
the calculations of Hönl–London factors are built-in in
Pgopher, the determination of absolute line strengths only requires the transition dipole moment as input. We adopted the
A3Π–X3Σ− electronic transition dipole moment (0.3711
Debye) calculated by Merchán et al. (1991), and the Frank–
Condon factor q00=0.626 calculated by de Almeida & Singh
(1981), as these values reproduce well the experimentally
determined radiative lifetime of theA3Πv=0 state(Möhlmann et al. 1978). For the (1, 0)band, it is found that the Frank– Condon factorq10=0.261, calculated by de Almeida & Singh
(1981), cannot reproduce the relative intensities of the two
bands in our observational spectra (see Section 4), nor the
ab initio calculated radiative lifetime of the A3Πv=1 state (Merchán et al.1991). Therefore, we estimateq10from the two
rR
11(0) transitions (3583.76 and 3346.96 Å) in our
observa-tional spectra, which yields q10/q00≈0.71, i.e., q10=0.445.
With these parameters, the effective transition dipole moment
for the (0, 0) and (1, 0) bands is inferred as 0.294 and
0.248 Debye, respectively. The resulting line oscillator
strengths from our calculation are summarized in Table 1. As
can be seen there, our value for the rR11(0) 3583.76 Å line
(f=0.00102)is in good agreement with that recommended by
Porras et al.(2014).
4. RESULTS AND DISCUSSION
To search for the expected absorption features, the spectra of
both bands of OH+ are calculated for different rotational
temperatures Trot ranging from 1 to 8 K in Pgopher. For this
Trotrange, no substantial differences in spectral appearance are
found. This is in agreement with the fact that almost all molecules populate in the N=0 level at low Trot(<8 K), e.g., more than
99% are populated in the N=0 levels at 8 K. At these low
temperatures, all detectable transitions start from the sameN=0 ground state level and their relative line strengths only depend on oscillator strengths. Because the rotational excitation temperatures of polar molecules in translucent clouds usually do not exceed 5 K, the OH+absorption features in the observational spectra can be searched for directly using the calculated spectrum.
Figure 2 shows the spectra of four highly reddened stars
(Table2)in two wavelength regions corresponding to the OH+
A3Π–X3Σ−(0, 0)and (1, 0)bands, respectively. It should be noted that a few very weak features that, at present, cannot be assigned also show up. Here, we focused on features reason-ably overlapping with the accurately predicted OH+spectra. It
can be found from Figure2 that, in addition to the previously
identified 3583.76 Å feature (Krełowski et al. 2010), the
3572.65 Å line of OH+ can be identified in all four spectra.
Another five transition lines of OH+ at 3566.45, 3565.34,
3559.81, 3346.96, and 3337.36 Å can also be recognized in the spectra of CD-32 4348 and HD 63804. To unambiguously identify the relatively weak absorption features, the four spectra are averaged to obtain a higher signal-to-noise ratio(S/N). This superposition spectrum represents an average of nearly 50
exposures. As shown in Figure 2, the overall S/N is clearly
improved compared to individual spectra. The absorption lines of OH+hinted for in the individual spectra now can be clearly
seen in the averaged spectrum, with theintensity pattern of
each band nearly identical to the calculated spectrum,
confirming the origin of these interstellar UV features to be
OH+. The equivalent widths for the two rR11(0) transitions
Figure 1.NaIand KIatomic lines. The wavelength scale of each spectrum has been shifted so that interstellar absorption lines appear at rest wavelengths.
Table 1
Line Positions and Oscillator Strengths of OH+in the Near-UV
(0, 0) (1, 0)
Transition λ(Å) f(10−4) λ(Å) f(10−4)
r
R11(0) 3583.757 10.20 3346.961 7.11
rQ21(0) 3572.649 6.03 3337.358 4.16 s
R21(0) 3566.445 2.29 3332.177 1.66
r
P31(0) 3565.341 2.46 3330.409 1.72
sQ31(0) 3559.807 1.67 3326.368 1.29 t
R31(0) 3553.329 0.09 3319.971 0.06
Note. Positions of the two tR31(0) lines are calculated using molecular constants from Merer et al.(1975).
6
(3583.76 and 3346.96 Å)in the averaged spectrum are used to
estimate the Frank–Condon factor ratio q10/q00 discussed
before. The line equivalent widths in individual spectra are
summarized in Table2. Weak features that are only tentatively
detected in spectra of HD 78344 and HD 80077, i.e., lines with
equivalent widths slightly below the 3σ upper limits, are also
listed in Table2.
It should be noted that, very recently, the 3572.65 Å and
3346.96 Å features, identified as OH+ absorption lines here,
were also detected(but not identified)by Bhatt & Cami(2015)
in an averaged spectrum of a large number of archived VLT/ UVES data. They also reported tentative detections of the 3346.96 Å feature in individual targets of HD 115363, HD 142758, HD 188220, HD 210121, and HD 143448.
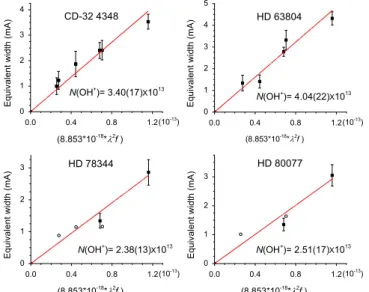
Since all observed transitions(Table2)start from the same
N=0 ground state level, we determine OH+column densities
N(OH+) by a linear fit of equivalent widths (Wλ) to (λ 2f),
using the equation
( )
(
)
W =8.853×10 18∗N OH ∗ λ2f (1)
λ − +
where N(OH+) is in cm−2, Wλ in mÅ, and λ in Å. Figure 3
shows thefitting result for all four targets. The linearity of the
fits for CD-32 4348 and HD 63804 further confirms the
reliability of the newly determined Frank–Condon factor q10.
Moreover, such a linear fit comprising a larger set of
observational data in each target allows one to determine the
OH+column density more precisely than using the 3583.76 Å
line only. The resulting column densities are listed in Table2.
The derived OH+column densities in Table2, subsequently,
offer a diagnostic tool to infer the primary cosmic ray
ionization rate ζp in the studied translucent clouds, using the
approximate equation given by Porras et al.(2014),
(
)
N N
1.33 10 OH (H), (2)
p 8
ζ ≈ × − ∗ +
for typical physical settings corresponding to a UVfield7χ=1
and nH=100 cm−
3
. As in Porras et al. (2014), N(H) (=N (HI)+ 2*N(H2))in Equation (2)is estimated from N(KI) in
each target using the relationship described by Welty & Hobbs (2001). Here we determine N(KI) using the KI doublet at
4044.142 and 4047.213 Å as shown in Figure 1 and the
resultingN(KI)values are given in Table2. It is important to
realize that this procedure may lead to a factor of two
uncertainty in the estimated N(H) values (see Figure 17 in
Welty & Hobbs2001). With this procedure, very similar values ofζp≈1.0±0.2 × 10⁻¹⁶s−1are inferred (see Table 2).
These derived ζp-values are consistent with the more
complete model concerning effects of polycyclic aromatic hydrocarbon species on ionization by Hollenbach et al.(2012).
Their model shows thatN(OH+)approaches a saturation when
the total optical extinctionAv,tis close to and larger than 1.0 in
a diffuse/translucent cloud, in which case the value ofN(OH+) mainly depends on ζp/n2 (the unitless parameter n2=nH/
100 cm−3). Taking the equivalent color excess (E(B−V))
values of our targets(Table2)and the typical total to selective extinction ratio R=3.1, wefind that in all cases Av,tis larger
than 3.0 mag. In this case, we can approximately estimate the
primary cosmic ray ionization rateζp, based on Figures 10 and
11 in Hollenbach et al. (2012). Using our derived values of
N(OH+), we obtain a typical value of
ζp≈1.1±0.3 × 10⁻¹⁶s−1, which is in good agreement with the values listed in Table2.
Our estimation of theζp-value is based on the assumption of a single cloud in the line of sight. However, the absorption line
width of OH+ in all four spectra, typically ∼10 km s−1, is
significantly larger than the instrument resolution of UVES,
suggesting that geometrical effects such as observing several clouds along the line of sight, or viewing the cloud obliquely, cannot be excluded. Because of this and the possible variation of the assumed parametersχandnH, the error of the estimated
ζp-value may actually be much larger. However, we find that
our results are within the range ofζp-values inferred in other diffuse/translucent clouds, e.g.,∼0.6–3.5 × 10⁻¹⁶s−1from HIFI observations of OH+and H2O+ (Neufeld et al.2010; Indriolo
et al.2012,2015), and∼0.3–4.4 × 10⁻¹⁶s−1from detections of
H3+in various diffuse/translucent clouds (Le Petit et al. 2004; Indriolo et al.2007; Indriolo & McCall 2012).
5. CONCLUSIONS
We have presented the detection of the OH+A3Π–X3Σ−
(0, 0) and (1, 0) bands in four translucent interstellar clouds toward CD-32 4348, HD 63804, HD 78344, and HD 80077. In
total, seven absorption features of OH+ are unambiguously
detected in the averaged spectrum of the four sources and six of them are identified for thefirst time. An accurate determination of OH+column densities allows one to infer the primary cosmic ray ionization rate to be of a typical value of∼1.0 × 10⁻¹⁶s−1in the four OH+-rich translucent clouds studied here. Our results allow
Table 2
Targets and Measured Molecular Data
CD-32 4348 HD 63804 HD 78344 HD 80077 Target Propertiesa
Sp/L B7Iab A0Ia(p) O9.5Ia B2Ia
V 8.91 7.75 8.94 7.56
E(B−V) 1.14 1.19 1.33 1.50
Equivalent Widths(mÅ)b
3583.76 3.53±0.29 4.32±0.30 2.86±0.40 3.05±0.37 3572.65 2.40±0.31 2.78±0.21 1.34±0.23 1.35±0.22 3566.45 1.00±0.33 (0.95) (0.98) 1.01(1.20) 3565.34 1.23±0.35 1.34±0.36 0.88(0.98) (1.20) 3559.81 (0.95) (0.95) (0.98) (1.20) 3346.96 2.41±0.38 3.32±0.45 1.16(1.34) 1.64(1.70) 3337.36 1.87±0.50 1.41±0.30 1.15(1.34) (1.70)
N(OH+) 3.40±0.17 4.04±0.22 2.38±0.13 2.51±0.17
N(KI) 0.75±0.06 0.57±0.12 0.36±0.06 0.55±0.07
ζp 0.8 1.2 0.8 0.9
Notes. Values of N(OH+)andN(KI)are in units of 1013cm−2, andζp in 10−16s−1. Theζp-values are inferred using Equation(2).
a
Spectral types andVmagnitudes of target stars are taken from Walker(1963), Buscombe(1969), MacConnell & Bidelman(1976), Houk(1982), and Schild et al.(1983), andE(B−V)magnitudes are determined using intrinsic colors from Papaj et al.(1993).
b
The uncertainties of equivalent widths are one standard deviation (1σ) following a Gaussian profilefitting. Italic numbers indicate tentatively detected lines. For tentatively detected and non-detected lines, the numbers in parenthesis give the 3σupper limits that are estimated from the continuum S/N.
7
us to identifytwo interstellar absorption features, recently reported by Bhatt & Cami(2015)toward sources different from those studied here, as originatingfrom OH+. Given the role OH+ is supposed to play in the gas phase formation schemes of water,
the present findings may help to link water abundances in the
diffuse ISM to the gas phase ion chemistry, specifically, because solid-state water formation schemes(Ioppolo et al.2008)are not expected to be relevant.
D.Z. and H.L. acknowledge the support from NWO (VICI
grant, and Dutch Astrochemistry Network) and NOVA. J.K.
acknowledges the financial support of the Polish National
Center for Science (grant UMO-2011/01/BST2/05399).
G.A.G. acknowledges the support of Chilean fund
FONDE-CYT-regular (project 1120190). We are grateful for the
assistance of the Paranal Observatory staff members. We thank
Dr. Western (Bristol) for the useful discussion in the
calculations of oscillator strengths using Pgopher.
REFERENCES
Barlow, M. J., Swinyard, B. M., Owen, P. J., et al. 2013,Sci,342, 1343 Bhatt, N. H., & Cami, J. 2015,ApJS,216, 22
Buscombe, W. 1969,MNRAS,144, 31
de Almeida, A. A., & Singh, P. D. 1981, A&A,95, 383 Gerin, M., De Luca, M., Black, J., et al. 2010,A&A,518, L110 Gredel, R., Carpentier, Y., Rouillé, G., et al. 2011,A&A,530, A26 Habing, H. J. 1968, BAN,19, 421
Hollenbach, D., Kaufman, M. J., Neufeld, D., Wolfire, M., & Goicoechea, J. R. 2012,ApJ,754, 105
Houk, N. 1982, Michigan Catalogue of Two-dimensional Spectral Types for the HD Stars, Vol. 3(Ann Arbor, MI: Univ. Michigan Press)
Indriolo, N., Geballe, T. R., Oka, T., & McCall, B. J. 2007,ApJ,671, 1736 Indriolo, N., & McCall, B. J. 2012,ApJ,745, 91
Indriolo, N., Neufeld, D. A., Gerin, M., et al. 2012,ApJ,758, 83 Indriolo, N., Neufeld, D. A., Gerin, M., et al. 2015,ApJ,800, 40
Ioppolo., S., Cuppen, H. M., Romanzin, C., van Dishoeck, E. F., & Linnartz, H. 2008,ApJ,686, 1474
Krełowski, J., Beletsky, Y., & Galazutdinov, G. A. 2010,ApJL,719, L20 Le Petit, F., Roueff, E., & Herbst, E. 2004,A&A,417, 993
MacConnell, D. J., & Bidelman, W. P. 1976,AJ,81, 225
Merchán, M., Malmqvist, P.-Å., & Roos, B. O. 1991, AcTC,79, 81 Merer, A. J., Malm, D. N., Martin, R. W., Horani, M., & Rostas, J. 1975,
CaJPh,53, 251
Möhlmann, G. R., Bhutani, K. K., de Heer, F. J., & Tsurubuchi, S. 1978, CP, 31, 273
Neufeld, D. A., Goicoechea, J. R., Sonnentrucker, P., et al. 2010, A&A, 521, L10
Papaj, J., Krełowski, J., & Wegner, W. 1993, A&A,273, 575
Porras, A. J., Federman, S. R., Welty, D. E., & Ritchey, A. M. 2014,ApJ, 781, 8
Rodgers, D. J., Batey, A. D., & Sarre, P. J. 2007, MolPh,105, 849 Schild, R. E., Garrison, R. F., & Hiltner, W. A. 1983,ApJS,51, 321 Tielens, A. G. G. M. 2013, RvMP,85, 1021
Tielens, A. G. G. M., & Hollenbach, D. 1985, ApJ,291, 722
van der Tak, F. F. S., Nagy, Z., Ossenkopf, V., et al. 2013,A&A,560, A95 van Dishoeck, E. F., Herbst, E., & Neufeld, D. A. 2013, ChRv,113, 9043 Walker, G. A. H. 1963,MNRAS,125, 141
Welty, D. E., & Hobbs, L. M. 2001,ApJS,133, 345
Wyrowski, F., Menten., K. M., Guesten., R., & Belloche, A. 2010,A&A, 518, 26