US acculturation and poor sleep among an intergenerational
cohort of adult Latinos in Sacramento, California
Erline E. Martinez-Miller
1,2, Aric A. Prather
3, Whitney R. Robinson
2,
Christy L. Avery
2,, Yang C. Yang
4, Mary N. Haan
5and Allison E. Aiello
2,*
1Department of Clinical Sciences, University of Texas Southwestern Medical Center, Dallas, TX, 2Department of Epidemiology, Gillings School
of Global Public Health, University of North Carolina at Chapel Hill, Chapel Hill, NC, 3Department of Psychiatry, School of Medicine, University of California at San Francisco, San Francisco, CA, 4Department of Sociology, College of Arts and Sciences, University of North Carolina at Chapel Hill, Chapel Hill, NC and 5Department of Epidemiology and Biostatistics, School of Medicine, University of California at San Francisco, San Francisco, CA
*Corresponding author: Allison E. Aiello, Gillings School of Global Public Health, University of North Carolina at Chapel Hill, 2101C McGavran-Greenberg Hall, CB #7435, Chapel Hill, NC 27599. Email: [email protected].
Abstract
Acculturation may shape the disproportionate burden of poor sleep among Latinos in the United States. Existing studies are limited by unidimensional acculturation proxies that are incapable of capturing cultural complexities across generations. Understanding how acculturation relates to sleep may lead to the identification of modifiable intervention targets. We used multivariable regression and latent class methods to examine cross-sectional associations between a validated multidimensional scale of US acculturation and self-reported poor sleep measures. We analyzed an intergenerational cohort: first-generation (GEN1) older Latinos (Sacramento Area Latino Study on Aging; N = 1,716; median age: 69.5) and second-generation (GEN2) middle-aged offspring and relatives of GEN1 (Niños Lifestyle and Diabetes Study; N = 670; median age: 54.0) in Sacramento, California. GEN1 with high US acculturation, compared with high acculturation towards another origin/ancestral country, had less restless sleep (prevalence ratio [PR] [95% confidence interval (CI)]: 0.67 [0.54, 0.84]) and a higher likelihood of being in the best sleep class than the worst (OR [95% CI]: 1.62 [1.09, 2.40]), but among nonmanual occupations, high intergenerational US acculturation was associated with more general fatigue (PR [95% CI: 1.86 [1.11, 3.10]). GEN2 with high intergenerational US acculturation reported shorter sleep (PR [95% CI]: 2.86 [1.02, 7.99]). High US acculturation shaped sleep differentially by generation, socioeconomic context, and intergenerational acculturative status. High US acculturation was associated with better sleep among older, lower socioeconomic Latinos, but with shorter sleep duration among middle-aged, higher socioeconomic Latinos; results also differed by parental acculturation status. Upon replication, future studies should incorporate prospective and intergenerational designs to uncover sociobehavioral pathways by which acculturation may shape sleep to ultimately inform intervention efforts.
Key words: acculturation; sleep; Latino health; intergenerational; lifecourse; aging
Statement of Significance
Current studies exploring US acculturation and sleep use unidimensional acculturation proxies that fail to capture the dynamic complexities of culture that are shaped over generations. We examined the association with a validated multidimensional acculturation scale and self-reported sleep measures among an intergenerational Latino cohort. High US acculturation shaped sleep differentially by generation, socioeconomic context, and previous generation acculturation. High US acculturation was associated with better sleep (less restless, better overall) among older lower socioeconomic Latinos, but among middle-aged higher socioeconomic Latinos, with shorter sleep. Results also differed by parental acculturation. Changing associations between sleep and acculturation across generations highlight the importance of sociocultural factors in shaping sleep. Upon replication, future studies should elucidate underlying sociobehavioral pathways to inform intervention efforts.
XX
XX
XXXX
doi: 10.1093/sleep/zsy246
Introduction
Sleep is a multidimensional vital neurophysiologic state that changes across the lifecourse and facilitates biological functions for health maintenance, longevity, and restoration [1–5]. Poor sleep has been linked to harmful health behaviors and conditions, including mortality [2, 6–9]. In the United States, poor sleep is a public health crisis [10, 11] where 50–70 million suffer from a chronic sleep disorder [12] and one-third of adults report sleeping less than the recommended amount [5]. Though Latino sleep research is limited, some Latino populations may be disproportionately burdened by poor sleep when compared to other race/ethnicities [13–17], which is unsurprising since they face higher proportions of risk factors like obesity and depression [18–23]. For example, compared to non-Hispanic Whites, non-Mexican Latinos have reported more extreme sleep durations, though Mexican-Americans have reported less long sleep and fewer sleep complaints [17, 24]. The underlying mechanisms shaping sleep among Latinos remain poorly understood as associations are complex, interdependent, and rooted in cultural and sociodemographic context [18, 21, 22].
Culture is comprised of beliefs, traditions, language, and social interactions that shape health. Knowledge of one’s broad cultural orientation provides insight about these compositional cultural factors and how they influence health behaviors and conditions [25]. Latinos in the United States are characterized by diverse ancestral origins (e.g. Mexico, Puerto Rico, etc.) and many are foreign-born, which leads to rich cultural variation guided by the dynamic process of US acculturation [26]. Acculturation takes place over time and across generations after exposure to culturally dissimilar people, groups, and social influences [26–30]. US acculturation has been linked to harmful health behaviors and conditions associated with poor sleep (e.g. alcohol use, obesity, diabetes) [18, 21, 31–33], and may therefore play a role in patterning sleep. The association between US acculturation and poor health is a concept known as negative acculturation [26–29, 34–37]. Importantly, socioeconomic factors like education and occupation modify how new cultures are internalized to influence health with differential knowledge, values, and opportunities [26–30]. Understanding how US acculturation, along with socioeconomic factors, patterns sleep among Latinos may identify an overarching cultural framework to shape efficacious prevention and intervention efforts, as well as highlight potential underlying mechanistic pathways to explore in future research as intervention targets.
A growing body of literature among Latinos has found that proxies of US acculturation (e.g. US nativity or English language use vs. being foreign-born or Spanish language use) are associated with worse sleep (e.g. extreme sleep durations, sleep complaints) [18, 21, 22, 38–42]. However, unidimensional proxies like immigration status, language use and competency, and length of residence are of limited utility as they do not capture the cultural complexities (e.g. diet, social interaction) that guide pathways between acculturation and health [27, 29, 30]. Additionally, a complete picture of sleep health is challenging to capture and the existing literature does not measures sleep uniformly [10], which, when combined with a limited exploration of sociodemographic context, makes it challenging to draw clear conclusions of the association between US acculturation and sleep among Latinos.
Further, acculturation occurs across generations and the acculturative experiences of preceding generations may impact sleep and health through mechanisms that are separate from the known genetic contribution to sleep [43]. For example, a US-born Latino may have one, both, or no parents born outside the United States, resulting in varying degrees of cultural transmission. First, acculturation can become biologically embedded and transmitted to offspring via fetal programming (e.g. acculturative stress leads to elevated cortisol levels during pregnancy that impact offspring outcomes [44, 45]) to shape the health of the subsequent generation regardless of present life conditions [46]. Second, postnatally, parental acculturative behaviors and practices (e.g. sleep behaviors, diet, breastfeeding practices, healthcare utilization) can be learned, reinforced, and shape offspring development, lifecourse health, and sleep [26, 46]. Thus, the culture of a single generation is not solitary and intergenerational assessments are necessary to provide context into how the culture and health of previous generations can be biologically embedded and learned to shape the culture and health of subsequent generations [26, 29, 46].
We examined associations between a validated multidimensional measure of US acculturation and multiple self-reported measures of poor sleep among a predominately Mexican-descent intergenerational Latino cohort in the Sacramento, California region: (1) generation one of older age at study onset (GEN1) and (2) generation two of offspring and other biological relatives of middle-aged at study onset (GEN2). Our hypotheses were informed by the literature previously described detailing the known socioeconomic, behavioral, and health risk factors of poor sleep that are shaped by US acculturation, as well as the existing evidence linking proxies of US acculturation to poor sleep. First, we hypothesized that high US acculturation, among single generations and across the two generations (i.e. intergenerational) would be associated with poor sleep outcomes: restless sleep, general fatigue, extreme sleep durations, better sleep overall, and a self-reported sleep apnea diagnosis. Second, we hypothesized that low socioeconomic position (SEP), as measured by low educational attainment and manual occupations, would exacerbate the harmful association between US acculturation and sleep.
Methods
Study population
relative was eligible. The full NLDS sample consisted of N = 728 participants (73.4% offspring [N = 534]) aged 48–60 years at baseline in 2013. In both studies, participants reported health conditions, and lifestyle and sociodemographic factors via surveys administered by trained interviewers at home visits or during phone calls in the language (English or Spanish) selected by the participant. Clinical and cognitive assessments were collected at home visits.
Analyses were conducted in subsamples with acculturation and sleep data: N = 1,716 older SALSA GEN1 participants and N = 670 middle-aged NLDS GEN2 participants for single-generation analyses and N = 534 GEN1 parent–GEN2 offspring linked pairs to explore intergenerational acculturation and sleep [46]. The intergenerational subsample was similar in sociodemographic and cultural factors to the full SALSA and NLDS samples (Table 1).
Measures
Acculturation measures
Acculturation was measured using the Acculturation Rating Scale for Mexican-Americans–Version II (ARSMA-II), an established measure of language use and ethnic identity and interaction [48]. The scale consists of two subscales totaling 30 items to measure Anglo orientation (AOS) and Mexican orientation (MOS). The subscales are then averaged and subtracted (AOS-MOS) for an overall mean score. AOS and MOS have strong internal reliability (Cronbach’s alpha = 0.83 and 0.88, respectively), test–retest reliability at 1-week intervals (correlation coefficient = 0.94 and 0.96, respectively), and concurrent validity (correlation coefficient with original ARSMA = 0.89). We modified Cuellar et al. (1995)’s suggested cut points for a dichotomous US acculturation measure where ≥0 indicates “high” US cultural orientation and <0 indicates “low” (or “high” towards another birth or ancestral country). Due to a small sample size (<1%), we combined bicultural participants (score = 0) with high US acculturation participants (score >0) given that the study is US-based [48–50].
Intergenerational US acculturation. Among GEN2 offspring linked to a GEN1 parent, we created a three-level intergenerational parent/ offspring measure of US acculturation: stable-high (high parent US acculturation/high offspring US acculturation); upwardly mobile (low parent/high offspring); and low, a combination of stable-low (low parent/low offspring) and downwardly mobile (high parent/low offspring) because downwardly mobile pairs constituted <2% of the parent-linked offspring sample.
Immigrant generation. Among GEN1, we created a proxy of intergenerational US acculturation with a three-level measure of immigrant generation where participants reported their nativity and the nativity of their parents [51]. A foreign-born participant was categorized as a first-generation immigrant and indicated low intergenerational US acculturation, a US-born respondent with at least one foreign-born parent was categorized as second immigrant generation and indicated upwardly mobile intergenerational US acculturation, and a US-born participant with two US-born parents was categorized as third and greater immigrant generation and indicated high intergenerational US acculturation.
Sleep
The availability of sleep measures differed between GEN1 and GEN2. GEN1 had more measures and different measures than GEN2, though an identical measure of restless sleep was available for both (see Table 2 for a summary of sleep measures by cohort). In GEN1, we used five dichotomous (yes/no) measures of poor sleep: restless sleep, general fatigue, waking up far too early, trouble falling asleep, and waking up several times a night. We only examined restless sleep and general fatigue as individual outcomes due to the existing literature base and the ease of interpretability to daily functioning and health [10, 52]. All five measures were used in a latent class analysis (LCA) to measure overall sleep. In GEN2, we used seven dichotomous (yes/no) measures of poor sleep as individual outcomes: restless sleep, five different cut points of average sleep duration, and a self-reported medical diagnosis of sleep apnea.
Restless sleep data were extracted from the Center for Epidemiological Studies Depression (CES-D) Scale, an assessment for depressive symptoms used in surveys for SALSA GEN1 during home visits and with an abbreviated version, for NLDS GEN2 during phone interviews [53, 54]. The CES-D has been shown to have good internal consistencies (Cronbach’s alpha’s = 0.80–0.86), test–retest reliability (r’s = .41–.70), and convergent validity among diverse Latinos [53]. General fatigue (GEN1) was measured with responses to the following question: “In the past month, have you ever had an overall sense of fatigue?”.
While the entire GEN2 population had restless sleep data collected during phone interviews, a subsample of GEN2 consented to home visits (N = 483) where sleep duration and a self-reported medical diagnosis of sleep apnea data were collected. Participants who agreed to a home visit were similar in sociodemographic and cultural factors to the total NLDS GEN2 population (Supplementary Table S1). For sleep duration (GEN2), participants were asked about how many hours they sleep on weekdays and weekends. Self-reported sleep duration has been shown to moderately correlate (Pearson’s p = .31–.47) with objective assessments [55, 56]. We compared descriptive statistics between a weighted average of weekend and weekday average sleep duration measures and weekday-only measures of average sleep duration to assess whether sleep deprivation throughout the week due to lifestyle demands (e.g. occupational) may alter weekend sleep to skew our findings (Supplementary Table S2), however, we found that results were similar. We opted to use a weighted weekend-weekday average for an optimal measure of use of data and created five separate duration variables with the average sleep duration dichotomized at informative cut points of extreme sleep durations (averages of <5,<6, <7, >8, and >9 hours of sleep/night) based on sleep recommendations and sleep duration–health literature [7, 12, 57–60].
Covariates
Table 1. Sociodemographic, health, acculturative, and sleep characteristics among an intergenerational cohort of adult Latinos in the Sacramento, CA region: GEN1, SALSA, 1998–1999 and GEN2, NLDS, 2013
Overall Parent–offspring linked pairs
GEN1 GEN2 GEN1 parents GEN2 offspring
N = 1,716 N = 670 N = 543
Median (interquartile range) or N (%)
Sociodemographic and health measures
Age at baseline (years) 69.5 54 69.9 54
(65.0, 74.7) (48.0, 60.0) (64.6, 75.1) (49.0, 60.0) Sex
Male 715 (41.7) 252 (37.6) 172 (32.2) 201 (37.6)
Female 1001 (58.3) 418 (62.4) 362 (67.8) 333 (62.4)
Nativity
Foreign-born (Mexico or other)a 869 (50.1) 165 (24.6) 263 (49.3) 136 (25.5)
United States 847 (49.4) 505 (75.4) 271 (50.8) 398 (74.5)
Educational attainment (years)
High: GEN1 ≥12; GEN2 ≥13 510 (29.7) 411 (63.2) 176 (33.0) 333 (63.9)
Low: GEN1 <12; GEN2 <13 1,206 (70.3) 239 (36.8) 358 (67.0) 188 (36.1)
Missing 0 20 0 13
Current working status
Employed 292 (18.4) 348 (53.1) 81 (16.9) 283 (53.3)
Looking for work/unemployed/unretiredb 26 (1.6) 58 (8.9) 3 (0.6) 46 (8.7)
At home full time to take care of family 44 (6.7) 37 (7.0)
Retired, sick leave, or disabilityc 1,269 (80.0) 207 (31.5) 395 (82.5) 165 (31.1)
Missing 129 13 55 3
Major lifetime occupational category
Non-manual 367 (21.6) 106 (20.0)
Manual 1,016 (59.8) 287 (54.2)
Otherd 315 (18.6) 137 (25.9)
Missing 18 4
Self-rated health
Good and better than good 873 (50.1) 531 (79.3) 260 (50.0) 431 (80.7)
Worse than good 840 (49.0) 139 (20.8) 260 (50.0) 103 (19.3)
Missing 3 0 14 0
Depressive symptomse
Low 1,006 (79.9) 505 (83.9) 346 (78.5) 416 (88.3)
High 253 (20.1) 98 (16.3) 95 (21.5) 55 (11.7)
Missing 457 67 93 63
Acculturative measures
US acculturation
Low 1,113 (64.9) 216 (32.2) 348 (65.2) 175 (32.8)
High 603 (35.1) 454 (67.8) 186 (34.8) 359 (67.2)
Intergenerational US acculturative mobilityf
Low 175 (32.8)
Upwardly mobile 182 (34.1)
Stable-high 177 (33.2)
Survey language
Spanish 977 (56.9) 65 (9.7) 294 (55.1) 52 (9.7)
English 739 (43.1) 605 (90.3) 240 (44.9) 482 (90.3)
Immigrant generation
First 869 (54.4) 263 (54.0)
Second 579 (36.2) 159 (32.6)
Third and greater 150 (9.4) 65 (13.4)
Missing 118 47
Poor sleep measures
Restless sleep in past week: yes (vs. no) 404 (23.5) 267 (39.9) 100 (19.2) 215 (40.3)
Missing 0 0 13 0
General fatigue in past month: yes (vs. no) 496 (28.9) 180 (34.6)
Missing 0 13
Wake up far too early (regularly): yes (vs. no) 756 (44.1) 246 (47.2)
Missing 1 13
Trouble falling asleep (regularly): yes (vs. no) 681 (39.7) 217 (41.7)
Education. We used different cut points for “high” and “low” education in GEN1 and GEN2 to account for differences in educational attainment within each cohort as done in a previous SALSA/NLDS study [50]. Varying cut points allow us to capture a conceptually “high” educational attainment specific to each cohort as educational attainment has risen across generations and tend to be higher for US-born individuals of which GEN2 has a greater percentage [62, 63]. Among GEN1, we dichotomized education as “low” for <12 years and “high” as ≥12 years, a recurring cut point in GEN1 research and studies with similar populations [64, 65]. In GEN2, “low” education was categorized as <13 years and “high” as ≥13 years.
Major lifetime occupation. Participants were asked “what job did you do most of your life?” and responses were categorized using census codes as manual, nonmanual, and other (which included housewives and unemployed) [66, 67].
Effect measure modifiers
Acculturation, sleep, and related health factors are embedded in socioeconomic context [28]. We examined educational attainment and major lifetime occupation as effect measure modifiers in the larger GEN1 population to determine whether US acculturation– sleep associations varied in direction and magnitude. While education and occupation are interrelated, each provides insight into different individual and societal dynamics. Education can indicate skillset and predict socioeconomic trajectory, while occupation can indicate factors like workplace responsibility and daily activity [68, 69].
Statistical analysis
All analyses were conducted in SAS 9.4 (SAS Institute, Inc., Cary, NC). We reported descriptive characteristics of GEN1, GEN2, and
the subsample of parent–offspring linked pairs. In a supplemental analysis to inform our understanding of the sleep measures and their interrelatedness, we explored the interdependence of sleep measures within generations and across generations with chi-square tests of independence where a p-value of ≤.05 indicates a rejection of the null hypothesis of independence.
Cross-sectional multivariable regression analysis
First, we used log-binomial regression to assess associations between US acculturation and poor sleep measures where single-generations were examined separately among GEN1 and GEN2 and then jointly for intergenerational US acculturation among parent–offspring linked pairs. General estimating equations were used to account for within family clustering in intergenerational analyses [70, 71]. Results were exponentiated to report prevalence ratios (PRs) and 95% confidence intervals (CIs). If models did not converge, we used a modified log-Poisson approach to approximate PRs [72]. We ran a model adjusted for demographics (Model 1: age, sex) and a sociodemographic-adjusted model (Model 2: age, sex, education) to explore the likely bidirectional influence between acculturation and education [26, 28].
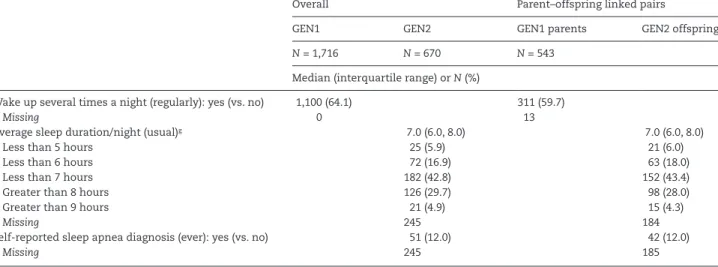
We also ran three sensitivity assessments. (1) Among GEN2, we conducted a weekday sleep duration sensitivity assessment, where we used weekday sleep averages as our outcome measures, rather than a weighted weekend and weekday measure, to further ensure that differences in weekend sleep (e.g. to recover from weekly sleep duration) did not misrepresent the association. (2) Among parent–offspring linked pairs, we ran an intergenerational sleep sensitivity assessment to explore whether parental sleep rather than other hypothesized acculturative or mediating health factors may explain findings as it can be considered a component of intergenerational US acculturation and a determinant of offspring sleep via learned behaviors and reinforcement. We adjusted for Wake up several times a night (regularly): yes (vs. no) 1,100 (64.1) 311 (59.7)
Missing 0 13
Average sleep duration/night (usual)g 7.0 (6.0, 8.0) 7.0 (6.0, 8.0)
Less than 5 hours 25 (5.9) 21 (6.0)
Less than 6 hours 72 (16.9) 63 (18.0)
Less than 7 hours 182 (42.8) 152 (43.4)
Greater than 8 hours 126 (29.7) 98 (28.0)
Greater than 9 hours 21 (4.9) 15 (4.3)
Missing 245 184
Self-reported sleep apnea diagnosis (ever): yes (vs. no) 51 (12.0) 42 (12.0)
Missing 245 185
GEN1, Generation 1; GEN2, Generation 2; NLDS, Niños Lifestyle and Diabetes Study; SALSA, Sacramento Area Latino Study on Aging.
aBreakdown of foreign-born study population from Mexico (vs. other; %): Overall, GEN1= 89.0, GEN2= 88.5; Parent–offspring linked pairs, GEN1= 92.4, GEN= 89.0. bGEN1: Unemployed and unretired; GEN2: Looking for work or unemployed.
cGEN1: Retired only.
dOther major lifetime occupational category includes housewives and unemployed participants.
eCenter for the Epidemiological Studies of Depression Scale (CES-D): 20-item, score ≥16 and 10-item, score ≥10 = high depressive symptoms for GEN1 and GEN2,
respectively.
fBreakdown of GEN2 low intergenerational US acculturation (%): stable-low, 94.9; downwardly mobile, 5.1. gSleep duration is weighted weekend and weekday average of self-reported hours per night.
Table 1. Continued
Overall Parent–offspring linked pairs
GEN1 GEN2 GEN1 parents GEN2 offspring
N = 1,716 N = 670 N = 543
parental restless sleep, a GEN1 measure, in an intergenerational US acculturation–offspring restless sleep analysis among parent– offspring linked pairs to isolate a parental sleep behavior from the same offspring sleep behavior. (3) We ran a foreign-born nativity sensitivity assessment where we restricted to US-born and Mexico-born participants for these main analyses to determine whether associations varied when we excluded foreign-born participants born outside of Mexico as sleep literature has found that sleep behaviors may vary by Latino subgroups [14, 17, 24].
LCA
Second, in GEN1, we conducted a LCA [73] with five sleep measures (Table 2) to create latent classes of overall sleep. LCA provides an opportunity to capture the complex, interrelated, and perhaps unobservable, components of sleep that are difficult to measure [10]. We fit baseline models for a range of two to five latent sleep classes and chose the final number of classes based on best statistical fit (G2 relative to df; Akaike information criterion;
Bayesian information criterion). We used multinomial logistic regression to report odds ratios (ORs) and 95% CIs of membership in latent classes of overall sleep given US acculturation status in demographic- and sociodemographic-adjusted models [74].
Effect measure modification
Third, in GEN1, we explored the modifying roles of educational attainment and major lifetime occupational category as both socioeconomic factors confer different levels of values, knowledge, opportunities, and experience that may modify the direction and magnitude of associations between US acculturation and poor sleep.
Results
Descriptive characteristics
Table 1 displays participant descriptive characteristics. In GEN1, the median age was 69.5 years and 58.3% were female. Education was low (<12 years) for 70.3% of the population and 59.8% worked in manual occupations. Less than half were highly acculturated to the United States (35.1%), and 54.4% were first-generation immigrants. Restless sleep and general fatigue were reported by 23.5% and 28.9%, respectively. In GEN2, the median age was 54.0 years and 62.4% were female. Education was low (<13 years) for 36.8% of the participants and 67.8% had high US acculturation. Restless sleep, average sleep durations of <7 hours/night and >8 hours/night, and a self-reported sleep apnea diagnosis were reported by 39.9%, 42.8%, 29.7%, and 12.0%, respectively. Among GEN1 parent– GEN2 offspring linked pairs, intergenerational US acculturation was low for 32.8% of the population, upwardly mobile for 34.1%, and stable-high for 33.2%. Parent–offspring linked pairs were similar in culture, sociodemographic factors, and sleep to the overall GEN1 and GEN2 populations. In the sensitivity comparison of sleep measures within and across generations (Supplementary Table S3), all GEN1 sleep measures were related (p < .05). Among GEN2, restless sleep was associated with short sleep durations and self-reported sleep apnea diagnoses, but not long sleep durations. For intergenerational sleep, parental restless sleep was related to offspring restless sleep, and parental trouble falling asleep was related to average sleep durations of <6 hours/night among offspring.
Table 2. Summary of sleep measures and treatments among an intergenerational cohort of adult Latinos in the Sacramento, CA region: GEN1,
SALSA, 1998–1999 and GEN2, NLDS, 2013
Survey question Responses Study treatment Use in analysis
GEN1
In the past week, was your sleep restless?
Never; little of the time; some of the time; most of the time
Yes = some of the time or most of the time; No = never or little of the time
Outcome and latent variable
In the past month, have you ever had an overall sense of fatigue?
Yes; No Yes; No General fatigue, not sleep specific; Outcome and latent variable Do you usually wake up far too
early?
Yes; No Yes; No Latent variable
Do you usually have trouble falling asleep?
Yes; No Yes; No Latent variable
Do you usually wake up several times a night?
Yes; No Yes; No Latent variable
GEN2
During the past week, on how many days was your sleep restless?
Never; little of the time; some of the time; most of the time
Yes=some of the time or most of the time; No=never or little of the time
Outcome variable
About how many hours of sleep do you usually get at/per night on weekdays?
About how many hours of sleep do you usually get at night on weekends?
Fill in the blank hours Hours summed and averaged for a single hours/day/week measure. If weekday or weekend was missing, the available duration was used. Dichotomized at three clinically significant cut points: less than 5, less than 6, and less than 7 hours/ day/week.
Three separate outcome variables (<5 hours sleep/night; <6 hours sleep/night; <7 hours sleep/ night)
Has a doctor (ever) told you that you have sleep apnea?
Yes; No Yes; No Outcome variable
Cross-sectional multivariable analyses
Among GEN1 (Table 3), single-generation high US acculturation (vs. low US/more oriented towards Mexico or other origin/ ancestral country) was associated with less restless sleep (PR [95% CI]: 0.67 [0.54, 0.84]), even when adjusting for age, sex, and education. Participants of third and greater immigrant generation reported less restless sleep than first-generation immigrants (PR [95% CI]: 0.60 [0.39, 0.91]); we observed no association for second immigrant generation participants (vs. first-generation immigrants). We did not find an association between general fatigue and US acculturation or immigrant generation.
Among GEN2 (Table 4), single-generation US acculturation and sleep outcomes were not associated.
Parent-linked offspring
Participants with stable-high intergenerational US acculturation had a higher prevalence of <5 hours of sleep/night than participants with low intergenerational US acculturation (PR [95% CI]: 2.86 [1.02, 7.99]). Upwardly mobile intergenerational US acculturation (vs. low intergenerational US acculturation/more culturally oriented towards Mexico or other origin/ancestral country across generations) was not associated with average sleep durations.
Weekday sleep duration sensitivity assessment
We limited measurement of sleep duration (GEN2) to reported weekday sleep duration alone, excluding reported weekend sleep (Supplementary Table S4). We did not change our conclusions based on these results, which aligned with Supplementary Table S2 that showed similarities between the different measures of sleep duration (weighted weekend and weekday vs. weekday alone) and Table 4 results. Participants with stable-high intergenerational US acculturation had a higher prevalence of <5 hours of sleep/night than those with low US acculturation (PR [95% CI]: 2.85 [1.02, 7.99]). We did not find statistically significant associations among other measures.
Intergenerational sleep sensitivity assessment
Using restless sleep, we explored the role of parental sleep between intergenerational US acculturation and offspring sleep by adding parental restless sleep as a covariate to fully adjusted models (Supplementary Table S5). In main analyses, intergenerational US acculturation–offspring restless sleep associations were not statistically significant (Table 4). Additional adjustment for parental restless sleep changed PRs
by <10%, and we concluded that parental restless sleep was not an important explanatory variable between intergenerational US acculturation and restless sleep.
Foreign-born nativity sensitivity assessment
We restricted to US- and Mexico-born participants for GEN1 (Supplementary Table S6) and GEN2 (Supplementary Table S7) analyses to explore differences in foreign-born nativity. Overall, our GEN1 conclusions were not altered. However, among GEN2, the higher prevalence of <5 hours of sleep/night than among participants with stable-high intergenerational acculturation when compared to low was slightly attenuated (PR [95% CI]: 2.73 [0.97, 7.65]) and became borderline significant (p < .10). The change in confidence may be attributable to reduced power given the smaller sample size, and the effect estimate was comparable and still suggestive of a higher prevalence of extreme short sleep among those more acculturated towards the United States.
LCA
We conducted a LCA to create a latent class variable of overall sleep and to examine associations between US acculturation and the latent class overall sleep variable among the older GEN1 population.
Baseline latent classes
Three latent classes of sleep were the best statistical fit for the data (Supplementary Table S8) and each class had clear substantive interpretability: best sleep, 36.9% of the study population; average sleep, 40.7%; and worst sleep, 22.4%. Participants in the worst sleep class had the highest probability of a “yes” response to all poor sleep measures, and those in the best sleep class had the lowest, except for waking up several times a night where the probability of “yes” was higher for the best sleep class than the average (probability [SE]: 0.063 [0.016] and 0.027 [0.127], respectively; Figure 1; Supplementary Table S9). This did not substantially detract from the meaningfulness of the latent class labels.
LCA classes and covariates
We examined whether US acculturation level or immigrant generation predicted latent sleep class membership when adjusting for age, sex, and education (Table 5). Acculturative level was a significant predictor of latent class membership (p = .001),
Table 3. Adjusteda,b prevalence ratios for poor sleep by United States acculturation status among older adult Latinos in the Sacramento, CA region: GEN1, SALSA, 1998–1999 (N = 1,716)
Restless sleep General fatigue
Prevalence ratio (95% confidence interval)
Model 1a Model 2b Model 1a Model 2b
High US acculturation (vs. low) 0.60 0.49, 0.74 0.67 0.54, 0.84 0.98 0.84, 1.15 1.03 0.87, 1.23 Immigrant generation
First 1 Referent 1 Referent 1 Referent 1 Referent
Second 0.87 0.72, 1.05 0.97 0.80, 1.18 0.95 0.80, 1.12 0.97 0.82, 1.16
Third and greater 0.52 0.34, 0.80 0.60 0.39, 0.91 0.90 0.67, 1.20 0.93 0.69, 1.25
GEN1, Generation 1; SALSA, Sacramento Area Latino Study on Aging.
aModel 1. Adjusted for age and sex,
while immigrant generation was not (p = .109). When compared to low US acculturation participants, high US acculturation participants had a higher odds of membership in the best sleep class than the worst (OR [95% CI]: 1.62 [1.09, 2.40]) and a higher odds of membership in the average sleep class than the best (OR [95% CI]: 1.86 [1.00, 3.48]).
Effect measure modification by educational attainment level
We examined whether education modified the association between US acculturation and sleep among the older
GEN1 population (Table 6), and found some evidence that education modifies the relationship between immigrant generation and restless sleep. Though CIs overlapped slightly, low-education-third and greater immigrant generation participants reported a lower prevalence of restless sleep than low education-first-generation immigrants (PR [95% CI]: 0.35 [0.17, 0.72]); the association was null for high-education participants (PR [95% CI]: 1.31 [0.67, 2.58]). We did not observe significant effect modification for restless sleep among second immigrant generation participants compared to first-generation immigrants. For general fatigue, the education stratified estimates were not statistically significant and CIs overlapped.
Effect measure modification by major lifetime occupational category
We examined whether occupational category modified the association between US acculturation and sleep among the older GEN1 population (Table 7). We did not observe modification between acculturative measures and restless sleep. Conversely, we did observe modification for immigrant generation–general fatigue associations. When adjusting for age, sex, and education, nonmanual labor-third and greater immigrant generation participants reported more general fatigue than nonmanual labor-first-generation immigrants (PR [95% CI]: 1.86 [1.11, 3.10]); the same associations for manual laborers and other laborers were null (PR [95% CI]: 0.74 [0.46, 1.20] and 0.61 [0.28, 1.32], respectively). We did not observe modification by occupational category for reported general fatigue among second immigrant generation participants when compared with first-generation immigrants.
Table 4. Adjusteda,b prevalence ratios for poor sleepc by United States acculturation status among middle-aged adult Latinos (N = 665) and GEN1 parent-linked offspring for intergenerational assessments (N = 530) in the Sacramento, CA region: GEN2, NLDS, 2013
Restless sleep
Average sleep duration/nightc
Self-reported sleep apnea diagnosis Less than
5 hours
Less than 6 hours
Less than 7 hours
Greater than 8 hours
Greater than 9 hours
Prevalence ratio (95% confidence interval)
Model 1a
High US acculturation (vs. low)
1.08 0.88, 1.33 1.28 0.54, 3.01 0.97 0.62, 1.51 1.03 0.81, 1.30 1.07 0.78, 1.45 0.92 0.39, 2,16 1.11 0.65, 1.92
Intergenerational US acculturation
Lowd 1 Referent 1 Referent 1 Referent 1 Referent 1 Referent 1 Referent 1 Referent
Upwardly mobile 0.97 0.76, 1.24 1.20 0.37, 3.82 0.94 0.53, 1.68 0.88 0.64, 1.20 1.10 0.76, 1.59 0.37 0.09, 1.60 1.12 0.57, 2.21 Stable-high 1.10 0.86, 1.39 1.90 0.68, 5.36 1.02 0.60, 1.74 1.11 0.85, 1.46 0.89 0.60, 1.35 0.89 0.31, 2.58 1.09 0.53, 2.24
Model 2b
High US acculturation (vs. low)
1.06 0.86, 1.31 1.42 0.58, 3.47 0.93 0.59, 1.48 0.99 0.78, 1.27 1.06 0.77, 1.46 0.99 0.42, 2.34 0.89 0.52, 1.55
Intergenerational US acculturation
Lowd 1 Referent 1 Referent 1 Referent 1 Referent 1 Referent 1 Referent 1 Referent
Upwardly mobile 0.98 0.76, 1.26 1.34 0.41, 4.37 0.90 0.50, 1.63 0.85 0.61, 1.17 1.06 0.73, 1.54 0.47 0.10, 2.17 0.89 0.45, 1.74 Stable-high 1.14 0.89, 1.46 2.86 1.02, 7.99 1.06 0.60, 1.88 1.09 0.81, 1.48 0.84 0.55, 1.28 1.05 0.38, 2.89 0.87 0.41, 1.87
GEN1, Generation 1; GEN2, Generation 2; NLDS, Niños Lifestyle and Diabetes Study.
aModel 1. Adjusted for age, sex, and in intergenerational models, clustering at family level. bModel 2. Adjusted for age, sex, education, and in intergenerational models, clustering at family level. cSleep duration is weighted weekend and weekday average of self-reported hours per night.
dLow intergenerational US acculturation: stable-low (low parent/low offspring) and downwardly mobile (high parent/low offspring).
0 0.1 0.2 0.3 0.4 0.5 0.6 0.7 0.8 0.9 1
Restless sleep Overall fatigue Wake up far too early
Trouble falling asleep
Wake several times a night
Pr
ob
ab
ility
of
me
as
ur
e en
do
rs
em
en
t
Poor sleep measures
Best sleep Average sleep Worst sleep
Discussion
This is the first study, to our knowledge, to examine the association between a validated acculturation scale with intergenerational assessments and multiple measures of sleep among Latinos. Overall, associations between US acculturation and poor sleep varied by generational cohort, acculturation status of previous generations (i.e. intergenerational acculturation), and socioeconomic context. Among GEN1, those with high US acculturation had better sleep outcomes than those with low
US acculturation overall, but we then found associations were modified by educational and occupational status. Conversely, among GEN2, high intergenerational US acculturation was associated with shorter sleep durations (i.e. worse sleep) than low intergenerational US acculturation. Results for GEN2 supported a negative acculturation hypothesis for sleep, while associations among GEN1 refuted a negative association. The differential results by generational cohort may be attributable to differing sociocultural profiles and trajectories, differing age groups, or both.
Table 5. Adjusteda odds ratios for poor sleep latent class by United States acculturation status among older adult Latinos in the Sacramento, CA region: Generation 1 (GEN1), Sacramento Area Latino Study on Aging (SALSA), 1998–1999 (N = 1,716)
High US acculturation (vs. low) Immigrant generation (vs. first)
Second Third and greater
Sleep class Odds ratio (95% confidence interval)
Average vs. best 1.86 1.00, 3.48 1.3 0.85, 1.99 1.14 0.59, 2.20
Worst vs. best 0.62 0.42, 0.92 0.95 0.68, 1.33 0.56 0.32, 0.99
Best vs. average 0.54 0.29, 1.00 0.77 0.50, 1.18 0.88 0.45, 1.70
Worst vs. average 0.33 0.16, 0.68 0.73 0.46, 1.16 0.49 0.23, 1.06
Best vs. worst 1.62 1.09, 2.40 1.05 0.75, 1.47 1.78 1.01, 3.12
Average vs. worst 3.02 1.48, 6.18 1.36 0.86, 2.15 2.02 0.94, 4.34
p-value .001 .109
aModel adjusted for age, sex, and education.
Table 6. Adjusteda prevalence ratios for poor sleep by United States acculturation status within educational attainmentb strata among older adult Latinos in the Sacramento, CA region: GEN1, SALSA, 1998–1999 (N = 1,716)
Educational attainmentb
Low education High education High education Consistent
Prevalence ratio (95% confidence interval)
Restless sleep Overall fatigue
High US acculturation (vs. low) 0.66 0.50, 0.87 0.70 0.47, 1.03 1.03 0.84, 1.27 1.03 0.75, 1.41 Immigrant generation
First 1 Referent 1 Referent 1 Referent 1 Referent
Second 0.94 0.76, 1.16 1.38 0.81, 2.34 0.99 0.81, 1.20 1.02 0.70, 1.48
Third and greater 0.35 0.17, 0.72 1.31 0.67, 2.58 0.67 0.42, 1.09 1.30 0.82, 2.04
GEN1, Generation 1; SALSA, Sacramento Area Latino Study on Aging.
aModels adjusted for age and sex.
bEducational attainment level: low, <12 years; high, ≥12 years.
Table 7. Adjusteda prevalence ratios for poor sleep by United States acculturation status within major lifetime occupational category strata among older adult Latinos in the Sacramento, CA region: GEN1, SALSA, 1998–1999 (N = 1,716)
Major lifetime occupational category
Manual Nonmanual Other Manual Nonmanual Other
Prevalence ratio (95% confidence interval)
Restless sleep Overall fatigue
High US acculturation (vs. low) 0.72 0.54, 0.96 0.62 0.40, 0.98 0.70 0.45, 1.08 1.04 0.82, 1.32 1.19 0.82, 1.71 0.92 0.68, 1.26 Immigrant generation
First 1 Referent 1 Referent 1 Referent 1 Referent 1 Referent 1 Referent
Second 0.98 0.76, 1.25 1.24 0.73, 2.10 0.88 0.60, 1.30 1.03 0.82, 1.31 1.08 0.69, 1.68 0.93 0.68, 1.27 Third and greater 0.58 0.33, 1.02 0.77 0.30, 1.94 0.68 0.28, 1.66 0.74 0.46, 1.20 1.86 1.11, 3.10 0.61 0.28, 1.32
GEN1 participants with high US acculturation reported better sleep (i.e. less restless and more likely to be in the best sleep class than the worst) than those with low US acculturation. This may be explained by multiple factors. First, poor sleep is associated with psychosocial stress [75, 76] and poor mental health [23, 77], which may be more prevalent among individuals residing in the United States with low US acculturation due to more daily acculturative stressors (e.g. low community integration and social support, language barriers) [78–82]. Perceived discrimination is an acculturative stressor that may mediate this association as it is linked to low acculturation towards a country where one resides, poor mental health [78, 79], and worse sleep [76, 83, 84]. In the context of high US acculturation, the same opposing factors (i.e. strong social support and community integration) [26] may improve sleep by the reverse mechanisms (i.e. enhanced mental health, and less stress and loneliness) [23, 85].
Second, these results may be a function of age as some studies exploring US acculturation and health among older Latinos have found no associations or improved outcomes [86–88]. For example, in our study population, Lopez et al. identified better cardiovascular outcomes among the highly acculturated [86], and an extensive body of literature has linked poor cardiovascular health to poor sleep [89]. Also, those who are highly acculturated are more likely to have a higher SEP and improved healthcare access, enabling them to better manage chronic illnesses and disabilities that are characteristic of older age [23, 87]. Third, findings may also be attributable to the sociocultural composition of GEN1 as the cohort can be characterized by low SEP and acculturation (e.g. Table 1: 70.3% had <12 years of education; 35.1% had high US acculturation). Some studies have found that when SEP is low, those who are more acculturated have better health outcomes, which may similarly be attributable to better access to healthcare and social services, or more social support [86, 90–94]. The differing sociocultural composition of GEN2 earlier in adulthood (e.g. Table 1: 36.8% had <13 years of education; 67.8% had high US acculturation) indicates differential sociocultural trajectories across the lifecourse between the two generations. Therefore, we may not expect to see the same associations among GEN2 when they reach the age group of GEN1 or among Latinos with differing sociocultural profiles.
Additionally, results varied by immigrant generation, our proxy for intergenerational US acculturation, with differentiation by GEN1 nativity as well as reported parental nativity, highlighting the importance of intergenerational assessments. While participants with high US acculturation across generations (i.e. third and greater immigrant generation) reported less restless sleep than those with low (i.e. first-generation immigrants), sleep outcomes did not differ statistically between upwardly mobile (i.e. second immigrant generation) and low intergenerational US acculturation participants. Second immigrant generation individuals are likely to have more bicultural orientations given the greater range of cultural exposure when generational nativities differ [95]. Biculturalism has been linked to some improved health outcomes (e.g. better mental health, less substance abuse) [96– 98], but we did not observe the same beneficial association for sleep. When considering the wide range of factors that shape sleep, it is plausible that positive and negative components of both cultures may come together and counteract when one is
bicultural. For example, someone bicultural may have better access to social services, but also have lower SEP or less social support, and both factors may improve or harm sleep through multiple pathways. Further exploration of the balance of health factors within biculturalism may provide better insight to how culture shapes sleep and to which health components are least and most amenable across the acculturation spectrum and process.
Among GEN2, extremely short sleep durations were more common among those with stable-high intergenerational US acculturation (i.e. highly acculturated parent and offspring) than those with low US acculturation. Multiple mediating pathways may explain this finding, as it aligns with both the negative acculturation hypothesis and literature previously described outlining multiple health behaviors (e.g. poor diet, more alcohol use and smoking) and outcomes (e.g. obesity, diabetes, cardiovascular disease) linked to high US acculturation and poor sleep [18, 21, 22, 35, 37–42]. Identification of the key health behaviors, conditions, and sociocultural mechanisms that facilitate the broad cultural association could serve to shape intervention tactics. For example, if poor diet and obesity mediated these findings, public health efforts to improve sleep could target these factors and incorporate familial and social intervention frameworks, which are known to shape diet and related health behaviors [99, 100].
Further, among GEN2, single-generation US acculturation was not associated with sleep and for intergenerational assessments, results differed by parental acculturative status, again highlighting the benefit of intergenerational assessments. High US acculturation offspring with a highly acculturated parent had shorter sleep (i.e. stable-high) than low US acculturation offspring, but high US acculturation offspring with a low US acculturation parent (i.e. upwardly mobile) did not have statistically different sleep duration than low intergenerational US acculturation offspring. This differentiation correlated with conclusions drawn from GEN1 about bicultural orientations (i.e. second immigrant generation) as upwardly mobile trajectories of acculturation are also likely to be more bicultural given the greater range of cultural exposure across generations [95]. The sociocultural and health composition of more bicultural orientations should be examined and compared with other orientations to better understand what is leading to these differential findings in sleep outcomes.
We then explored the socioeconomic context of US acculturation and sleep among the larger, older GEN1 population with measures of educational attainment and lifetime occupational category. We found that both educational attainment and lifetime occupational category modified the relationship between intergenerational US acculturation (i.e. immigrant generation) and sleep. For educational attainment, among low education participants, high intergenerational US acculturation was associated with better reported sleep (less restless) when compared to low, but the association was null among high-education participants. These findings provide further support for a beneficial association between high US acculturation and sleep in low SEP settings [86, 90–94].
is the only finding among GEN1 that aligns with the negative acculturation hypothesis [26–29, 34–37]. Multiple factors may help us understand this deviation from other GEN1 results. First, nonmanual occupations may isolate a higher SEP GEN1[101] that educational attainment may not have been able to capture given the overall low education of the cohort. In this higher SEP setting, the previously described harmful health behaviors and conditions linked to high US acculturation (e.g. alcohol use, smoking) may explain our findings [18, 21, 22, 26–29, 34– 37], and also outweigh the positives hypothesized to drive the acculturative benefit in low SEP settings and within the greater GEN1 cohort [86, 90–94]. Second, nonmanual labor can often carry more workplace responsibilities than other occupational categories, potentially leading to increased psychosocial stress [102, 103] which has been linked to worse sleep [75]. Third, the sedentary nature of nonmanual labor may also partially bias our findings as fatigue can be prolonged, more noticeable, and thus more reportable in sedentary settings. Overall, a comparison of results between education and occupation helped disentangle the socioeconomic complexities by which US acculturation may shape sleep and health whereby high US acculturation may be beneficial in low SEP settings, and unfavorable in higher SEP settings.
This study had several limitations. First, cross-sectional regression analyses did not allow us to determine temporality or discount reverse causality, as sleep may also shape cultural behaviors and trends. However, the intergenerational findings provide some confidence that we are measuring temporal changes with parent to offspring acculturation. Additionally, with the employed regression methods, the extent to which our sleep outcomes overlap and confound each other is unclear as they were interrelated (Table S3). Still, given that associations are likely bidirectional, additional sleep adjustment in models would have detracted from the total association. Future studies should build on these findings with formal mediation analyses and bidirectional assessments (e.g. marginal structural models) to gain a better understanding of the overlap between sleep measures. Second, our range of acculturation was limited as we were unable to assess biculturalism and downwardly mobile intergenerational acculturative trajectories due to the limited sample size available for both measures. However, with three-level measures of intergenerational acculturation, the intermediate level (i.e. second immigrant generation and upwardly mobile acculturation) provided insight into how a more bicultural orientation may relate to sleep.
Third, there were limitations in our sleep assessments. We used subjective, unidimensional, and dichotomous measures that were not part of a standardized sleep questionnaire. However, we employed latent class methods to create a multidimensional sleep measure that captured underlying and unobservable sleep characteristics of our data [74]. Also, to our knowledge, the validity of our general fatigue assessment has not been examined and the question is not specific to sleep, so it could be related to other work and physical health factors. Still, in statistical assessments, general fatigue was associated with the other sleep measures, providing some confidence in its measurement of sleep-related fatigue. Further, as in some previous studies [104, 105], sleep apnea was measured by a self-reported doctor diagnosis. This approached omitted undiagnosed cases, and to our knowledge, the validity of a self-reported doctor diagnosis of sleep apnea has not been assessed.
Nevertheless, those less acculturated are less likely to access healthcare [106], which would lead to greater underdiagnoses of sleep apnea in the less acculturated. This would lead to differential misclassification and an overestimation of association, which provides confidence in our findings that self-reported sleep apnea diagnosis was not associated with acculturation status in our population.
Fourth, comparability between GEN1 and GEN2 was limited as cohorts were different age groups and had unique sociocultural characteristics that have accumulated over time to differentially shape health. However, our exploration of socioeconomic context among GEN1 provided some insight into how acculturation and sleep may relate among older Latinos in a high SEP setting (i.e. nonmanual labor) that was more comparable to the socioeconomic make-up of GEN2. Thus, we can infer that differential results between cohorts may be partially attributable to the different sociocultural profiles rather than age-related differences alone, though both factors likely play a role. Finally, acculturation and sleep are complex constructs, and though we considered a wide range of confounding factors from the literature, used DAGs to inform our models, and adjusted for confounding as we were able, residual confounding likely remains. For example, we did not have a measure of night shift work, which has been shown to influence sleep [107]. However, given the small percentage of employed among our two cohorts, as well as the low prevalence of night shift work among Latinos (3.5%) [107] and the total US population (4.6%) [108], the impact of night shift work on our results is unlikely to be robust
Our study had several strengths. First, we used a well-validated multidimensional measure of acculturation to account for the intricacies of culture across multiple domains of identity, behaviors, and interpersonal relationships [48]. Second, we examined acculturation and sleep within a rich intergenerational cohort to account for acculturative shifts across generations and how they may differentially shape health behaviors and conditions. We also gained insight of the sociocultural and age-related differences between the two cohorts that may influence sleep. Third, we used several unidimensional measures and created a multidimensional latent class measure for an in-depth exploration of the different dimensions and complexities of sleep [10, 74]. Fourth, we conducted multiple sensitivity assessments exploring (1) the influence of intergenerational sleep, (2) the measurement of sleep duration, and (3) sleep differences between all foreign-born participants and those only foreign-born in Mexico. Overall, these additional analyses provided further confidence in our estimates. However, future studies should continue to explore differences in sleep between Latinos of Mexican-descent and those of other Latin countries as our results suggested they may vary. Fifth, our use of PRs provided conservative estimates [109], providing confidence in the interpretation of results.
Latino sleep across generations whereby US acculturation may pattern sleep differentially by socioeconomic context, age, and the acculturative status of previous generations (i.e. intergenerational acculturation). Upon replication, future studies should seek to elucidate the underlying sociocultural and behavioral mechanisms to guide prevention and intervention efforts, and utilize prospective and intergenerational designs to parse out the temporal relations between acculturation, SEP, and sleep.
Supplementary Material
Supplementary material is available at SLEEP online.
Acknowledgments
We would like to thank the phlebotomists, interviewers, and participants for their collaboration in the study.
Funding
This work was supported by National Institute on Aging (Grant R01AG012975), National Institute of Diabetes, Digestive, and Kidney Diseases (Grant R01DK087864), and the Center for Integrative Approaches to Health Disparities, National Institute on Minority Health and Health Disparities (Grant P60 MD 002249) of the National Institutes of Health.
Conflict of interest statement. None declared.
References
1. Hunter P. To sleep, perchance to live. Sleeping is vital for health, cognitive function, memory and long life. EMBO Rep. 2008;9(11):1070–1073.
2. Jackson CL, et al. Sleep as a potential fundamental contributor to disparities in cardiovascular health. Annu Rev Public Health. 2015;36:417–440.
3. Mazzotti DR, et al. Human longevity is associated with regular sleep patterns, maintenance of slow wave sleep, and favorable lipid profile. Front Aging Neurosci. 2014;6:134. 4. Van Cauter E, et al. Impact of sleep and sleep loss on
neuroendocrine and metabolic function. Horm Res. 2007;67(Suppl 1):2–9.
5. Sleep and Sleep Disorders. http://www.cdc.gov/sleep/index. html. Accessed April 1, 2018.
6. Grandner MA. Sleep, health, and society. Sleep Med Clin. 2017;12(1):1–22.
7. Liu TZ, et al. Sleep duration and risk of all-cause mortality: a flexible, non-linear, meta-regression of 40 prospective cohort studies. Sleep Med Rev. 2017;32:28–36.
8. Wu L, et al. A systematic review and dose-response meta-analysis of sleep duration and the occurrence of cognitive disorders. Sleep Breath. 2018;22(3):805–814.
9. Yin J, et al. Relationship of sleep duration with all-cause mortality and cardiovascular events: a systematic review and dose-response meta-analysis of prospective cohort studies. J Am Heart Assoc. 2017;6(9):e005947.
10. Buysse DJ. Sleep health: can we define it? Does it matter? Sleep. 2014;37(1):9–17.
11. Sleep Health. http://www.healthypeople.gov/2020/topics-objectives/topic/sleep-health. Accessed April 1, 2018. 12. Insufficient sleep is a public health problem. http://www.
cdc.gov/features/dssleep/. Accessed April 1, 2018.
13. Carnethon MR, et al. Disparities in sleep characteristics by race/ethnicity in a population-based sample: Chicago Area Sleep Study. Sleep Med. 2016;18:50–55.
14. Grandner MA, et al. Sleep disparity, race/ethnicity, and socioeconomic position. Sleep Med. 2015;18:7–18.
15. Ralls FM, et al. Roles of gender, age, race/ethnicity, and residential socioeconomics in obstructive sleep apnea syndromes. Curr Opin Pulm Med. 2012;18(6):568–573. 16. Stamatakis KA, et al. Short sleep duration across income,
education, and race/ethnic groups: population prevalence and growing disparities during 34 years of follow-up. Ann Epidemiol. 2007;17(12):948–955.
17. Whinnery J, et al. Short and long sleep duration associated with race/ethnicity, sociodemographics, and socioeconomic position. Sleep. 2014;37(3):601–611.
18. Loredo JS, et al. Sleep health in U.S. Hispanic population. Sleep. 2010;33(7):962–967.
19. Menselson T, et al. Depression among Latinos in the United States: a meta-analytic review. J Consult Clin Psychol. 2008;76(3):355–366.
20. Ogden CL, et al. Prevalence of childhood and adult obesity in the United States, 2011-2012. JAMA. 2014;311(8): 806–814.
21. Patel SR, et al. Social and health correlates of sleep duration in a US Hispanic population: results from the Hispanic community health study/study of Latinos. Sleep. 2015;38(10):1515–1522.
22. Seicean S, et al. An exploration of differences in sleep characteristics between Mexico-born US immigrants and other Americans to address the Hispanic Paradox. Sleep. 2011;34(8):1021–1031.
23. Smagula SF, et al. Risk factors for sleep disturbances in older adults: evidence from prospective studies. Sleep Med Rev. 2016;25:21–30.
24. Grandner MA, et al. Sleep symptoms, race/ethnicity, and socioeconomic position. J Clin Sleep Med. 2013;9(9):897–905; 905A.
25. Napier AD, et al. Culture and health. Lancet. 2014;384(9954):1607–1639.
26. Abraído-Lanza AF, et al. Latino immigrants, acculturation, and health: promising new directions in research. Annu Rev Public Health. 2016;37:219–236.
27. Abraído-Lanza AF, et al. Toward a theory-driven model of acculturation in public health research. Am J Public Health. 2006;96(8):1342–1346.
28. Fox M, et al. Acculturation and health: the moderating role of socio-cultural context. Am Anthropol. 2017;119(3):405–421. 29. Schwartz SJ, et al. Rethinking the concept of acculturation: implications for theory and research. Am Psychol. 2010;65(4):237–251.
30. Thomson MD, et al. Defining and measuring acculturation: a systematic review of public health studies with Hispanic populations in the United States. Soc Sci Med. 2009;69(7):983–991.
31. Thakkar MM, et al. Alcohol disrupts sleep homeostasis. Alcohol. 2015;49(4):299–310.
32. Ogilvie RP, et al. The epidemiology of sleep and diabetes. Curr Diab Rep. 2018;18(10):82.
34. Riosmena F, et al. Negative acculturation and nothing more? Cumulative disadvantage and mortality during the immigrant adaptation process among Latinos in the United States. Int Migr Rev. 2015;49(2):443–478.
35. Abraído-Lanza AF, et al. Do healthy behaviors decline with greater acculturation? Implications for the Latino mortality paradox. Soc Sci Med. 2005;61(6):1243–1255.
36. Castañeda H, et al. Immigration as a social determinant of health. Annu Rev Public Health. 2015;36:375–392.
37. Lara M, et al. Acculturation and Latino health in the United States: a review of the literature and its sociopolitical context. Annu Rev Public Health. 2005;26:367–397.
38. Cunningham TJ, et al. Racial/ethnic disparities in self-reported short sleep duration among US-born and foreign-born adults. Ethn Health. 2016;21(6):628–638.
39. Hale L, et al. Negative acculturation in sleep duration among Mexican immigrants and Mexican Americans. J Immigr Minor Health. 2011;13(2):402–407.
40. Hale L, et al. Acculturation and sleep among a multiethnic sample of women: the Study of Women’s Health Across the Nation (SWAN). Sleep. 2014;37(2):309–317.
41. Kachikis AB, et al. Predictors of sleep characteristics among women in southeast Texas. Womens Health Issues. 2012;22(1):e99–109.
42. Heilemann MV, et al. Factors associated with sleep disturbance in women of Mexican descent. J Adv Nurs. 2012;68(10):2256–2266.
43. Barclay NL, et al. Quantitative genetic research on sleep: a review of normal sleep, sleep disturbances and associated emotional, behavioural, and health-related difficulties. Sleep Med Rev. 2013;17(1):29–40.
44. Ruiz RJ, et al. Family cohesion, acculturation, maternal cortisol, and preterm birth in Mexican-American women. Int J Womens Health. 2013;5:243–252.
45. Aizer A, et al. Maternal stress and child outcomes: evidence from siblings. J Hum Resour. 2016;51(3):523–555.
46. Fox M, et al. Intergenerational transmission of the effects of acculturation on health in Hispanic Americans: a fetal programming perspective. Am J Public Health. 2015;105(Suppl 3):S409–S423.
47. Haan MN, et al. Prevalence of dementia in older Latinos: the influence of type 2 diabetes mellitus, stroke and genetic factors. J Am Geriatr Soc. 2003;51(2):169–177.
48. Cuellar I, et al. Acculturation Rating Scale for Mexican Americans-II: a revision of the original ARSMA Scale. Hispanic J Behav Sci. 1995;17(3):275–304.
49. Jimenez DE, et al. Using the Revised Acculturation Rating Scale for Mexican Americans (ARSMA-II) with older adults. Hisp Health Care Int. 2010; 8(1):14–22.
50. Ward JB, et al. Intergenerational education mobility and depressive symptoms in a population of Mexican origin. Ann Epidemiol. 2016;26(7):461–466.
51. Afable-Munsuz A, et al. Immigrant generation and diabetes risk among Mexican Americans: the Sacramento area Latino study on aging. Am J Public Health. 2014;104(Suppl 2):S234–S250.
52. Blunden S, et al. The complexities of defining optimal sleep: empirical and theoretical considerations with a special emphasis on children. Sleep Med Rev. 2014;18(5): 371–378.
53. González P, et al. Measurement properties of the Center for Epidemiologic Studies Depression Scale (CES-D 10): findings from HCHS/SOL. Psychol Assess. 2017;29(4):372–381.
54. Kohout FJ, et al. Two shorter forms of the CES-D (Center for Epidemiological Studies Depression) depression symptoms index. J Aging Health. 1993;5(2):179–193.
55. Cespedes EM, et al. Comparison of self-reported sleep duration with actigraphy: results from the Hispanic Community Health Study/Study of Latinos Sueño Ancillary Study. Am J Epidemiol. 2016;183(6):561–573.
56. Lauderdale DS, Knutson KL, Yan LL, Liu K, Rathouz PJ. Sleep duration: how well do self-reports reflect objective measures? The CARDIA Sleep Study. Epidemiology (Cambridge, Mass). 2008;19(6):838–845.
57. Covassin N, et al. Sleep duration and cardiovascular disease risk: epidemiologic and experimental evidence. Sleep Med Clin. 2016;11(1):81–89.
58. Iftikhar IH, et al. Sleep duration and metabolic syndrome. An updated dose-risk metaanalysis. Ann Am Thorac Soc. 2015;12(9):1364–1372.
59. Lo JC, et al. Self-reported sleep duration and cognitive performance in older adults: a systematic review and meta-analysis. Sleep Med. 2016;17:87–98.
60. Jike M, et al. Long sleep duration and health outcomes: a systematic review, meta-analysis and meta-regression. Sleep Med Rev. 2018;39:25–36.
61. Greenland S. Modeling and variable selection in epidemiologic analysis. Am J Public Health. 1989;79(3):340–349. 62. Fry R, et al. How Millennials today compare with their grandparents 50 years ago. http://www.pewresearch.org/ fact-tank/2018/03/16/how-millennials-compare-with-their-grandparents/, Accessed April 1, 2018.
63. Lopez G, et al. Educational Attainment, by Nativity and Region of Birth: 1960–2015. Facts on US Immigrants: Statistical Portrait of the Foreign-born Population in the United States. Washington, DC: Pew Research Center; 2017.
64. Albrecht SS, et al. Socioeconomic gradients in body mass index (BMI) in US immigrants during the transition to adulthood: examining the roles of parental education and intergenerational educational mobility. J Epidemiol Community Health. 2014;68(9):842–848.
65. Zeki AHA, et al. Associations of intergenerational education with metabolic health in U.S. Latinos. Obesity (Silver Spring). 2015;23(5):1097–1104.
66. Garcia L, et al. Influence of neighbourhood socioeconomic position on the transition to type II diabetes in older Mexican Americans: the Sacramento Area Longitudinal Study on Aging. BMJ Open. 2016;6(8):e010905.
67. Zeki AHA, et al. Neighborhood socioeconomic context and cognitive decline among older Mexican Americans: results from the Sacramento Area Latino Study on Aging. Am J Epidemiol. 2011;174:423–431.
68. Winkleby MA, et al. Socioeconomic status and health: how education, income, and occupation contribute to risk factors for cardiovascular disease. Am J Public Health. 1992;82(6):816–820.
69. Herd P, et al. Socioeconomic position and health: the differential effects of education versus income on the onset versus progression of health problems. J Health Soc Behav. 2007;48(3):223–238.
70. Liang KY, et al. Longitudinal data analysis using generalized linear models. In: Biometrika. 1986;73:13–22.
71. Zou GY, et al. Extension of the modified Poisson regression model to prospective studies with correlated binary data. Stat Methods Med Res. 2013;22(6):661–670.