1
Photovoltaic Emulator
LabVIEW Based Modeling and Simulation
By
Jeffrey So and Eric Tse
Senior Project Advised by Dale Dolan
ELECTRICAL ENGINEERING DEPARTMENT California Polytechnic State University
2
Table of Contents
Abstract: ... 5
Section 1: Introduction ... 6
Section 2: Project Planning ... 7
2.1 Customer Needs ... 7
2.2 Requirements and Specifications ... 7
2.3 Functional Decomposition ... 10
2.4 Project Planning (Gantt Chart and Cost Estimates) ... 13
2.5 Cost Estimates ... 15
Section 3: System Design ... 16
3.1 Electrical Equivalent of Solar Cell ... 16
3.2 Physical Model of a Solar Cell ... 18
3.3 Key Variables ... 19
3.3.1 Irradiance ... 19
3.3.2 Temperature ... 20
3.3.3 Bandgap Energy and Diode Ideality Factor ... 21
3.3.4 Series and Parallel Resistances ... 21
3.4 Nomenclature ... 22
3.5 Key Formulae ... 23
Section 4: System Implementation ... 24
Section 5: System Operation ... 28
3
5.3 Specification Verification ... 31
Section 6: Conclusion ... 32
Appendix A. Senior Project Analysis ... 35
Appendix B: Alterations and Changes ... 40
List of Figures Figure 1. Level 0 Block Diagram for PV Device Emulator ... 10
Figure 2. Level 1 Block Diagram for PV Device Emulator ... 11
Figure 3. Gantt Chart Full ... 13
Figure 4. Fall Quarter Break Down ... 14
Figure 5. Winter Quarter Break Down ... 14
Figure 6. Spring Quarter Break Down ... 14
Figure 7. Ideal Model of PV Cell ... 16
Figure 8. Realistic Model of PV Cell ... 16
Figure 9. Realistic Model of PV Module ... 17
Figure 10. Solar Cell as Semiconductors ... 18
Figure 11. Solar Cell PN Junction ... 18
Figure 12. Operational Process of a Solar Semiconductor ... 19
Figure 13. Effects of Irradiance on Solar Panel Performance... 20
Figure 14. Effects of Temperature on Solar Panel Performance ... 20
Figure 15. Main System Algorithm ... 24
4
Figure 17. Calculator Blocks ... 26
Figure 18. Output Current to IV and PV Curves ... 27
Figure 19. True/False Statement ... 27
Figure 20. System Front Panel ... 28
Figure 21. PV Emulator: Jap6-2-305 Operating at Gnom and Tr ... 29
Figure 22. PV Emulator: Tapan Ds-100 Operating at Gnom and Tr ... 29
Figure 23. Emulator: Jap6-72 G = 600, Tc = 313K ... 30
Figure 24. Emulator: Tapan Ds-100M G =800, Tc = 283K ... 30
List of Tables Table 1. PV Emulator Marketing Requirements ... 7
Table 2. PV Emulator Requirements and Specifications ... 8
Table 3. PV Device Emulator Senior Project Deliverables ... 9
Table 4. PV Device Emulator Senior Project Level 0 I/O and Functionality Descriptions ... 10
Table 5. CPU Level 1 Functionality Description ... 11
Table 6. LabView Level 1 Functionality Description ... 12
Table 7. Programmable DC Power Supply Level 1 Functionality Description ... 12
Table 8: Cost Estimate Breakdowns ... 15
Table 9. Nomenclature ... 22
Table 10. Engineering Specifications Verification ... 31
5
Abstract:
The design goal for this project is to create a system capable of creating a consistent testing environment for photovoltaic inverters and charge controllers. The solution is to create a photovoltaic emulator which is a DC power supply that would have the same electrical output characteristics to a photovoltaic panel. In current systems, consistency problems arise when depending on nature to conduct tests on PV modules because it is impossible to properly replicate scenarios while testing specific conditions. This project will provide the user the ability to test their PV modules under various parameters which replicate real-world scenarios such as temperature and weather conditions. This paper will outline the design and simulation of a photovoltaic emulator.
Regarding the change in learning environment due to Covid-19, the original scope of the project had to be appropriately adjusted. All aspects of “Section 2: Project Planning” as well as the “Appendix A: Senior Project Design Analysis” will still account for the original design choices made during fall quarter preparation. “Section 3: System Design” will more accurately reflect the true scope of project. Please refer to “Appendix B: Alterations Due to Covid-19” for more details
6
Section 1: Introduction
Sustainable/renewable energy is becoming increasingly popular, with more and more companies dedicating money and resources into researching photovoltaic (PV) systems. In current solar technology, most solar cells are created using either polycrystalline or
monocrystalline silicon which effectively determine the appearance and efficiency of a solar panel [1]. Polycrystalline panels are cheaper and less efficient when compared to
monocrystalline panels, but both are still within industry standard. When looking at the top of
the line solar panels available in today’s market [2]-[3], monocrystalline solar cells are still widely more efficient.
With the many options of solar cells, more technologies are being developed with the intention of using solar energy to supply power such as PV inverters and power point tracking converters. Unfortunately, effective ways to test these devices are not widely available. Field testing cannot be relied upon due to the variations of conditions such as shade and temperature that can affect solar panel efficiency. Ultimately, increasing interests in PV devices lead to the logical conclusion of creating appropriate test equipment for these devices.
A photovoltaic emulator can be created through a variety of designs. One such method is to develop a PV emulator using a DC-DC converter such as a buck converter to study control and operating schemes [4]. Another method is to utilize a programmable DC power supply and implement the proper scripts to have the power supply output similar current and voltage characteristics to an array of PV cells [5]. The benefit of using an emulator vs a true PV panel is that the emulator allows for sustainable and repeatable test conditions on various equipment and systems.
7
Section 2: Project Planning
2.1 Customer Needs
The customer needs primarily center around the necessity for a stable and consistent testing environment for systems which take PV energy as an input. For modules which intake power sourced from solar cells, it is difficult to maintain testing conditions for extended periods of time due to variations in irradiance and temperature in nature. This problem was identified and brought to our attention by Dr. Dolan on the senior project listing and description. Upon further research, it was found that many pre-existing testing methods are large scale and costly in nature. There are not many solutions for smaller scale testing. Finally, the goals of this project should be easily tested by comparing the system outputs to the real-world data curves of existing solar cells. Tables 1 and 2 below summarize the different marketing and engineering specifications for the PV emulator. These specifications outline how a PV emulator should work and operate based on customer needs.
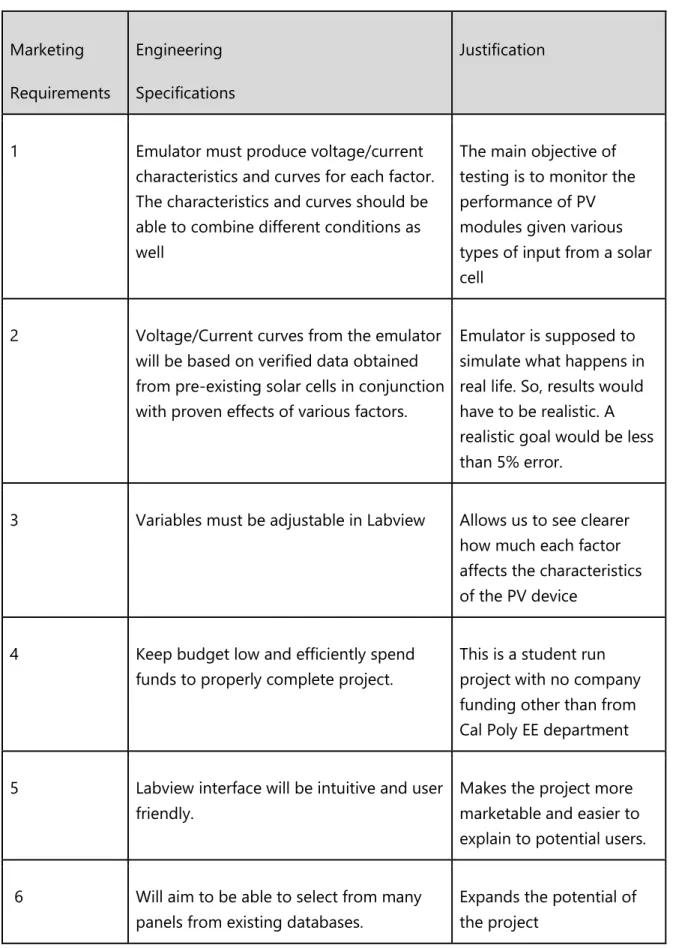
2.2 Requirements and Specifications
Table 1. PV Emulator Marketing Requirements
Marketing Requirements
1. Must be able to factor in a variety of different conditions which can affect solar cells
such as cloud cover, temperature, front surface soiling, etc…
2. Simulated effects of the emulator should have high accuracy when compared to effects in real life.
3. Factors that contribute to change in PV characteristics just be controllable/ adjustable 4. Small Scale and Cost Effective
5. Easy to understand and use
8
Table 2. PV Emulator Requirements and Specifications
Marketing Requirements
Engineering Specifications
Justification
1 Emulator must produce voltage/current characteristics and curves for each factor. The characteristics and curves should be able to combine different conditions as well
The main objective of testing is to monitor the performance of PV modules given various types of input from a solar cell
2 Voltage/Current curves from the emulator will be based on verified data obtained from pre-existing solar cells in conjunction with proven effects of various factors.
Emulator is supposed to simulate what happens in real life. So, results would have to be realistic. A realistic goal would be less than 5% error.
3 Variables must be adjustable in Labview Allows us to see clearer how much each factor affects the characteristics of the PV device
4 Keep budget low and efficiently spend funds to properly complete project.
This is a student run project with no company funding other than from Cal Poly EE department
5 Labview interface will be intuitive and user friendly.
Makes the project more marketable and easier to explain to potential users.
6 Will aim to be able to select from many panels from existing databases.
9
Table 3. PV Device Emulator Senior Project Deliverables
Delivery Date Deliverable Description
December 3, 2019
Design Review
March 15, 2020
EE 461 demo
March 20, 2020
EE 461 report
May 20, 2020 EE 462 demo
May 25, 2020 ABET Sr. Project Analysis
May 29, 2020 Sr. Project Expo Poster
June 5, 2020 Senior Project Final Demo
10
2.3 Functional Decomposition
Table 4. PV Device Emulator Senior Project Level 0 I/O and Functionality Descriptions
Module PV device emulator
Inputs DC power supply power (120V AC)
User defined input factors: these change the characteristics of predetermined solar cell output. (ex: Irradiance, PV material/type, temperature, cloud cover, etc.)
Outputs Simulated voltage/current curves of PV device
Power Output based on current and voltage generated by simulated cells of the emulator (from DC power supply)
Functionality Device will allow the reproduction of PV inputs into devices under test. Simulates the outputs of solar cells using LabView as the UI allowing for a wide range of user designed variables. The output of this device must be consistent under the defined conditions.
11
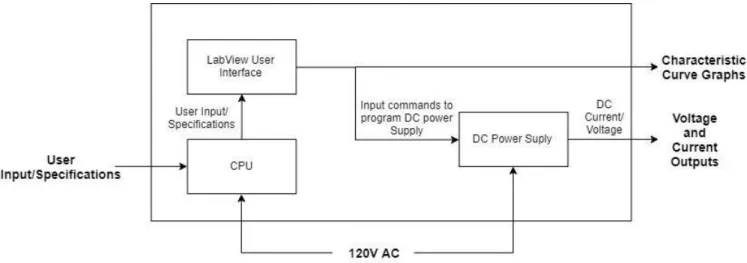
Taking a more system level approach, Figure 1. and Table 4. both provide a brief analysis of the inputs and outputs for the PV emulator. As mentioned earlier, the primary design goal is to output accurate electrical characteristics of existing solar cells based on user generated inputs. Looking at Figure 2, the level one block diagram splits the overall system into the various components needed to create the whole emulator. Tables 5, 6, and 7 then provide the detailed analysis for each components’ inputs and outputs.
Figure 2. Level 1 Block Diagram for PV Device Emulator
Table 5. CPU Level 1 Functionality Description
Module CPU
Inputs - 120V AC from wall
- User Input/Specifications
Outputs - Translated User Input/Specifications to
Labview
Functionality - The CPU serves as the primary
12
Table 6. LabView Level 1 Functionality Description
Module LabView User Interface
Inputs - Translated User Input/Specifications
Outputs - Simulated Curves and Graphs
representing PV cell outputs
- Input Commands to DC Power Supply - User Interface
Functionality - LabView will be the software in charge
of programming the DC Power Supply as well as providing the user an easy to operate interface
Table 7. Programmable DC Power Supply Level 1 Functionality Description
Module Programmable DC Power Supply
Inputs - 120V AC from wall
- Input commands from LabView
Outputs - DC Voltage/Current
Functionality - The DC power supply will take in
13
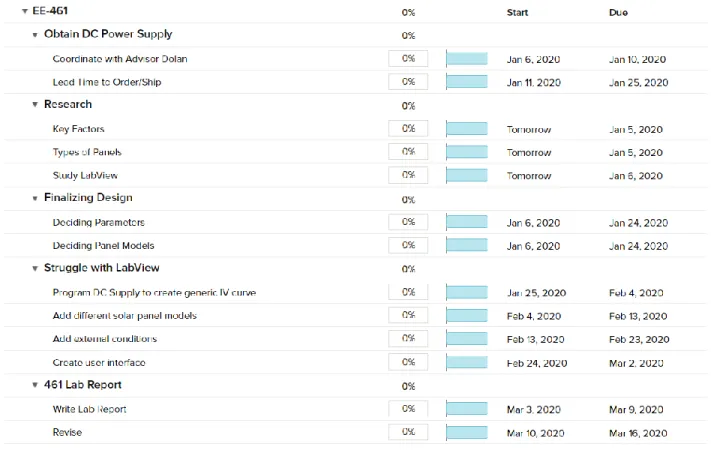
2.4 Project Planning (Gantt Chart and Cost Estimates)
Figure 3. Gantt Chart Full
14
Figure 4. Fall Quarter Break Down
Figure 5. Winter Quarter Break Down
15
2.5 Cost Estimates
Table 8: Cost Estimate Breakdowns
Item Amount ($) Source/Justification
LabView
Software $0
Cal Poly Library Software provides a free download of LabView Designer Suite
Programmable DC Power
Supply TBD
Will be working with Senior Project Advisor to obtain this
unit…. Price remains unknown
Labor 1800 Approximately 60 hours at $30/hr
Wire-Wound Power Resistor
and Cables ~$70
To properly simulate PV source, we need a massive power resistor capable of handling power in the Kilowatt range Source:
https://americas.rsdelivers.com/product/te- connectivity/te1000b10rj/te-connectivity-te-series-solder-lug-wire- wound/7015793?cm_mmc=US-PLA-DS3A-_-google-_- PLA_US_EN_CatchAll_New-_-Catch+All-_- PRODUCT_GROUP&matchtype=&pla-673097410467&gclid=CjwKCAiA5o3vBRBUEiwA9PVzagthtx5J4_vc4qdxp39y7 tL4nU_2ksNMOC2JafRsgC3fu_WpSWDhLBoC0dcQAvD_BwE&gclsrc=aw.ds
LabView Text ~$12
16
Section 3: System Design
The overall scope of the project has been defined through sections one and two. To continue the design process, the purpose of this section will be to introduce a more technical background in properly modeling a photovoltaic module using LabVIEW. Key parameters and the formula which integrate them will be highlighted below [4].
3.1 Electrical Equivalent of Solar Cell
Typically, solar panels can be represented by a diode-based circuit which can then be mathematically modeled to demonstrate the electrical functioning of the cell.
Figure 7. Ideal Model of PV Cell
Figure 8. Realistic Model of PV Cell
17
the diode model above is not a photodiode. Solar cells are optimized for converting light energy to electricity while photodiodes are optimized for detecting light energy.
Figure 8 represents a more realistic model of a solar cell in which series and parallel resistances for a cell are accounted for. The software program being developed for this senior project will accommodate both singular PV cells as well as PV modules, which are the same cells connected in some combination of series or parallel. It should be noted that all typical PV generation systems will be built using PV modules rather than single cells. Figure 9 above is a
representation of the same PV cell used in Figure 8 but configured as a module with N number of parallel and series components [7] .
18
3.2 Physical Model of a Solar Cell
Figure 10. Solar Cell as Semiconductors
Figure 11. Solar Cell PN Junction
Moving away from the electrical model of the solar cell, it is also important to understand the physical model of a solar cell. Shown in Figure 10, a solar cell can be best represented as two semiconductors sandwiched together which absorb light energy and convert it into electricity. The semiconductors are able to perform this conversion due to the underlying physics behind having two distinct electron energy levels, the valence band and the conduction band which are created by the joining of a P-type and N-type semiconductor [8].
19
which electrons transition from the N-type region to concentrate in the P-type region leaving behind positive vacancies in the originally negative N-type. Inside the depletion region, the presence of oppositely charged ions will induce an internal electric field that prevents any further movement of elections. This state of equilibrium will be maintained until the solar cell is subjected to light energy in the form of photons as seen in Figure 12.
Figure 12. Operational Process of a Solar Semiconductor
Following the process of Figure 12, the valence band is where low level electrons lay. Once sunlight strikes the cell, photons with more energy than the band gap will excite the low level electrons to jump into the conduction band leaving behind a positive hole in the valence band. Once the electrons are ejected, the previously induced electric field will facilitate the movement of electrons, effectively creating the photocurrent of the cell [9].
3.3 Key Variables
With some understanding of the electrical circuit model of a solar cell and the physics behind solar cell functionality, it is important to introduce the variables which can affect the output of a solar cell from its ideal state. These variables include environmental factors as well as intrinsic features of the solar cell due to the materials chosen to create it.
3.3.1 Irradiance
20
Figure 13. Effects of Irradiance on Solar Panel Performance
3.3.2 Temperature
Temperature also plays a pivotal role in the output characteristics of a solar cell due the electron bandgap energy having a significant dependence on temperature. The bandgap energy of a semiconductor is the amount of energy needed for excite an electron from the valance band to the conduction band. This also directly relates to the open circuit voltage of the solar cell as the maximum allowable voltage across a cell is equal to the bandgap energy. A key behavior followed by all semiconductors is that an increase in temperature results in a decrease in bandgap energy. Effectively, less voltage is needed to excite an electron and the maximum voltage seen across the cell will decrease. Figure 14 below references the same JA solar panel from Figure 13. It can be observed that increasing temperature will decrease the allowable open circuit voltage while slightly increasing short circuit current [10].
21
3.3.3 Bandgap Energy and Diode Ideality Factor
The two factors of bandgap energy and diode ideality factor are intrinsic to the material sourced in building the solar cell. As described in both sections 3.2 and 3.3.2, bandgap energy is a
parameter derived from the semiconductor material used to generate the PN junction. Diode ideality on the other hand refers to how closely the diode used in the electrical model of a solar cell follows the mathematical performance of an ideal diode. Typically the ideality factor will be between values of 1 and 2 where 1 represents an absolutely ideal diode. The values of band gap energy and diode ideality will ultimately vary depending different solar cell materials[10].
3.3.4 Series and Parallel Resistances
22
3.4 Nomenclature
Table 9. Nomenclature
IPH Photocurrent
IRS Reverse Saturation Current
IO Saturation Current
I Output Current
VOC Open Circuit Voltage
ISC Short Circuit Current
VOCR Temp Rated VOC
ISCR Temp Rated ISC
G Irradiance
GNom Nominally Rated Irradiance
TC Cell Temp
TR Rated Cell Temp
Kisc Short Circuit Temp Coeff.
A Diode Ideality Factor
EG Bandgap Energy
NS Number of Cells in Series
NP Number of Cells in Parallel
RS Series Resistance
RSh Shunt/Parallel Resistance
K Boltzmann Constant = 1.6*10-19
23
3.5 Key Formulae
Keeping in mind the circuit diagram in Figure 8, the mathematical formulation can be used to better understand the workings of a solar cell.
𝐼
𝑃𝐻=
𝐺𝐺𝑁𝑜𝑚
∗ [ 𝐼
𝑆𝐶+ 𝐾
𝑖∗ (𝑇
𝐶− 𝑇
𝑟)]
(1)
𝐼
𝑅𝑆= 𝐼
𝑆𝐶𝑅÷ [ exp (
𝑞∗𝑉𝑂𝐶𝑅𝑁𝑆∗𝐾∗𝐴∗𝑇𝐶
) − 1 ]
(2)
𝐼
𝑂= 𝐼
𝑅𝑆∗ (
𝑇𝐶𝑇𝑅
)
3∗ [exp (
𝑞∗𝐸𝐺𝐴∗𝐾
) ∗ (
1 𝑇𝐶−
1
𝑇𝑅
) ]
(3)
𝐼 = (𝑁
𝑃∗ 𝐼
𝑃𝐻) − 𝑁
𝑃∗ 𝐼
𝑂∗ [exp (
𝑞∗(𝑉+𝐼∗𝑅𝑆)𝑁𝑆∗𝐾∗𝐴∗𝑇𝐶
)]
(4)
𝐼
𝑆𝐻=
(𝑉∗𝑁𝑃
𝑁𝑆)+(𝐼∗𝑅𝑆)
𝑅𝑆𝐻
(5)
Equations 1 – 4 are the core equations used to accurately model solar panels for this project. These 4 equations are standardized throughout the solar industry and can be cross referenced across varying articles apart from varying variable nomenclature [6].
24
Section 4: System Implementation
As stated in the original project specifications, the model of the solar cell will be built using LabVIEW 2019. LabVIEW is a well-established software with plenty of available online resources and support. Another reason for originally choosing LabVIEW was the proven power supply drivers which would have been used to interface with the BK Precision 9153 Power Supply. Unfortunately, due to limitations imposed by Covid-19, the power supply interfacing was removed from the system implementation.
Figure 15. Main System Algorithm
The main system algorithm used to model a solar cell was derived through the cross-referencing of multiple studies of varying methodologies. The final product can be visualized through Figure 15 where solar cell parameters and user defined temperature and irradiance are the inputs while Solar IV and PV curves are the output.
The system functions first as a top level While Loop controlled by a single start/stop operator. This While Loop allows the system to run in real-time and produce dynamic data given by user command [11].
A middle level For Loop is defined by a maximum voltage level determined by the user. By
25
Figure 16 provides a detailed look at the manipulations used to successfully calculate and graph
more voltage points. The control input named “voltage points” represents an integer value
defined by the user. By multiplying the value by 100, the total number of iterations is directly increased by a factor of 100. Adding one to that value brings the final iteration number to the
set max voltage rather than “max voltage –1 “. Then, for each iteration, the system divides the
current counter by 100 to achieve the mV resolution discussed earlier.
26
Within each For Loop, the input parameters from the solar panel as well as the user are sent into calculator blocks represents equations 1-4 from Section 3.5. The calculators were developed using the LabVIEW Mathscript Module which is an external download from the main LabVIEW package. This addition module allows for mathematical equations to be represented by singular blocks rather than individual numeric components [12].
Figure 17. shown below demonstrates how the Mathscript Modules are used to determine various constants such as IPH, and IO by taking inputs such as Cell Temperature or Irradiance. These calculated values link to other calculator blocks result in the values used to generate the
solar panels’ I-V characteristics curve as well as the P-V characteristic curve.
27
Figure 18. shows the final calculator block for the output current. The system takes in the calculated current and plots it against the voltages defined by Figure 16. Original
implementation produced grossly negative current values for voltages past the open circuit
voltage caused by LabVIEW’s usage of feedback loops. An If Statement is implemented to
remove unwanted negative Voltages from the I-V curve. Doing so flattened out the curve of the I-V graph and allows the data to be exported from the graph accurately. Figure 19. Represents the True vs False algorithm used to negate the issues mentioned above.
Figure 18. Output Current to IV and PV Curves
28
Section 5: System Operation
The final deliverable is best depicted by Figure 20 below. To operate the emulator, the user must first define the parameters for a specific solar panel and input them into the array labeled “solar panel properties”. These values can easily be found in any datasheet for the solar module. The area labeled as “constant inputs” are also variable should the user desire but should remain the
same for typical usage. Once the parameters are decided upon, the two sliders representing Irradiance and Cell Temperature allow for dynamic data input which will be reflected in the output curves on the bottom left of the GUI.
29
5.2 IV and PV Curves
To verify emulator accuracy, the results of the system were cross referenced with solar module data sheets as well as with similar emulator models described in reference articles. Figures 21 –
24 show the system performance of two different solar panels with varying input conditions. In comparing the system output to datasheet values and other simulators, it can be observed that the system produces highly accurate results. The outputs for the Jap6-2-305 can be compared to the data sheet curves used earlier in this paper in Figures 13 and 14 [3].
Figure 21. PV Emulator: Jap6-2-305 Operating at Gnom and Tr
30
Figure 23. Emulator: Jap6-72 G = 600, Tc = 313K
Figure 24. Emulator: Tapan Ds-100M G =800, Tc = 283K
31
5.3 Specification Verification
The table below compares our final project with the original engineering specifications from Fall 2019.
Table 10. Engineering Specifications Verification
Engineering Specifications Final Results
Emulator must produce voltage/current characteristics and curves for each factor. The characteristics and curves should be able to combine different conditions as well
Emulator can produce I-V and P-V curves while factoring in temperature and irradiance
Voltage/Current curves from the emulator will be based on verified data obtained from pre-existing solar cells in conjunction with proven effects of various factors.
By referring to section 5.2, provided output curves match existing datasheet curves.
Variables must be adjustable in LabView Temperature and irradiance can be dynamically adjusted in LabView
Keep budget low and efficiently spend funds to properly complete project.
Able to cut costs due to Cal Poly offering LabVIEW licenses, and no longer needing to factor in power supply with test equipment
LabView interface will be intuitive and user friendly.
LabView interface is clearly labeled, with slots, sliders, and knobs where the user can easily find and adjust the solar panel properties, the temperature, as well as the irradiance
Will aim to be able to select from many panels from existing databases.
32
Section 6: Conclusion
Using the single diode model of a solar cell, this paper describes the physics and formulae used to construct an accurate photovoltaic emulator. This paper also describes the algorithms used to implement the emulator in LabView 2019. By describing and developing this emulator, this paper aims to assist future students and researchers alike in developing a stronger
understanding of photovoltaic cells and their operation.
The overall design of the emulator is intuitive and operates fluently with the user interface. Output curves adjust instantaneously to real time inputs with accuracy up to 100% given standard testing data. The user defined “solar cell parameters” array allows for the potential of having an infinite number of solar cells in the emulator.
33
References
[1] Energysage, “Monocrystalline vs polycrystalline solar panels,” Learn About Solar. December
2019.
[2] “Tapan Solar Datasheet,” DS-100 datasheet, 2017
https://www.enfsolar.com/pv/panel-datasheet/crystalline/30444
[3] “JA Solar Datasheet,” JAP6 datasheet, 2017
https://si-datastore.s3.us-west-2.amazonaws.com/documents/xYVBBOld3r02dQSoVigbAmMaN8NFZQlDylXzun5M.pdf
[4] D. Dolan, J. Durago, J. Crowfoot and Taufik, "Simulation of a photovoltaic emulator," North
American Power Symposium 2010, Arlington, TX, 2010, pp. 1-7.
doi: 10.1109/NAPS.2010.5618941
[5] A. A. Aya, J. Nehaja, A. Z. Tassneem, and I. Atif, “Design and Implementation Of Solar Pv Emulator Using Magna Dc Power Supply,” i-manager’s Journal on Electrical Engineering, vol. 11,
no. 4, p. 1, Jun. 2018
[6] Vinod, Raj Kumar, S.K. Singh,”Solar photovoltaic modeling and simulation: As a renewable energy solution,”Energy Reports ,Volume 4, 2018, pp 701-712,ISSN 2352-4847,
https://doi.org/10.1016/j.egyr.2018.09.008.
[7] Nguyen, X.H., Nguyen, M.P., “Mathematical modeling of photovoltaic cell/module/arrays with tags in Matlab/Simulink.” Environ Syst Res 4, 24 (2015).
https://doi.org/10.1186/s40068-015-0047-9
[8] “How a Solar Cell Works,” American Chemical Society. [Online]. Available:
https://www.acs.org/content/acs/en/education/resources/highschool/chemmatters/past-issues/archive-2013-2014/how-a-solar-cell-works.html.
[9] “Solar Cells: A Guide to Theory and Measurement,” Ossila. [Online]. Available:
https://www.ossila.com/pages/solar-cells-theory. [Accessed: 15-Jun-2020].
[10] “Solar Cell Operation Effect of Temperature,” PVEducation. [Online]. Available:
34
[11] J. Essick, Hands-on introduction to LabVIEW for scientists and engineers. New York, NY: Oxford University Press, 2019.
[12] Muhammad Kamran, Muhammad Bilal and Zeeshanjahan Zaib, “LabVIEW Based Simulator for Solar Cell Characteristics and MPPT Under Varying Atmospheric Conditions.” [Online].
35
Appendix A. Senior Project Analysis
Table 11. ABET Senior Project Analysis
Project Title: PhotoVoltaic Emulator
Student’s Name: Eric Tse , Jeffrey So Student’s Signature:Eric Tse , Jeffrey So
Advisor’s Name: Dale Dolan Advisor’s Initials: Date:
• 1. Summary of Functional Requirements
The main feature of the system should emulate the voltage and current characteristics of existing PV modules with a percent error of less than 10%. Secondary features of the system include providing the user a variety of input options to emulate a wide range of conditions. Furthermore, the system should be designed to accommodate any user, and so must be intuitive with a clean graphical user interface.
• 2. Primary Constraints
The primary limiting factor of concern will be the amount of work hours capable of being invested towards this project. The design group consists of only two senior standing members, each with at least an addition 12-14 units of classes on top of the designated senior project class. Another limiting factor that directly relates to the amount of time being invested, is the level of prior experience towards the subject matter. Both members of this group have zero experience working with PV modules, solar energy, and LabView. With the limited starting baseline, a significant portion of the invested time will be allocated towards research along with trial and error.
• 3. Economic
The largest economic impact will be towards human capital. As this project consists primary of a software design in LabView, as well as the necessary research to properly emulate solar cells, the majority of costs will be shouldered by work hours put in by team members. Outside of human labor wages, the monetary costs should not be too significant. The LabView text and large power resistor costs will not exceed $150 and most likely be brought down after further shopping and research. As seen in table 7, they are currently estimated to cost ~$120 this represents the original estimated cost of component parts.. An area of concern,
36
component should not incur any costs as it is currently under the assumption of being obtained via the project advisor. In terms of environmental costs, nothing significant is at stake. The power supply itself will draw a large amount of current to produce results, but there are no concerns of any bio/chemical waste and costs.
During the course of this project, no monetary benefits are expected to arise. The goal is to create a PV emulator to test devices which require photo-voltaic energy as an input. Once finished, the software should be sold for about $59 per license. Under current assumptions, all costs will currently be covered by the team members, but will eventually be reimbursed by the Electrical Engineering department so long as costs remain with $200 which is what the budget allows for. The timeline to manufacture is to hopefully have a working product by the
beginning of June, and once created, there should be little upkeep as it is a software file at the core.
• 4. If manufactured on a commercial basis:
The software can be sold in mass amounts, and since each company will need one license per person, it is estimated that upwards to a hundred thousand licenses will be sold per year. License holders will be required to pay once a year to access our software to ensure that our company is sustainable. The manufacturing cost for the PV emulator will be fairly low, with only the need to maintain the software to be bug free. Adding more features will require a small team of one or two, and at a cost of $30 an hour, it is estimated that maintaining the emulator will cost 10 hours of labor, or $300, per month and $3600 yearly. Charging $59 yearly would yield $590 thousand, and $586,400 after software maintenance costs. With a small server to keep the emulator updated, it would cost an extra thousand dollars yearly, which brings our profits to $585,400.
• 5. Environmental:
This project should have the potential to positively influence the environment. By supporting the design and validation of devices requiring PV inputs, the project promotes the usage of the renewable resource of sunlight. So while not directly using sunlight itself, the project helps facilitate the improvement of other devices that do directly use the natural resource. The limited physical materials being used to create the emulator also means less overall waste and emission. The primary benefits will be the overall ecosystems in the world as an increased usage of solar energy means less usage of energies that are known to create many carbon emissions. A cleaner air and less waste also benefits all species that call the natural
37
Physical components will be used to initially validate the functionality of this project, but upon completion, the product itself is primary code outside of the user provided DC power supply. Therefore, it is safe to say there is little to no environmental impact associated with any large scale distribution of the product.
• 6. Manufacturability:
Manufacturing the PV emulator requires a lot of research. If the research is off, the PV emulator may not be accurate, which could discredit the entire software. With that being said, the research done on the emulator must be precise. If the emulator doesn't give accurate information, then no one would want to use the software. With that being said, while research will be the most critical part of accurately designing the emulator, properly writing the
software will be the most challenging aspect of this project. A higher proficiency in LabView will ultimately equate to a more accurate emulator.
• 7. Sustainability:
Maintaining the emulator will not be too challenging as it is not an intricate software. Once all the research has been done and the emulator created, the only maintenance done on the software would be updating information and increasing the PV device database. In other words, maintaining the device just means adding more support to other PV devices and updating the outputs if new research about solar panels come out. Since the maintenance required is all software based, it will be sustainable, with no physical materials needed to upgrade services.
Adding more PV devices to the emulator’s database makes it so that companies will be able to
sort through and compare different types/brands of solar panels so that the company will be able to decide which brand/types will be best for their needs. This increases the list of
potential customers that can use the emulator. Unfortunately, increasing the amount of available models to emulate equates to having to obtain the consent from the original manufacturers. This could prove to be an issue from a legal standpoint.
• 8. Ethical:
38
will have an unfair advantage. Information from other companies will not be accepted to prevent incorporating biased data into the emulator. Criticism will be taken though, and if a company believes that their product is being inaccurately simulated, the emulator’s database
will be updated with accurate outputs based on retests.
This project strives to meet all 10 listed points in the IEEE Code of Ethics. In particular:
“to be honest and realistic in stating claims or estimates based on available data;”,
“to seek, accept, and offer honest criticism of technical work, to acknowledge and correct errors, and to credit properly the contributions of others“,
“to assist colleagues and co-workers in their professional development and to support them in following this code of ethics.”,
“These specific three statements of ethics will be covered in depth over the course of this project as specified above.”
• 9. Health and Safety:
The nature of this project requires an output of high voltage and high current. Working with high power designs always requires proper safety procedures and careful actions around the test environment. Other than the safety concerns with testing the functionality of the product, any future users must also be cautious when operating the device at high voltage and current.
• 10. Social and Political:
This project is clearly politically and socially inclined to supporting more progressive views towards renewable energy. The aim of this project is to help better test devices that traditionally utilized PV energy inputs, which ultimately supports the notion of using solar power on a larger scale. This type of project is certainly more well received in the state of California, where renewable energy is well accepted. While not exactly affecting any direct stakeholders, this does impact those indirect stakeholders with a large investment in
39
trust in the product. Unfortunately, this project still does not help those with lower incomes, as solar energy is still a relatively expensive investment to begin with.
• 11. Development:
40
Appendix B: Alterations and Changes
Appendix B describes the alterations and changes of the project since Fall 2019 planning • No in-person access to lab
o Power Supply no longer used
o Wire-Wound Power Resistor and Cables no longer used
• Not able to implement the variable voltage/current supply based on load • No longer accessing solar panel data from external databases