DEVELOPMENT, TRANSITION, AND CRISIS IN THE INTERNATIONAL SYSTEM, 1870-2009
Heather-Leigh K. Ba
A dissertation submitted to the faculty at the University of North Carolina at Chapel Hill in partial fulfillment of the requirements for the degree of Doctor of Philosophy in
the Political Science in the School of Arts and Sciences
Chapel Hill 2017
©2017
ABSTRACT
Heather-Leigh K. Ba: Development, Transition, and Crisis in the International System, 1870-2009
(Under the direction of Thomas Oatley)
In Chapter 2, I elaborate and test an important implication of the theory I present in Chapter 1 using data from the 19th and early 20th centuries. In a globalized and hegemonically organized international economy, the economic fundamentals and policy choices of the hegemon often have spillover effects for peripheral economies. This is a well recognized dynamic of the contemporary political economy, but it was true during the first age of globalization as well. Motivated by literature examining the impact of the US macroeconomic conditions on other economies throughout the international system, applies the systemic theory of financial crisis from Chapter 1 to the long 19th century, when British hegemony reigned. I argue that a hierarchical distribution of economic activity in the international system during the 19th century meant that the financial cycle of Great Britain influenced the financial conditions in peripheral countries, ultimately helping to cause financial crisis. Evidence from financial crises which occurred in the long 19th century supports this theory.
ACKNOWLEDGEMENTS
My favorite part of an academic paper is the acknowledgements, for it is here that we are reminded of the truth that knowledge is never the result of individual effort; It is always, thankfully, a collective endeavor. So here, I take opportunity to thank the community of individuals who have contributed their time and energy to the development of my ideas. Fortunately for me, it is not a short a list.
My greatest debt of gratitude must go to my family, and in particular my parents, Monica and Raymond Sommerville. Without the love and support they gave me, I would not have the confidence or motivation to go forth in the world and attempt to offer to it whatever ability I possess. When I was a single parent, struggling to defend my prospectus, my father, who was battling terminal cancer, lived with me and helped me to care for my son. My mother worked a full time job and ran a business so I did not have to worry too much about whether my graduate stipend and part time job paid me enough to meet all of my and my son’s needs. As parents and role models, they exceeded every possible expectation anyone could have of them. I am incredibly fortunate in this regard.
able to repay you for the kindness, patience, and support you have given me these past 5 years – I can not thank you enough. Academia can be a nasty place, but you five are a refuge. Last, but certainly not least, on the “10 good men on the planet” list is Wilfred Herman Drath IV. So many times in my life I wondered if I would find an equal to share it with (especially after a divorce and a longer-than-desired bout as a single mother). I don’t know what I did to deserve you, but having you around has made my life and Bo’s better than I ever hoped (less the million dollar bank account of course, but no one’s perfect). I can’t thank you enough for being an incredible partner and friend.
To my son, Bo, who refused to sleep through the night for four years straight: you were not always the most helpful in this endeavor, but you did give me balance and perspective. You were a daily reminder that this project is just that – a project. It may end up on a shelf collecting dust, or it may become a book; Either way, its importance pales in comparison to the relationships that give life meaning. This dissertation gave me intellectual fulfillment, but you brought me joy and love in their purest form. For this, I forgive you for rarely allowing me to have a full night sleep while I struggled to complete it. Just one piece of advice though, kid: Karma’s a bitch, so be prepared if you ever decide to give me grand kids.
TABLE OF CONTENTS
1 Development, Transition, and Crisis in the International System 1
1.1 Introduction . . . 1
1.2 Orthodox and Heterodox Theories of Financial Crises . . . 5
1.3 System Structure, System Evolution, and Financial Crises . . . 16
1.3.1 Hypotheses . . . 26
1.4 Descriptive Networks of the International Economy 1870-2009 . . . 28
1.5 Statistical Models: Economic Integration and Crisis . . . 38
1.5.1 Dependent Variables . . . 39
1.5.2 Independent Variables . . . 39
1.5.3 Control Variables . . . 41
1.5.4 Results . . . 42
1.6 Statistical Models: System Structure and Contagion . . . 44
1.6.1 Dependent Variables . . . 45
1.6.2 Independent Variables . . . 46
1.6.3 Covariates . . . 47
1.6.4 Results . . . 49
1.7 Conclusion . . . 51
2.2 Financial Cycles Culminate in Financial Crises . . . 59
2.3 The Global Financial Cycle and Crises in the 19th Century . . . 65
2.4 Statistical Analysis . . . 73
2.4.1 Surge Model Description . . . 74
2.4.2 Surge Model Results . . . 76
2.4.3 Crisis Model Description . . . 77
2.4.4 Crisis Model Results . . . 78
2.5 Conclusion . . . 80
3 The Underbelly of American Hegemony 84 3.1 Introduction . . . 84
3.2 Financial Cycles and Crisis . . . 86
3.3 The International Structural Determinants of Crises . . . 89
3.3.1 Structure Determines Stability and Volatility . . . 94
3.4 Empirical Analysis: Surges and Stops . . . 99
3.4.1 Dependent Variables . . . 99
3.4.2 Independent Variables . . . 101
3.4.3 Control Variables . . . 101
3.4.4 Estimation . . . 104
3.4.5 Results . . . 104
3.5 Empirical Analysis: Predicting Crises . . . 107
3.5.1 Variables . . . 107
3.5.2 Estimation . . . 109
3.6 Implications and Conclusion . . . 111
Appendix 118
LIST OF TABLES
1.1 System Attributes and Effects . . . 27
1.2 Country-Level Systemic Attributes and Effects . . . 28
1.3 TNAM Model Results . . . 44
1.4 Logistic Regression Results - Hypotheses 4 & 5 . . . 51
1.5 Regression Results - Hypotheses 6 & 7 . . . 51
1.6 Marginal Effect of Opsahl Rank - Hypotheses 6 & 7 . . . 51
1.7 Marginal Effect of Hegemonic System - Hypotheses 6 & 7 . . . 52
2.1 Lagged DV Models with Capital Flows & BOE Securities . . . 77
2.2 Lagged DV Models with Capital Flows & Credit/GDP . . . 78
2.3 Logit Models with Capital Flow Surge and BOE Securities . . . 79
2.4 Logit Models with Capital Flow Surges & Credit/GDP . . . 80
2.5 Logit Models with Crises & BOE Securities . . . 81
2.6 Logit Models with Crises, Credit/GDP & Capital Surge . . . 82
3.1 Surge and Stop Model Results Using Quarterly Data . . . 106
3.2 Surge and Stop Model Results Using Annual Data . . . 107
LIST OF FIGURES
1.1 US Financial Cycle 1970 - 2011 . . . 14
1.2 Japanese Financial and Capital Flow Cycles Since 1975 . . . 22
1.3 2009 Imports Network . . . 29
1.4 System Density 1870 -2009 . . . 31
1.5 Unweighted and Weighted Degree Centralization 1870-2009 . . . 32
1.6 Unweighted Centralization and Density 1870-2009 . . . 32
1.7 Network Centralization and Density 1870-2009 . . . 35
1.8 Difference in Centrality of Top Two Countries 1870-2009 . . . 35
1.9 Contagion Severity Opsahl Centralization 1870-2009 . . . 37
1.10 Opsahl Network Centralization and Density 1870-2009 . . . 38
2.1 Cyclical Component of UK Interest Rate and Other BOE Securities . . . 67
2.2 UK Capital Flow Surges and US Crises 1865-1913 . . . 71
2.3 UK Credit/GDP and Capital Flow Surges to the US 1880-1913 . . . 72
2.4 UK Credit/GDP and US Crises 1880-1913 . . . 73
2.5 Cyclical Component of Credit/GDP and Other BOE Securities . . . 75
3.1 US Financial Cycle 1970 - 2011 . . . 88
3.3 Network Centralization 1870-2009 . . . 93
Chapter 1
Development, Transition, and Crisis in the International System
1.1 Introduction
Following the bursting of China’s housing bubble in 2015 and a subsequent deceleration in Chinese productivity, Brazil’s already slow growth collapsed completely, unemployment rose, and private sector wages fell. Lower Chinese demand for Brazilian exports such as oil, iron ore, and soy beans was a major cause of the economic slowdown. At the same time, Chinese foreign investment in Brazil declined as nervous investors turned instead to traditional investment safe havens such as the US real estate market (Searcy and Bradsher 2015). Today, political crisis looms large in Brazil and the country now seems to teeter on the brink of default. Brazil’s recent downturn illustrates the downside of economic globalization. Globalization expands markets and improves efficiency by increasing competition, which in turn fosters economic growth and development, but it also increases the risk of economic volatility and crisis.
integrated more likely to experience contagion in the wake of a crisis, but they may also be more likely to experience large fluctuations in external financing that affect domestic credit cycles and real sector productivity, fostering credit and asset bubbles that precede financial crises.
In this paper, I present a systemic theory of financial crisis that links the structure and pattern of financial and trade interdependencies to the prevalence and virulence of finan-cial crises. My main motivation for this theory is the Hegemonic Stability Theory (HST), the foundational research program in the field of international political economy, and one of the first system-level theories of financial crisis. Charles’ Kindleberger’s World in De-pression (1973), the basis for the broader IPE research program, argued that the depth and severity of the Great Depression was attributable to the structure of the international system, conceptualized as the distribution of power. More specifically, Kindleberger ar-gued that the stability of the international system requires a single dominant state (a hegemon) to dictate the rules of interaction among states in the international system and to fulfill five counter-cyclical functions in the wake of an international financial crisis: providing a market for distress goods, producing a steady if not counter cyclical flow of capital, maintaining a re-discount mechanism for providing liquidity when the monetary system is in crisis, managing the structure of foreign exchange rates, and providing a degree of coordination of domestic monetary policies. According to Kindleberger, when a hegemon declines, it will be less able and less willing to provide these public goods. Thus, a declining hegemon is able to stem the tide of a financial crisis. These dynam-ics, concluded Kindleberger, make hegemonic systems more stable than non-hegemonic systems.
The application of complex systems theory and network theory to the field of IPE is a recent development. Oatley et al (2013), in a pioneering paper, map the international financial system using network analysis and bilateral data on international bank claims and cross border portfolio investment flows. They demonstrate that the international financial system indeed exhibits characteristics of a complex adaptive system, in that multiple simple actors (banks, individual investors, governments) interact with one an-other without a central coordinating mechanism in response to both external stimuli and each other. When aggregated, these interactions have a persistent, hierarchical structure. Furthermore, they explain that the hierarchical structure of the financial system holds implications for how and why the 2008 financial crisis was so virulent. They emphasize that the “robust yet fragile” nature of the hierarchical structure of the international fi-nancial system means that crises that originate in countries at the core of the system are more likely to spread through the entire system, but that crises originating in less integrated countries produce little contagion. In other words, hierarchical, hegemonic, systems are highly stable.
When interpreted through the lens of complex systems theory, the causal relationship identified by Kindleberger between the structure of the international economy and its instability at the time of the Great Depression is perfectly logical. The decline of Britain and the ascendance of the Unite States within the international economy during the first quarter of the 20th century meant that the structure of the international economy became, for a period, flatter, or less hierarchical. Not incidentally, the international system proved quite susceptible to an economic shock that occurred in one of the two most central countries. While Kindleberger may have placed undue emphasis on the provision and role of stimulative policies as a mediating variable for achieving stability, the core proposition of his theory is valid for many of the same reasons he highlighted throughout his historical exegesis: the dynamics of the complex economic interdependencies that constitute the global economy. 1
The remainder of this paper is structured as follows. In subsection two, I review existing theories of financial crisis and position my own theory within the post-Keynesian economic paradigm. Re-articulating the hegemonic stability theory requires micro and macro economic theories of crisis, consistent with Charles Kindleberger’s thinking on the subject. Advances in post-Keynesian economics have accomplished this. In subsection three, I present the basic tenets of my theory, projecting post-Keynesian economic theories of crisis on to the international level and applying the insights of complex systems theory and network science to understand how the structure of the international economy can facilitate or attenuate financial crises. I then propose several testable hypotheses. In subsection four, I use network statistics to describe the evolution of the international system since 1870, and develop network measures that operationalize the variables I hypothesize to be at work. In subsection four, I employ a new network model developed by Leifeld and Cranmer (2016) to formally test my hypotheses regarding the causal role of the structure of the international economy in causing financial crises. In subsection five, I rely on logistic and linear regression to demonstrate a correlation between the structure of the international economy, countries’ positions in it, and the dynamics of financial
contagion. My empirical analysis shows that the prevalence of financial crisis throughout the network increases as globalization results in a higher degree of connectivity and a less centralized distribution of economic activities between countries. Moreover, the scale of contagion resulting from crises has declined over time, and this is attributable to a consolidation of American economic hegemony over the course of the 20th and early 21st centuries. My results show that countries who trade more with the hegemon are more likely to catch contagion from it, and less likely to catch contagion from crises originating elsewhere.
1.2 Orthodox and Heterodox Theories of Financial Crises
The 2008 financial crisis motivated a great deal of research in the fields of economics and international political economy on the causes of financial crises . In the years since the Great Recession, scholars have advanced our understanding of the international de-terminants of financial crises and have developed heterodox micro and macro economic theories of financial crises. This new reserach provides a stronger theoretical foundation to earlier literature on financial crises by Hyman Minsky and Charles Kindleberger. Gen-erally, theories of financial crisis focus on either the domestic or international level, and are premised on either orthodox neoclassical/neo-Keynesian economics (also known as the new neoclassical synthesis or NNS) or more recent post-Keynesian economic theories. The theory presented in this paper builds on recent developments in post-Keynesian eco-nomics, projecting the micro and macroeconomic theories on to the international level of analysis with the goal of understanding how the economic cycles of national economies interact in the global economy to produce financial crises. I will review this literature more in-depth while giving a broader overview of NNS and domestic-level explanations of financial crisis.
and utility maximizing. Dynamic stochastic general equilibrium (DSGE) models of the macro-economy, the efficient market hypothesis theory of financial markets (EHM), and the capital asset pricing model (CAPM) are the archetypal models of the NNS paradigm that dominates mainstream economics and finance.
The chief limitation of NNS economic theories of financial crisis lies in the fact that the economic theories on which they are premised predict that large outlier events, such as financial crises, should not occur. In fact, the cyclical behaviour of financial markets in general is not well explained by equilibrium economics. Cycles are, in essence, excess volatility, and this excess volatility suggests that prices can move above and below their real value for no fundamental reason. Instead, this volatile behaviour is dismissed as ”animal spirits” or ”mass psychology” (Shiller 2003, 84). According to the paradigm, massive events such as the sub-prime crisis, Black Monday (October 19, 1987), and the 1929 stock market crash are essentially statistical impossibilities. A large drop in the stock market such as the 22 percent drop of Black Monday is a twenty standard deviation event, which would be expected to occur only once every 260 million trillion years (Sornette 2003, 50). Thus, for adherents of the NNS, extreme market events must be a result of ”exogenous shocks” because the probability that they develop endogenously is vanishingly small.
regime type in determining many of these variables, such as the quality of central banking and financial industry regulation (Franzese 1999 and 2000; Keefer and Stasavage 2003). Alternatively, critics of regulation argue that such programs simply induce moral hazard and make banking crises more likely (Demirg¨u¸c-Kunt and Detragiache 2002).
Beyond institutional explanations, scholars have also focused on real macroeconomic, fiscal, and monetary conditions that produce banking crises (reversing the direction of causality from crisis causing a productivity shock to productivity shock causing crisis). Krugman (1979), for example, is an early example of research identifying either un-sustainable levels of government debt or balance of payment problems as the cause of currency crises that eventually push the financial sector in to crisis. Similarly, research by Krugman (1999) focuses on the role of capital flows in determining exchange rates, which can affect the quality of financial portfolios. Kaminsky and Reinhart (1999) along with Reinhart and Rogoff (2010), study the incidence of combination (sovereign debt-monetary-financial) crises. There is also a broad literature in political economy that studies the effect of regime type and regime structure on fiscal policy, monetary regime choice, and trade and investment liberalization, which is relevant here as well. This liter-ature considers how variables such as veto-players, ruling coalition strength, election rules and timing, transparency, democratic accountability, and political parties contribute to the policies and institutions that are often correlated with economic and financial instabil-ity(Broz 2002; Bernhard, Broz, and Clark 2002; Bernhard and Leblang 2002; Hallerberg 2002; Stasavage 2003). With regard to externally generated financial crisis, political in-stitutions and regimes are clearly a piece of the puzzle. The broader question, and the one I am concerned with in this paper, is whether there is an inherent quality of markets, as human systems, that makes them prone to crisis, such that industry regulation, and monetary and fiscal policy choices may matter at the margin, affecting scale, or timing of the crisis but not acting as the primary impetus.
the international economic drivers of financial crisis. Ben Bernanke, Chairman of the US Federal Reserve at the time of the 2008 financial crisis, proposed that the crisis was caused by a global savings glut, generated by the export led growth models and artificially low currency values of Asian countries like China (2005, 2007, 2010). This global savings glut fueled the US current account deficit, and, he argued, the corresponding surge of capital inflows funded the housing bubble that preceded the crisis. His theory was com-plemented by new research on the role of net capital inflow surges. This research proposes that large surges of international investment followed by a “sudden stop” of investment precipitate financial crises by yielding higher interest rates, currency depreciation, and slower growth(Reinhart and Reinhart 2008; Caballero 2010; Kose et al 2009; Fratzscher 2012).
Largely due to the macroeconomic framework that undergirds them, these recent the-ories of economic crisis have some major shortcomings. First, while Bernanke speculated that savings rates in Asia funded the US housing bubble, over half of the gross capital inflows to the US in the lead up to the crisis came from Euro area countries and the UK (25 percent from here alone), not China or emerging Asia. Following the crisis, it was capital flows from Europe and Canada that collapsed, not flows from Asia (Borio and Disyatat 2011, p.15-16). Second, while evidence of a correlation between net capital flow surges, stops, and crises is strong, there is still limited theoretical basis within main-stream economics to explain why net surges of investment (synonymous with current account imbalances) should cause financial crisis. While a current account imbalance may be an indication of fiscal deficiencies (high national debt) which can lead to pro-ductivity problems, current account imbalances can also be completely benign (as most economists thought they were in advance of the 2008 financial crisis). There is a laundry list of countries with current account surpluses (net flow deficits) that have experienced financial crisis.2
If, as orthodox economics indicates, only the dynamics of the real economy (savings and investment) matter for explaining financial crisis, then it may make sense to focus on net capital flows and current account imbalances. If, however, the financial sector is itself an influential institution within the real economy that plays a critical role in determining growth and productivity by providing financing (which is different, though related to savings and investment, because it is not, in fact, constrained by savings), such measures will not be sufficient. As critics such as Forbes and Warnock (2012), Broner et al (2013) and Milesi-Ferretti and Tille (2011) have noted, net flows and current account balances provide limited information about the state of a country’s financial system. First, net flows cannot distinguish between changes in domestic and international investors. Second, current account deficits and net flow measures capture only claims on a country arising from real trade in goods in services. Financial crises are primarily liquidity shortages, the result of over-leveraging within the financial system, but net flows and current accounts tell us very little about how a country is involved in international financial intermediation (borrowing and lending) since purely financial transactions are netted out of these measures. The fact that the financial system is often the source of instability itself, as was clearly the case in many of the greatest financial crises in history, suggests the need to assess the state of the financial sector directly, as well as its purely financial transactions with financial sectors in other countries. Doing this may require thinking outside of the NNS box. 3
There have long been critics of equilibrium economics, and the frequency of financial crises over the past century and a half has long been acknowledged as the Achilles heel of the NNS paradigm.4 Furthermore, even its proponents have acknowledged that the
that preceded the banking crisis and Great Depression in the United States (Eichengreen and Mitchener 2003).” Borio and Disyatat 2011, p.6
3See Sornette, D. (2003), Why Stock Markets Crash (Critical Events in Complex Financial Systems), Princeton University Press, Princeton, NJ. for discussion of exogenous versus endogenous causes of financial crises
microfoundational assumptions of this economic orthodoxy are less than accurate.5
Alter-native paradigms, though, have been few and far between. Since the 2008 financial crisis, this is beginning to change. A heterodox school of economics called post-Keynesianism has begun to apply advances in complexity and network sciences, accompanied by a more diverse mathematical and statistical toolkit, to the challenge of modeling and analyzing business and financial markets. Arguably, this is the closest any heterodox theory of economics has come to providing a real alternative to equilibrium economics.
Post-Keynesian economic theories embrace an altogether different set of assumptions about market actors. In post-Keynesian economics, market actors exhibit a heteroge-neous set of interests, have access to only incomplete information, and sometimes uti-lize imperfect information processing strategies, especially those based on heuristics. Post-Keynesian economic theories assume that markets are created, as other complex systems are, via a non-linear aggregation process. This non-linear aggregation process de-emphasizes the importance of microfoundations and modeling individual level inter-actions. However, there are several scholars who have worked to model this non-linear aggregation process using the tools of agent based modeling. Most notably, the work of Didier Sornette has provided insight as to how individual attributes affect asset ex-changes such that financial bubbles can occur (Harras and Sornette 2011; Sornette 2014). Instead, post-Keynesian theorists opt to model markets at the system level, as a dynamic flow of money between groups of market actors who may behave similarly. To date, post-Keynesian economics is still a hodgepodge of heterodox economic theories, coalescing mainly around their rejection of equilibrium economics, as well as their acceptance of the theory of endogenous money creation. A brief explanation of the theory of endogenous money is warranted because it is essential to understanding the Post-Keynesian theory
(Critical Events in Complex Financial Systems), Princeton University Press, Princeton, NJ. Minsky, Hyman, 1982a. Can it happen again? A reprise. Challenge 25 (3), 5–13. ; Minsky, Hyman, 1982. Can “It” Happen Again?: Essays on Instability and Finance. M.E. Sharpe, Armonk, N.Y
of financial crisis.
The Canadian economist Basil Moore is the primary theorist of endogenous money (Moore, 1979, 1983, 1988). In contrast to the orthodox ‘money multiplier’ model of credit money creation, where base money is created by the central bank and then multiplied by banks as they extend credit, Moore argued (citing Holmes 1969), that: “In the real world banks extend credit, creating deposits in the process, and look for the reserves later.” (Alan Holmes 1969, p. 73) This observation was empirically confirmed by Kidland and Prescott, who conclude:
There is no evidence that either the monetary base or M1 leads the cycle, although some economists still believe this monetary myth... if anything, the monetary base lags the cycle slightly... The difference of M2–M1 leads the cycle by even more than M2, with the lead being about three quarters. (Kydland and Prescott, 1990, p. 12)
Furthermore,
The fact that the transaction component of real cash balances (M1) moves contemporaneously with the cycle while the much larger nontransaction com-ponent (M2) leads the cycle suggests that credit arrangements could play a significant role in future business cycle theory. Introducing money and credit into growth theory in a way that accounts for the cyclical behavior of mone-tary as well as real aggregates is an important open problem in economics.
macro-economy used standard calculus-based mathematics and suffered from an inability to explain the growth or expansion of the money supply, and thus how borrowers can repay debt and make profits (Keen 2006). However, Graziani’s model marked a transfor-mation in the economic role of the financial sector, from one of neutral mediator, merely translating savings to investment, to that of money creator.
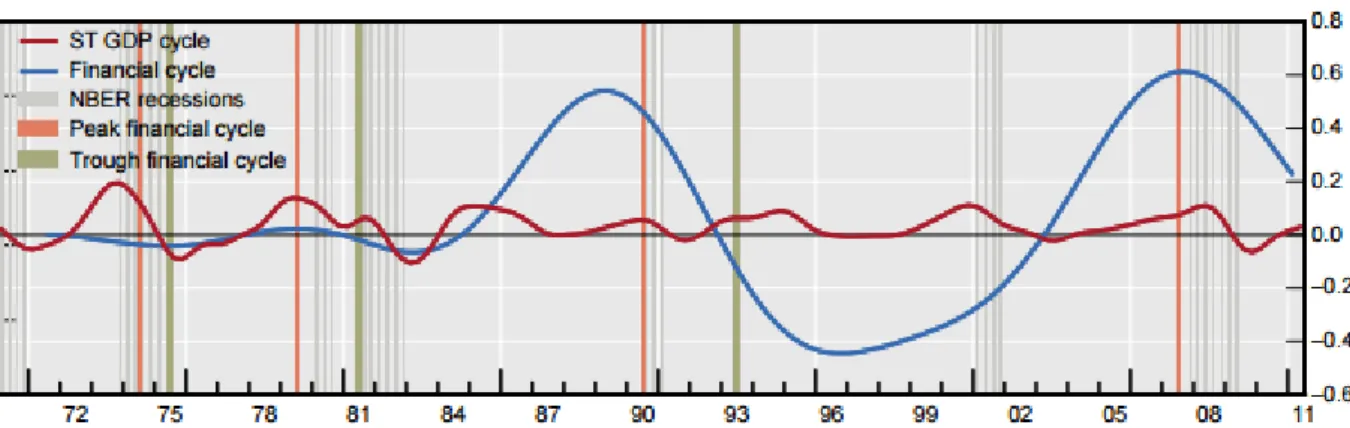
The central insight of post-Keynesian economics is that economies experience financial cycles and that these financial cycles ultimately cause financial crises. Contemporary scholars who study financial cycles define them similarly to business cycles – the pattern of expansion, peaks, contractions, and troughs that occur in an economy’s asset prices (with an emphasis on property prices) and credit prices(Drehmann et al., 2012). These cycles are the result of “self-reinforcing interactions between perceptions of value and risk (property prices), [and] attitudes towards risk and financing constraints (credit), which translate into booms followed by busts.” (Borio 2014) The financial cycle is distinct from the business cycle, in that it is much longer (16 to 20 years versus 8 years for the average business cycle) but it sometimes coincides or aligns with the business cycle, because financial and real sectors are inextricably linked.6 The period from 2000 to 2007
in the United States is an example of an alignment of the two cycles. As was also the case in 2008, the peak of financial cycles are usually associated with a period of financial distress. Figure 1.1 is an attempt by Drehmann, Borio and Tsatsaronis (2012) to plot the US financial cycle from 1970 - 2012. They utilize turning-point analysis and frequency-based filters applied to data on credit, the credit-to-GDP ratio, property prices, equity prices and an aggregate asset price index that combines property and equity prices to construct the time-series.
Drawing on the insights and terminology of complex systems science more generally, we can further understand the existence of financial cycles as the natural bi-product of complex systems with two distinct features: balancing feedback loops and goal seeking agents (Meyers 2010). Within financial markets, agents buy and sell with the goal of making a profit. Balancing feedback loops imply the presence of both positive and neg-ative feedback loops. In the context of financial markets, positive feedback loops occur when the purchase of one type of asset motivates other agents to purchase the same type of asset, a behaviour known as herding. Negative feedback loops constrain the positive feedback loops. Two possibilities for negative feedback loops in financial markets
Figure 1.1: US Financial Cycle 1970 - 2011
Source: Drehmann, Borio, and Tsatsaronis(2012)
clude real sector productivity, and investor risk tolerance. Essentially, investors tolerate speculation regarding the value of particular class of assets for only so long before they must face the reality of actual performance, or, alternatively, some investors begin to bet against the value of the asset.
In additional to empirical evidence on the role of financial cycles in producing cri-sis, Didier Sornette has pioneered the use of non-linear modeling to produce theoretical models of financial cycles that culminate in crises. Corsi and Sornette (2014), for exam-ple, produce a non-linear stochastic model that captures the feedback between real and financial sectors. In their model, credit creation is determined by the market value of the financial asset employed as collateral in bank loans, resulting in a feedback loop between financial prices an” that results in a crash and/or economic recession.
While most research on financial cycles has focused on cycles at the national level, some recent research has also identified them at the international level as well. Helene Rey has received international attention of her theory of aglobal financial cycle. As Rey explains:
with countries’ specific macroeconomic conditions. Symptoms can go from benign to large asset price bubbles and excess credit creation, which are among the best predictors of financial crises.[...] One of the determinants of the global financial cycle is monetary policy in the centre country, which affects leverage of global banks, capital flows and credit growth in the international financial system. Whenever capital is freely mobile, the global financial cycle constrains national monetary policies regardless of the exchange rate regime. (Rey 2015:1)
Research on global and international financial cycles is in the early stages, but other international economic research examining a similar phenomenon among countries’ busi-ness cycles (and, to a lesser extent, consumption and investment) is also worth noting. Economists have shown that both trade and financial integration increase synchronization between countries’ GDP (Frankel and Rose 1998; Imbs 2004). To date, this literature has reached varying conclusions about the extent to which trade and financial integra-tion affect GDP correlaintegra-tions (Stock and Watson 2005), among which countries this effect is robust and consistently observed (Kose, Prasad, and Terrones 2003; Kose Otrok, and Prasad 2008), and the reasons why this may occur (Baxter and Kouparitsas 2005). None-the-less, economists generally accept the phenomenon, though still treat it as a puzzle due to the fact that these empirical observations contradict heterodox dynamic general equilibrium theory predictions (Backus,Kehoe, and Kydland 1993).7
Within the post-Keynesian economic framework, the existence of a global financial cycle, or a synchronization of national financial cycles, makes complete sense, as does synchronization of business cycles. As countries integrate economically to form a single, global economy, production, consumption, and investment all occur across borders, as firms, households, and governments interact or even exist trans-nationally. This means that the system of individual market actors whose interactions and transactions in aggre-gate constitute production, consumption, and investment are not geographically isolated, and instead form a single global system in which developments or changes among actors in one part of the system can quickly spillover to actors in other parts of the system
through both real and financial linkages. In this context, synchronization between the behavior of nationally aggregated sets of actors who interact frequently with each other seems logical and obvious; it is the result of many, individual, formerly rather isolated human systems, becoming one. But how do we make sense of the disproportionate influ-ence the U.S. economy seems to exert on the global financial cycle, as described by Rey (2015)? Certainly the size and influence of the US economy is a contributing factor, but how can we understand, observe, and study this synchronization process?
I argue that applying complexity and network sciences to study the structure of the international economy can illuminate the pattern of economic globalization, and the syn-chronization of national economies. Furthermore, understanding how the financial cycles that give rise to financial crises at the national level interact, such that economic and financial developments in some economies can affect these same conditions in other coun-tries, will also elucidate how economic and financial globalization affects financial stability. Specifically, I argue that when conceptualized as a complex system of trade, capital, and foreign currency exchanges, there is a direct connection between a hierarchical and less densely connected structure of the international economy and its susceptibility to sys-temic financial crisis. I propose that as the international economy flattens (becomes less hierarchical) and becomes denser (more potential economic exchanges between countries are actualized), the number of financial crises is likely to increase due to the propensity for financial conditions to spillover from one country to another, creating the conditions for bubbles. Furthermore, the location of a crisis’ epicenter and the system’s degree of hi-erarchy and connectivity determine the level of contagion experienced by other countries in the system in the wake of the crisis. Together, these two assertions form a broader system-level theory of financial crisis, which I outline fully in the next subsection.
1.3 System Structure, System Evolution, and Financial Crises
role from the early 1950s onward. These hegemonic periods have facilitated economic development in other countries in the system that have implemented export-led growth models and (to varying extents) opened their borders to foreign capital. The hegemon has imported goods from peripheral countries, and exported capital to them. As development occurs, the position of countries within the system changes. Sometimes, as occurred during the first quarter of the 20th century between Britain and the United States, a transition happens at the core of the system as one or more countries rise to parity with the hegemon. More typically, countries move from the periphery toward the core, as European countries and some Asian countries did in the second half of the 20th century. I argue that these changes in the structure and hierarchy of the global economy precipitate global financial crises and affect the scale of the resultant contagion.
To investigate how these changes result in crisis, I conceptualize the international sys-tem as a multiplex, or multi-dimensional network. Whereas a one dimensional network connects nodes (countries) via edges (quantity of imports and exports, for example), a multiplex connects nodes across multiple edges. Cranmer, Marucha and Menninga (forthcoming), for instance, model the international system as a multiplex network con-sisting of three types of international relationships: trade, democracy, and international governmental organization membership.
For the past 150 years, the international economy has been a relatively hierarchical structure centered upon a single preponderant economic power – the hegemon 8. The
hegemon has exhibited characteristics consistent with Kindleberger’s theory; it has been a large, growing, capitalist economy with first-rate innovation and technological superiority. Other countries form the periphery or periphery regions. Countries in the semi-periphery maintain strong ties to the hegemon but slightly weaker ties (on average) to each other and to the periphery. Countries in the periphery may maintain relatively weaker connections to the hegemon, some ties to countries in the semi-periphery, but weak or nonexistent ties to each other.
There are two reasons why a hierarchical structure has predominated for so long: how the system formed, and how it evolved (Oatley et al 2013). One approach to explaining the formation of complex systems, applicable to the international economic system, is fitness preferential attachment (FPA). FPA proposes that ties between nodes form based on nodes’ fitness. Nodes (countries) that exhibit advantageous and appealing character-istics (liquidity, good governance and regulatory frameworks) are more likely to attract ties (trade, investment). Overtime, this process is subject to considerable feedback; nodes that have strong ties are more likely to attract additional ties. The system is therefore inherently biased toward a hegemonic structure. Secondly, hegemonic systems exhibit robust yet fragile characteristics. In hierarchically ordered systems, a shock emanating from the hegemon is less probable than a shock generated by a non-hegemon, and a hege-mon is uniquely able to absorbs shocks that emanate from peripheral countries, thereby preventing system-wide contagion and collapse. This makes the system robust. On the flip side, the system is remarkably fragile to turbulent events that occur in the hegemon. But while hierarchy is remarkably persistent, the system does not remain entirely static. Changes to the structure of the network occur when a peripheral country attracts stronger and more numerous trade and investment relations from the hegemon, and from other countries that may constitute the core, jump starting the process of growth and
development. Thus, changes in system structure are the result of foreign governments, independent and international financial institutions, and firms ’ responses to monetary, exchange rate, fiscal, trade, and investment policies set by governments. Economic de-velopment is usually marked by significant growth in the size of the domestic economy, and by the role that foreign investment and trade play in the economy. Foreign direct and portfolio investment will pour in to take advantage of the higher returns on capi-tal. Investment fosters the productive capacity of industry and as it expands, imports will increase to respond to domestic demand for commodities and intermediate goods, followed by an increase in exports (Vernon 1966). In the contemporary era of globaliza-tion, development has also been marked by the increased role of national industry in the global value chain hierarchy of international production (Nematy 2005). The increased trade and investment flows necessarily mean a larger role for the country in the foreign exchange market. As countries develop, their positions within the system change. They move from the periphery of the system toward the core. Economic development is there-fore an inherently systemic process; it is financed by capital flows from the hegemon (and other core countries) and achieved by exporting to the hegemon.
As the volume of trade, investment, and foreign currency exchanges increase between countries, the probability increases that financial cycles spill over from one country to another. When the financial cycle is expanding, credit and debt is expanding, and market liquidity is high. This facilitates investment abroad, particularly if growth is moderate or strong. The increased investment applies downward pressure to the market interest rates of recipient countries, and can push them below the natural rate implied by the productivity of the real of economy, thereby facilitating bubbles that lead to crisis. 9 While a country’s monetary policy can influence market rates, and is arguably capable of correcting overly high liquidity and leverage, monetary policy independence is affected by a country’s exchange rate regime. Thus, countries with fixed exchanged rates may be hesitant to raise rates because it may make the country more attractive to international investors and make it more difficult to manage its currency value. Furthermore, inflation targeting tends to be the primary focus of monetary policy, and so rates set by a central bank are not always right. Lastly, if upswings in the financial cycle provide a boost to real-sector productivity, policy makers may remain willfully ignorant of financial market conditions, since strong levels of growth are desirable.
To further explain how this process works, consider a hypothetical situation. Suppose a country is experiencing an upswing in the financial sector. Credit is expanding, the money supply and asset prices are expanding accordingly, and interest rates are moderate or low. This grants investors the means to invest abroad, and also an eagerness to seek higher rates of return abroad. If the business cycle happens to be also in a period of expansion, investors will likely have even greater means, and will be more optimistic
about their financial prospects and more willing to bear the higher risk of investing abroad. Now, consider how an increase in gross flows between this country and another country (with varying exchange rate regimes) might affect the market interest rate in the recipient country. Between a country with a fixed rate and a country with a floating rate, an increase in gross flows of financial assets or goods and services from the latter to the former will require exchange market intervention on the part of the recipient(it will sell its currency), pushing rates lower, regardless of central bank policy on short term rates. While capital controls could mitigate this effect, such policies are always ineffective to some extent and do not completely insulate the country from the effects of other countries’ financial conditions. If both countries have floating rates, market interest rates in the country receiving higher gross inflows will still experience downward pressure as the expansion of the supply of money and credit in one country increases the amount of investment available abroad, expanding the supply of capital and pushing down market interest rates.
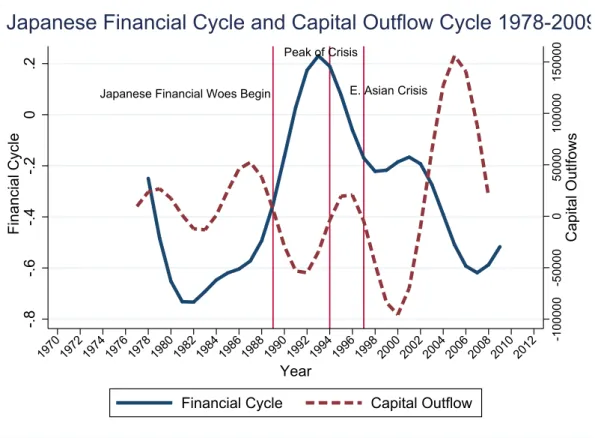
Two contemporary examples illustrate spillover effects at work. The first is the role of the Japanese financial cycle in producing financial crises that affected many southeast Asian countries beginning in 1997. The second is the United States’ financial cycle in the lead up to the 2008 financial crisis that resulted in not only a domestic asset bubble, but asset bubbles throughout the developed and developing world.
Figure 1.2: Japanese Financial and Capital Flow Cycles Since 1975
Japanese Financial Woes Begin
Peak of Crisis
E. Asian Crisis
-100000
-50000
0
50000
100000
150000
Capital Outlfows
-.8
-.6
-.4
-.2
0
.2
Financial Cycle
1970 1972 1974 1976 1978 1980 1982 1984 1986 1988 1990 1992 1994 1996 1998 2000 2002 2004 2006 2008 2010 2012
Year
Financial Cycle Capital Outflow
Japanese Financial Cycle and Capital Outflow Cycle 1978-2009
prospects were better, in hopes of earning higher returns. Japanese (and American) capital poured into the economies of South Korea, Thailand, Malaysia, and Indonesia, quickly exacerbating the bubble which had started to form around the turn of the decade. While Japanese foreign investment in Southeast Asian countries increased in the wake of its crisis, imports from these countries declined, contributing to the current account deficits some of these countries developed over the course of the decade. (Corsetti et al 1999)
of foreign assets), private debt increased dramatically, and asset prices (both property and stocks) rose sharply. While deregulation, cronyism, and corruption can be identified as contributing to moral hazard, the evidence suggests that a foreign-investment driven asset bubble was ultimately responsible for the crisis. This foreign investment driven bubble began at the tail end of the financial cycle expansions in the United States, and especially Japan, and then was exacerbated when the Japanese crisis erupted. (Corsetti et al 1999)
In the eight years leading up to the financial crisis of 2008, very low interest rates in the US were accompanied by relatively strong economic growth. This implied that the United States’ financial cycle and business cycle had aligned – a certain recipe for credit and asset bubbles (Claessens et al 2010; Claessens et al 2012; Kiyotaki and Moore 1997; Adrian and Shin 2010). Moreover, because the upswing in the financial cycle occurred in the most central country in the system, it had spillover effects for many countries throughout the world. From 1992 to 2007, credit, asset prices, housing prices, and the money supply expanded in the United States (Keen 2013b, Keen 2009) as well as in many other developed and middle income countries. For example, the United Kingdom, Spain, Ireland, New Zealand, Sweden, and several East European countries experienced housing bubbles along with the United States. The United Kingdom, Spain, Iceland, and several central and eastern European countries, particularly Baltic states such as Estonia, Latvia, Lithuania, and Bulgaria also experienced substantial growth in private credit (IMF GFS Report 2008; Claessens et al 2010). These simultaneous financial expansions coincided with, and arguably led to, unprecedented levels of both gross inflows and outflows between countries. It was this alignment of financial cycles among many countries during the 2000s that was very likely the cause of the world-wide depression of interest rates that occurred during this period, to which economists have attributed the subsequent international financial crisis (Borio and Disyatat 2011).
is simply a spillover effect in the wake of a crisis. More densely connected systems have more ties and more transmission channels through which contagion can spread. Systems that are less centralized, meaning they feature a more equal distribution of the number of ties between countries are more vulnerable because there is no single, disproportionately large economy to absorb the shock. However, contagion is also affected by the relative size or strength of ties between countries in the system. To say that new ties are forged when a country develops says nothing about the relative strength, or size, of the ties that exist between countries. A hegemon not only maintains the largest number of ties with other countries in the international system, it also maintains the strongest ties. Because ties in the multiplex of the international economy are essentially aggregate economic transactions we can think about tie strength as the dollar value of economic transactions. When a single country maintains disproportionately stronger or larger ties to every other country in the system, this helps to limit the extent of contagion resulting from a crisis in a semi-periphery or periphery country, as the hegemon’s economy is large enough to absorb the productivity shock. On the other hand, a crisis that originates in the hegemon will have a strong tendency to spread to many other countries throughout the system.
currency crisis. In short, contagion from the events of Thailand, Malaysia, and South Korea did occur within Southeast Asia, but effects for the broader international economy were quite limited (Oatley et al 2013).
On the other hand, the contagion that resulted from the bursting of the credit and asset bubbles in the US reverberated throughout the developed and developing world. Growth slowed across OECD countries and much of the developing world, especially for close trading partners of the United States such as Mexico, Chile, and Colombia. The Asian tigers experienced a short-lived slowdown at the end of 2008 and first half of 2009, but a slowdown none the less. It may in fact be easier to list the countries that did not take a hit to GDP as a result of the crisis 10. Housing bubbles in Spain and Ireland
popped. The United Kingdom, Iceland, Ireland, France, Germany, and Denmark all implemented bailouts of major financial institutions. Even China’s recent troubles can be explained as a second order contagion effect of the US bubble and subsequent financial crisis. 11
To summarize, in this subsection and the last, I have argued that spillover effects from a country’s financial cycle can occur between countries in the system, and that the probability that this occurs is affected by tie strength between countries as well as overall network structure. Furthermore, the overall structure of the international system affects the dynamics of financial crises and contagion. It is no coincidence that financial cycle developments in the second largest economy in the 1990s, Japan, helped fuel the crisis in East Asia in the 1990s, and that the US financial cycle created the conditions for the 2008 financial crisis that rocked the developed world. In both the Asian financial crisis and the 2008 Great Recession, expansions in the financial cycle of a major economy contributed to larger international investment, depression of interest rates, and asset and
10Argentina, India, Indonesia, the Philippines, Tunisia, Israel, Jordan, and Poland
credit bubbles abroad, which ultimately resulted in crisis. Economic integration is clearly the antecedent of spillover effects and contagion. Ultimately, economic integration is the reason why financial cycles in major developing countries tend to align (Claessens et al 2010, Helene Rey 2015) and have been increasingly coordinated over time. I argue that this phenomenon will occur with greater frequency as the system becomes denser and as the system becomes less centralized around the United State, particularly due to the rise of China. To test the theory I have presented, I offer the following hypotheses linking the structure of the international economy to countries’ propensities to experience financial crisis and contagion and estimate several statistical models in the following subsections to test them.
1.3.1
Hypotheses
Hypothesis 1: Countries should be more likely to experience a crisis when the international economy is less centralized around a single, core economy.
Hypothesis 2: Network density should increase the likelihood that any coun-try experiences a crisis.
Hypothesis 3: Countries that are more integrated within the international economy, are more likely to experience a systemic financial crisis. This is due both to spillover effects, and also contagion.
Hypothesis 4: In hegemonic systems, countries that trade more with the hegemon should be more likely to experience contagion from crises that orig-inates in the hegemon.
Hypothesis 5: In hegemonic systems, when crises originate in a country that is not the hegemon, contagion is more likely to affect countries that trade with the country of crisis origin more than with the hegemon, relative to other countries. 12
Hypothesis 6: Contagion that originates in the most central economy should be greater in hegemonic systems than in non-hegemonic systems.
Hypothesis 7: Contagion from a crisis that originates in a country that is not the most central country, should be lower in hegemonic systems than in non-hegemonic systems.
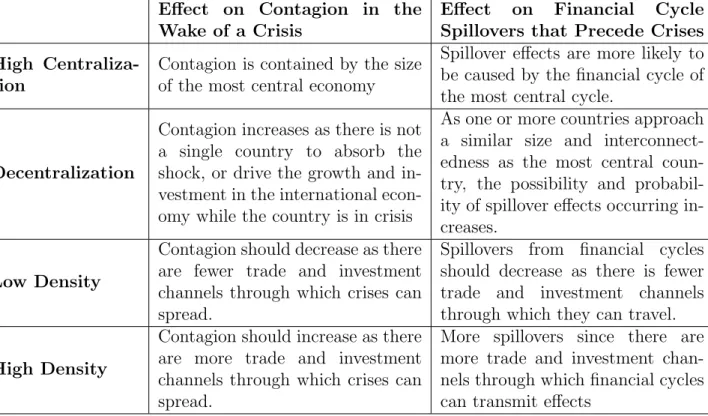
For clarity and succinctness, I have also summarized these hypotheses in Tables 1.1 and 1.2. I proceed with empirical analysis as follows. In the next subsection, I introduce the network data I use to model the international economy and I provide an overview of the structure of the international economy from 1870 to 2009 using several network measures that operationalize the relevant concepts. In subsection 5, I test hypotheses 1-3 using a new network model developed by Leifeld and Cranmer (2016) that is an extension of spatial regression models used to estimate models where node characteristics are a function of network structure. In subsection 5, I test hypotheses 4-7 using logistic and linear regression to evaluate the effect of country position and system structure on the dynamics of contagion.
Table 1.1: System Attributes and Effects
Effect on Contagion in the Wake of a Crisis
Effect on Financial Cycle
Spillovers that Precede Crises
High Centraliza-tion
Contagion is contained by the size of the most central economy
Spillover effects are more likely to be caused by the financial cycle of the most central cycle.
Decentralization
Contagion increases as there is not a single country to absorb the shock, or drive the growth and in-vestment in the international econ-omy while the country is in crisis
As one or more countries approach a similar size and interconnect-edness as the most central coun-try, the possibility and probabil-ity of spillover effects occurring in-creases.
Low Density
Contagion should decrease as there are fewer trade and investment channels through which crises can spread.
Spillovers from financial cycles should decrease as there is fewer trade and investment channels through which they can travel.
High Density
Contagion should increase as there are more trade and investment channels through which crises can spread.
Table 1.2: Country-Level Systemic Attributes and Effects
Effect on Suscepti-bility to Financial
Cycle Spillovers
that Precede
Crises
Effect on Suscepti-bility to Contagion in the Wake of a Crisis in the most central country
Effect on Suscepti-bility to Contagion in the Wake of a Crisis in the a pe-ripheral country
High Centrality More likely to
experi-ence spillover effects
More likely to catch contagion
Less likely to catch contagion
Low Centrality Less likely to
experi-ence spillover effects
Less likely to catch contagion
More likely to catch contagion
High trade
proximity to
hegemon
Assuming the source is the most cen-tral country, close economic partners are more likely to experience spillover effects
More likely to catch contagion
Less likely to catch contagion
Low trade
prox-imity to
hege-mon
Assuming the source is the most central country, countries that trade little or not at all with the most central country are less likely to experience spillover effects
Less likely to catch contagion
More likely to catch contagion, if they trade with the coun-try of origin
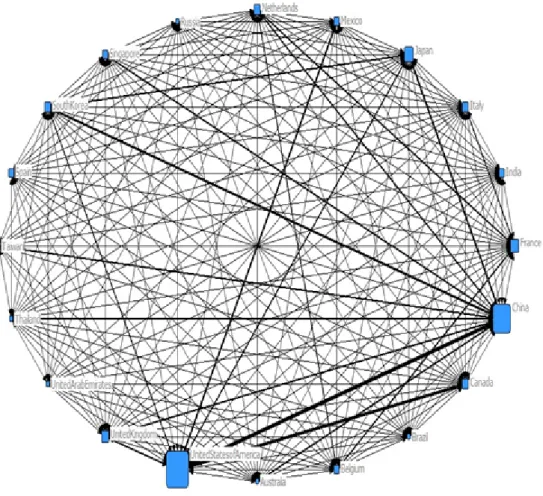
1.4 Descriptive Networks of the International Economy 1870-2009
Figure 1.3: 2009 Imports Network
with other nodes. When valued or continuous data is used, weighted degree centrality is the sum of the values of the ties it shares with other nodes. Figure 1.3 features weighted degree centrality. As Oatley et al (2013) propose, we can use the topology of such graphs as an indication of the structure of the international economy that emerges from the multitude of exchanges between economic agents in different countries over the course of a year. We can thus conceptualize system structure as a continuous variable measured as the skewness of the distribution of country connectivity in the networks of economic interdependence, or as a measure of network centralization. Constructing these graphs annually, and generating overall network statistics such as centralization, can give us an understanding of how system structure has evolved over time.
of network density that is the proportion of all potential ties that are actualized. Second, I construct three measures of network centralization, which quantify the extent to which a network is centralized around a single node.
As explained above, network density is the percentage of possible ties in a network that actually exist. There are two standard ways of measuring network density, depending on whether a network uses continuous or dichotomous data. When using dichotomous data, this measure is constructed accordingly:
actual connections
potential connections (1.1)
where,
potential connections= n∗(n−1)
2 (1.2)
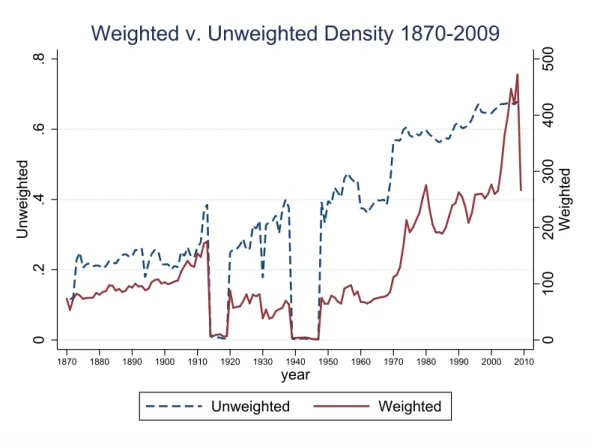
The weighted version of this measure simply weights the numerator of the above equation by the sum of the value of existing ties. Figure 1.4 shows the evolution of weighted and unweighted network density from 1870 to 2009. Density collapses during the World Wars, but otherwise gradually increases over the period, rising more sharply during the post-war period than in the pre-war period.
There are also two standard ways of measuring network centralization, depending on whether a network uses continuous or dichotomous data. Freeman’s original degree cen-tralization measure is simply the sum of the differences between the unweighted degree centrality of the most central country and the unweighted degree centrality of all other nodes, divided by the maximum potential value of this sum of differences. In essence, this measure is comparing the observed graph to an ideal hub-and-spoke graph, where one node (the hub) is connected to every other node (spokes), but other nodes are con-nected only to the hub node. This hub-and-spokes graph is the most centralized network structure.
0
100
200
300
400
500
Weighted
0
.2
.4
.6
.8
Unweighted
1870 1880 1890 1900 1910 1920 1930 1940 1950 1960 1970 1980 1990 2000 2010 year
Unweighted Weighted
Weighted v. Unweighted Density 1870-2009
Figure 1.4: System Density 1870 -2009
0
500000
1000000
1500000
2000000
0
.2
.4
.6
.8
InDegree Value
1870 1880 1890 1900 1910 1920 1930 1940 1950 1960 1970 1980 1990 2000 2010
year
Unweighted Value Weighted Value
Unweighted v. Weighted InDegree Centralization
Figure 1.5: Unweighted and Weighted Degree Centralization 1870-2009
0
.2
.4
.6
.8
1870 1880 1890 1900 1910 1920 1930 1940 1950 1960 1970 1980 1990 2000 2010
year
Centralization Density
Network Centralization and Density 1870 - 2009
While unweighted and weighted degree centralization are helpful measures for the purposes of describing and categorizing system structure based on trade patterns, they are incomplete on their own. The weighted centralization measure using bilateral trade data measures only the sum of differences between the value of US imports and the value of all other countries’ imports. This tells us very little about the structure of the network or patterns of trade. The unweighted centralization measure quantifies the difference between the number of countries the United States imports goods from and the number of countries from which all other countries import goods. This is a better indication of structure, but it is still ignorant of the quantity of goods that pass between countries. Both the number and value of each country’s ties are important. Therefore, I employ a measure of centrality that combines both the weighted and unweighted measures developed by Opsahl et al (2010) in order to develop a measure of network centralization that accounts for both the value and number of nodes’ ties. Opsahl centrality, the basis of my centralization measure, is constructed accordingly:
Ci =Kix(Si/Ki)α (1.3)
Where K is the number of nodes a focal node is connected to (unweighted degree centrality), S is the average value of the focal nodes’ ties (weighted degree centrality divided byunweighted degree centrality), andα is a tuning parameter. When the tuning parameter, α, takes on a value of 1, the centrality measure is equivalent to weighted degree centrality. When αtakes on a value of zero, the result is equivalent to unweighted degree centrality. I use a value of .5 for this parameter simply because both variables deserve equal weight; there is not a strong argument to be made as to why the weighted or unweighted measure should matter more than the other.
observed data. In formula form:
OC =
Pn
i Ci(max)−Ci
(n−1)∗(Si(max)/n−1)α−Si(min)α
(1.4)
Where C is Opsahl centrality,Ci(max) is the maximum value of Opsahl centrality in the
network, S is theweighted degree centrality, Si(max) andSi(min) are the maximum and
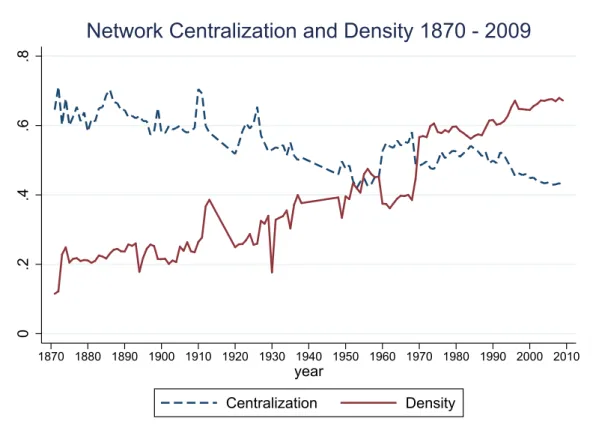
minimum non-zero values of weighted degree centrality, and n is the number of nodes. Figure 1.7 presents a time series of network density and Opsahl centralization vari-ables. Data for the years during WWI and WWII are unreliable, and so I code these years as missing in this graph, though the series looks continuous. Several features are noteworthy. First, the system exhibits two clear periods of increased centralization. The first occurs during British hegemony in the long 19th century, and the second begins after the conclusion of WWII. We see Britain’s decline and American (and German) ascent as centralization decreases from its high of .85 in 1888 to about .76 just before WWI. America consolidates its economic hegemony in the two decades following WWII. Opsahl centralization increases from .74 at the end of WWII to .9 in the year 2000, but then begins to decline slightly due to the rise of China.
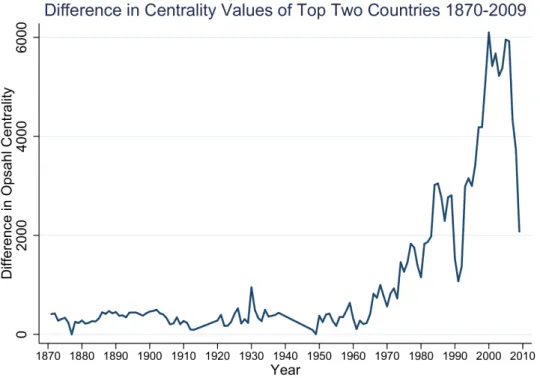
Because the Opsahl centralization measure presented in figure 1.7 averages the dif-ference between the centrality of the most central country and all other countries in the network, it glosses over changes that occur at the core of the system. To observe these changes more clearly, I construct a time series of the difference in the Opsahl centrality values of the two most central countries in the network from 1870 to 2009, presented in figure 3.4. The decline of British hegemony is evident here, as the difference between the centrality of Britain and the United States and/or Germany becomes quite small in the first decade of the 20th century. American dominance in the second half of the 20th century is also evident, though the rise of China has meant a decline in the top 2 difference since the mid-2000s.
Figure 1.7: Network Centralization and Density 1870-2009
0
.2
.4
.6
.8
1
1870 1880 1890 1900 1910 1920 1930 1940 1950 1960 1970 1980 1990 2000 2010
year
Density Opsahl Centralization (alpha=.5)
Network Centralization and Density 1870-2009
occurred during the long 19th century, and gave way to a brief period of economic multi or bipolarity just prior to and during the World Wars. The second period of hegemony emerged in the middle of the 20th century and persists. Density was lowest during British hegemony and continues to increase. The two periods of hegemony are thus unique in the level of connectedness exhibited by countries. British hegemony was hegemonic both in terms of the number of countries with which it conducted economic relations and in terms of the value of the economic transactions it conducted. However, the difference between the size of its economy and its closest competitors was not as large as the dif-ference between the US and its closest competitors in contemporary times. American hegemony, in contrast, is hegemonic due to the value of its economic transactions only, not in the number of countries with which it conducts exchange. In a sense, we can think about contemporary hegemony as having a large and robust semi-periphery of countries that was largely absent during British hegemony.
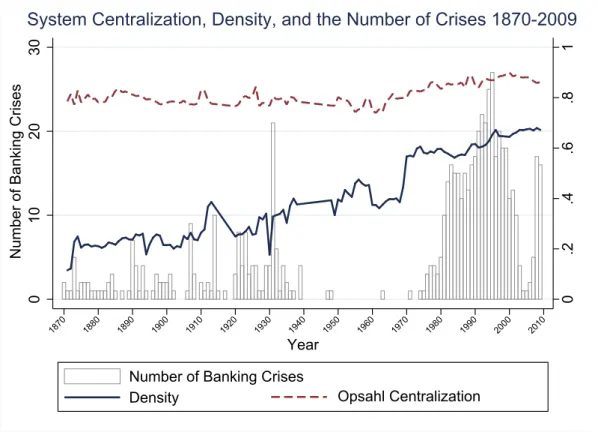
Figure 1.10 plots network density and centralization over the period 1870-2009, along with the annual number of financial crises. The theory I have proposed in this paper is that the structure of the international financial system affects the pattern of financial crises observed since 1870. More specifically, my theory implies that the larger number of crises observed in contemporary times is due to a higher level of interconnectedness (density) from economic transactions between countries. The larger number of economic ties means that there are more conduits for spill-over effects to fuel bubbles which cause crises, and also more pathways through which contagion can spread.
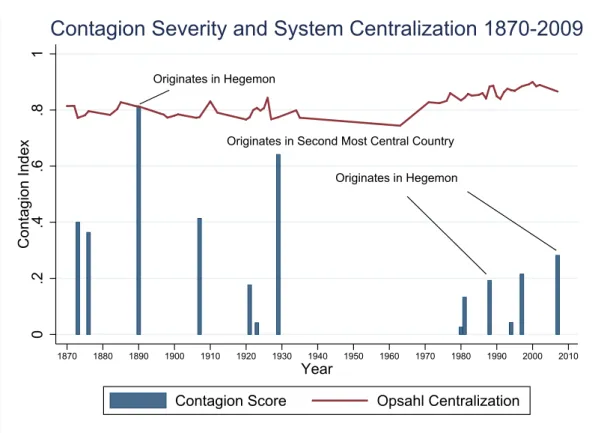
The details of my contagion index can be found in subsection 6. Ultimately, I identify 115 unique crises, 13 of which prove contagious. I create a measure of contagion by taking the percentage of trading partners who experience contagion multiplied by the average number of years those countries experience contagion. Figure 1.9 presents a time series of contagious crises. First, notice that the scale of contagion has decreased over time, as system centralization increased under American hegemony.13 Second, the most conta-gious crises originated in either the most or second most central country in the system. I employ this measure of contagion as a dependent variable in one of my statistical models in the next subsection.
Figure 1.9: Contagion Severity Opsahl Centralization 1870-2009
Originates in Hegemon
Originates in Hegemon Originates in Second Most Central Country
0
.2
.4
.6
.8
1
Contagion Index
1870 1880 1890 1900 1910 1920 1930 1940 1950 1960 1970 1980 1990 2000 2010 Year
Contagion Score Opsahl Centralization
Contagion Severity and System Centralization 1870-2009
This subsection presents an overview of my network and contagion data that I will employ in my empirical analysis in the next subsection. Before concluding, note that while the analysis presented here is based solely on a single network of bilateral trade data (since it is the only highly available source of bilateral economic data), it is a reasonable representation of the overall structure of the economic multiplex. International
investment occurs more often and in higher volume between countries who also trade with one another. The two networks are likely to exhibit relatively minor differences. Network statistics of periodic bilateral investment data that do exist confirm this is the case (see Appendix). If bilateral investment data were available for the past century and a half, it would likely confirm the findings outlined herein.
Figure 1.10: Opsahl Network Centralization and Density 1870-2009
0
.2
.4
.6
.8
1
0
10
20
30
Number of Banking Crises
1870 1880 1890 1900 1910 1920 1930 1940 1950 1960 1970 1980 1990 2000 2010
Year
Number of Banking Crises
Opsahl Centralization Density
System Centralization, Density, and the Number of Crises 1870-2009
1.5 Statistical Models: Economic Integration and Crisis
In this subsection, I present the results of several Temporal Network Autoregressive Models (TNAM) to test hypotheses 1-3, regarding the effect of network structure on the propensity of countries to experience financial crisis. These hypotheses are:
Hypothesis 1: Countries should be more likely to experience a crisis when the international economy is less centralized around a single, core economy.
Hypothesis 3: Countries that are more integrated within the international economy, are more likely to experience a systemic financial crisis. This is due both to spillover effects, and also contagion.
The TNAM is a new inferential statistical model for time series network data that accommodates models with nodal attributes as the dependent variable and network and nodal attributes as independent variables (Leifeld and Cranmer 2016). The model is the only one of its kind, and is a huge improvement over standard maximum likelihood regression models because it can account for the dependence between units of observation that are embedded in a network. Accounting for aspects of a data-generating process driven by network structure is essential to proper inference. The TNAM is an extension of spatial autoregressive models, but it is applied to network data. For the purposes of evaluating my theory, the network employed is the international import network. The network statistics I include are generated based on this network, as described in subsection 4. Furthermore, I use this network weighted by the dependent variable to control for the effect of second degree contagion. I include country-year observations for 171-200 countries, depending on the model, from 1976 to 2009. All independent countries in each year, for which data is available, are included in the sample. I employ random effects because some countries never experience a financial crisis in the period for which they exist and because some control variables are time invariant.
1.5.1
Dependent Variables
My main dependent variable is a dichotomous measure of whether or not a country experiences a financial crisis. The data is taken from Laeven and Valencia (2014) who have recorded all systemic banking crises in the international system since 1976.