EVALUATING CREATIVE CHOICE IN K-12 COMPUTER SCIENCE CURRICULUM
A Thesis presented to
the Faculty of California Polytechnic State University, San Luis Obispo
In Partial Fulfillment
of the Requirements for the Degree Master of Science in Computer Science
by Kirsten Mork
c 2019 Kirsten Mork
COMMITTEE MEMBERSHIP
TITLE: Evaluating Creative Choice in K-12 Com-puter Science Curriculum
AUTHOR: Kirsten Mork
DATE SUBMITTED: June 2019
COMMITTEE CHAIR: Zo¨e Wood, Ph.D.
Professor of Computer Science
COMMITTEE MEMBER: Theresa Anne Migler-VonDollen, Ph.D. Assistant Professor of Computer Science
COMMITTEE MEMBER: Aaron Keen, Ph.D.
Professor of Computer Science
COMMITTEE MEMBER: John Wilcox
ABSTRACT
Evaluating Creative Choice in K-12 Computer Science Curriculum Kirsten Mork
Computer Science is an increasingly important topic in K-12 education. Ever since the “computing crisis” of the early 2000s, where enrollment in CS dropped by over half in a five year span [19, 74], increasing research has gone into improving and broadening enrollment in CS courses. Research shows the importance of introducing CS at a young age and the need for more exposure for younger children and young adults alike in order to work towards equity in the field [43, 69]. While there are many reasons for disinterest in CS courses [19], studies found one reason young adults do not want to study CS is a perception of it being tedious and lacking opportunities for creativity [74]. Making more creative assignments is one way to try and engage more students who may not feel like stereotypical computer scientists.
ACKNOWLEDGMENTS
Thanks to:
• Zo¨e Wood, for being my wonderful advisor and for all of her hard work and support
• Theresa Migler-VonDollen, Aaron Keen, and John Wilcox for being on my com-mittee and helping so much along the way
• John Wilcox and Peabody Charter Elementary School, for letting me take so much lab time for this thesis
• Robyn Morton and all the staff at Restorative Partners, for being supportive of our class and getting my volunteers cleared so quickly
• Greg Murphy, for being such an amazing teacher and for letting us come into his classroom to teach our course
• All of the staff at Juvenile Hall, for being so supportive and helpful
• Timothy Wong and Erik Mork, for volunteering at Juvenile Hall with me. I could not have taught the course without you both. (Also thanks to Erik for being the best brother)
• Timothy Wong, Amy Lewis, and Kole Yager, for being Zo¨e’s kids with me • My parents, for listening, supporting and always being there
• Bobby Boyd, for listening to me brainstorm for my thesis all year
• Anne and Paige Anaya, for being amazing elementary school teachers in my family and for all of the ideas
TABLE OF CONTENTS
Page
LIST OF TABLES . . . x
LIST OF FIGURES . . . xi
CHAPTER 1 INTRODUCTION . . . 1
1.1 Problem . . . 4
1.2 Context . . . 5
1.3 Contribution . . . 6
2 BACKGROUND . . . 9
2.1 Self-Efficacy . . . 9
2.1.1 Defining Self-Efficacy . . . 10
2.1.2 Importance of Self-Efficacy . . . 10
2.1.3 Testing for Self-Efficacy . . . 11
2.2 Creativity . . . 12
2.2.1 Creativity in CS Education . . . 12
2.3 Designing a Curriculum to Engage Middle and High School Students 13 2.3.1 Curricular Approaches . . . 14
3 RELATED WORK . . . 16
3.1 Code.org . . . 16
3.2 Bootstrap . . . 17
3.3 MyCS . . . 19
3.4 Peabody Charter Outreach . . . 20
3.6 Introductory Computer Science Courses with Restorative Partners . . 22
4 FIFTH GRADE CURRICULUM . . . 24
4.1 Intervention One . . . 26
4.1.1 Design . . . 27
4.1.2 Research Questions - Design, Results, and Threats to Validity 31 4.1.3 Summary . . . 42
4.2 Intervention Two . . . 43
4.2.1 Design . . . 44
4.2.2 Research Questions - Design, Results, and Threats to Validity 53 4.2.3 Summary . . . 64
5 JUVENILE HALL CURRICULUM . . . 66
5.1 Design . . . 66
5.1.1 What: Introductory Course . . . 67
5.1.2 Who: Demographics . . . 67
5.1.3 How: the Curriculum . . . 68
5.2 Implementation . . . 71
5.2.1 Setup . . . 72
5.2.2 Lessons . . . 72
5.3 Validation . . . 79
5.3.1 Research Approval . . . 79
5.3.2 Surveys . . . 79
5.3.3 Quantitative Results . . . 79
5.3.4 Qualitative Results . . . 83
5.3.5 Recommendations . . . 85
6 CONCLUSION AND FUTURE WORK . . . 87
6.1 Fifth Grade Curriculum . . . 87
6.1.1 Future Work . . . 88
6.2 Juvenile Hall Curriculum . . . 89
BIBLIOGRAPHY . . . 91
APPENDICES A IRB PROPOSAL . . . 101
B IRB MODIFICATION REQUEST . . . 107
C PEABODY-INTERVENTION 1: CC MOUSE . . . 111
D PEABODY-INTERVENTION 1: CC SNOWMAN . . . 126
E PEABODY-INTERVENTION 1: NO CC MOUSE . . . 141
F PEABODY-INTERVENTION 1: NO CC SNOWMAN . . . 145
G PEABODY-INTERVENTION 1: POST PRACTICE SURVEY . . . 150
H PEABODY-INTERVENTION 2: CC CONDITIONALS . . . 153
I PEABODY-INTERVENTION 2: NO CC CONDITIONALS . . . 165
J PEABODY-INTERVENTION 2: Surveys . . . 176
K JUVENILE HALL SYLLABUS . . . 193
L CVA TEACHER’S REPORT ON JUVENILE HALL CLASS . . . 195
LIST OF TABLES
Table Page
1 Count of Student Preferences in No CC Treatment (Note: Students All Received the Same Treatment for the Variable Sheets). . . 63 2 Count of Student Preferences in CC Treatment (Note: Students All
Received the Same Treatment for the Variable Sheets). . . 63
3 Number of Students (of Six) Preferring a Game-Design Course, Com-putational Art Course, or Either. . . 80 4 Pre-Survey Concerning Computer Science as a Career (7-Point Likert
Scale) . . . 81 5 Pre-Survey Concerning Desire to Learn Programming Topics
(7-Point Likert Scale) . . . 81 6 Pre-Survey Concerning Creativity (7-Point Likert Scale) . . . 81 7 Averages of Student Responses from Selected Pre-Survey Questions
(7-Point Likert Scale) . . . 82 8 Averages of the Post-Survey Results for the Six Students Present on
the Last Day of Class (7-Point Likert Scale) . . . 82 9 Comparison of Pre and Post Surveys for the Students Who Took
LIST OF FIGURES
Figure Page
1 Gender at 5 Institutions with Most Students Graduating in Software
Engineering, 2016 [7] . . . 2
2 Diversity and Gender of Awarded Bachelor’s Degree in Software En-gineering, 2016 [7] . . . 2
3 Racial Diversity of Awarded Bachelor’s Degree in Software Engineer-ing, 2016 [7] . . . 3
4 Peabody Charter Students’ Self-Reported Enjoyment of Math, En-joyment of Art, and Interest in Computer Programming (5-Point Likert Scale). . . 7
5 Teenage Perceptions of CS [74] . . . 13
6 Online Processing Editor [9] . . . 20
7 Sample Curriculum [71] . . . 21
8 Student Enrollment at Peabody Charter by Ethnicity. . . 24
9 Student Enrollment at Peabody Charter by Other Demographics. . 25
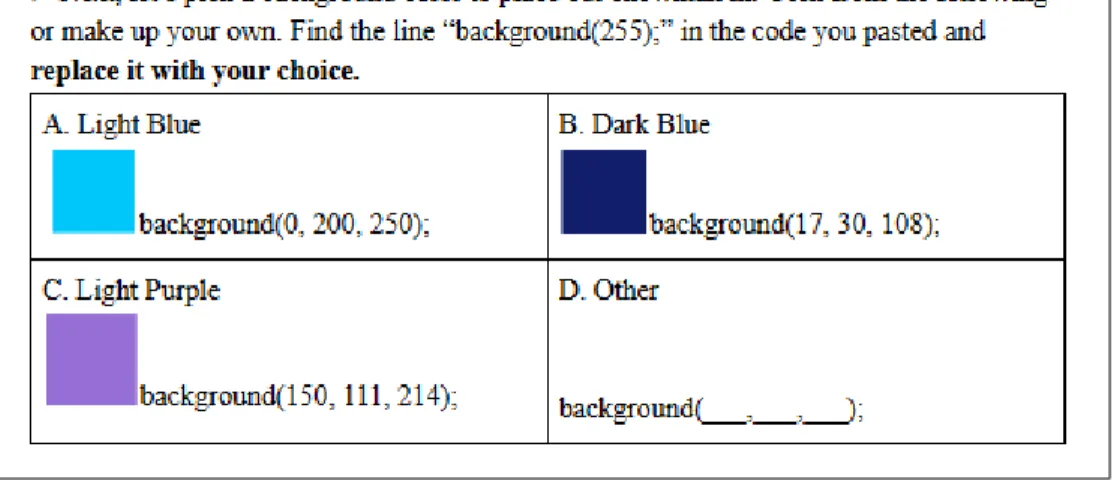
10 The First Instruction for Selecting the Background Color for the Creative Choice Worksheet. . . 27
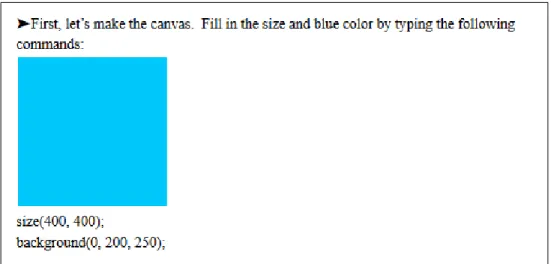
11 The First Instruction for Making the Background Color for the Non-Creative Worksheet. . . 28
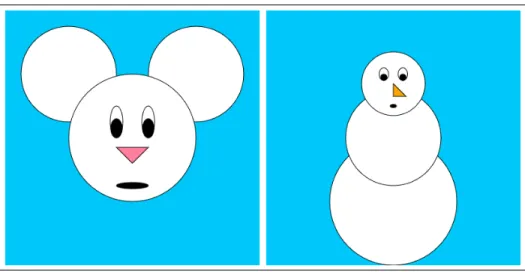
12 The Two Images Made by Each Student During Intervention One (Though One of the Images Varied Depending on Which One Was on the Creative Choice Worksheet for a Given Student). . . 29
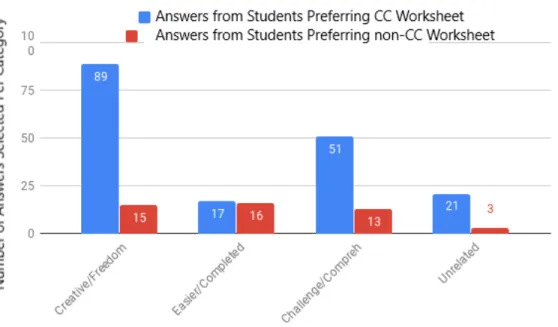
13 Checked Reasons for Worksheet Preference . . . 32
14 Free Response for Worksheet Preference . . . 34
16 Average Count of Created Options by Worksheet Style Preference (Picking Options or Following Instructions). . . 41 17 Conditionals Part One: Example Picture Created by a Fifth Grade
Student in the Creative Treatment Group. . . 46 18 Conditionals Part One: The Two Circle Puzzles the Students in the
Non-Creative Treatment Were Asked to Make. . . 46 19 Conditionals Part Two Worksheet Segment: Example Challenge
As-signed to Students in the Creative Choice Treatment. . . 47 20 Conditionals Part Two Worksheet Segment: Example challenge
As-signed to Students in the Non-Creative Choice Treatment. . . 48 21 5-point Likert Scale Used for Efficacy Surveys. . . 49 22 Oneway Analysis of Variable Performance Scores by Lab Period. . . 53 23 Analysis of Variance on Variable Performance Scores by Lab Period. 53 24 Oneway Analysis of Variable and Conditional Performance Scores by
Self-Regulatory Efficacy rankings of High and Low. . . 56 25 Oneway Analysis of Variable and Conditional Performance Scores by
Variable and Conditional Self-Efficacy Scores. . . 57 26 Oneway Analysis of Conditional Performance Scores by Lab Period
(All Periods - Monday-1:55 and Thursday-8:30 Labs Were Given the Creative Treatment) . . . 59 27 Analysis of Variance on Variable Conditional Scores by Lab Period
(All Periods - Monday-1:55 and Thursday-8:30 Labs Were Given the Creative Treatment) . . . 60 28 Analysis of Variance on Variable Conditional Scores by Treatment
(Creative and Non-Creative) (P-Value of 0.1783 Shows the Mean Difference is Not Statistically Significance) . . . 60 29 Oneway Analysis of Conditional Performance Scores by Thursday
30 Oneway Analysis of Conditional Self-Efficacy Scores by Treatments (Creative and Non-Creative) for All Classes (Left Image) and for Just the Thursday Classes (Right Image). (The P-Values of 0.6970 (Left) and 0.8206 (Right) Indicate No Significant Difference in Efficacy by Treatment) . . . 61
31 First Assignment for Students to Start Planning Their Game. . . . 73 32 Backgrounds Students were Given to Chose from While Practicing
Chapter 1
INTRODUCTION
It is a commonly held belief that there is need for greater diversity and acceptance in the tech industry [20, 22]. However, while the belief is common across academia, so-lutions are less fleshed out. Questions arise, such as how and where to make changes? Some might look to industry as a starting place; however, though industry is where a lot of the discrepancies lie, by the time individuals are being hired into industry positions, the pool of qualified workers is not necessarily a diverse one. The next log-ical step is to examine college enrollment and retention within tech-related degrees. As could be expected, there are huge demographic gaps in students graduating with Bachelor’s Degrees in technical majors. In 2016, for example, white males made up a majority of Software Engineering graduates, as seen in Figures 1, 2, and 3 [7]. Women are shown to make up lower percentages of computer majors than other STEM majors such as biology [23]. Underserved, intersecting groups face numerous challenges that more privileged students never begin to face [20, 51, 57]. Colleges have many issues concerning inclusivity, indicating their responsibility in making CS more equitable.
Figure 1: Gender at 5 Institutions with Most Students Graduating in Software Engineering, 2016 [7]
Figure 3: Racial Diversity of Awarded Bachelor’s Degree in Software En-gineering, 2016 [7]
for these students and others coming in [29]. However, while college-level change is important, it is neither sufficient nor most important in creating equity within software engineering.
Pre-college, however, is vague - do high school students merely need to be exposed to CS, or should exposure come earlier? Research shows that students as young 13 and 14 already have predictive inclinations to which career they will have, implying the importance of exposure to computer science before then [37]; clearly, to reach students early enough to make a difference, action is needed in the entire K-12 space. In addition, computer science stereotypes are embedded during these younger ages as well. In regards to the gender gap, studies show it begins before college and is perpetuated by stereotypes of the field and in the classroom [23, 48]; one study found that, before implementing computer science curriculum into the school, most fourth grade students associated computer science with males working alone [36]. If students are not given equal opportunity to K-12 computer science curriculum, and if stereotypes are not fought at younger ages, these students are placed at a disadvantage.
1.1 Problem
expect a difference - students must be taught in a way that fights stereotypes of the field [23].
In addition to reaching more students, we have to design curriculum in a way to meet each group of students’ specific needs. If curriculum is taught to students for which it was not designed, it could be more harmful than helpful in encouraging a computer science career. One of the areas to specifically design for is age, as K-12 is a broad range of students. For example, research shows the difference of capabilities within 4th, 5th, and 6th grade computer science classes and why it is important to target different concepts at these different grade levels [37, 74]. In addition, young adults have their own reasons for liking or disliking computer science, and should be taught in a way to tailor to their preferences [32]. As summarized by the K-12 Com-puter Science Framework Steering Committee: “The learning accommodations and curricular modifications demonstrate that established techniques for differentiation instruction can be readily applied in computer science to engage all students” [25]. Research is needed to see what engages different groups so curriculum can be modified appropriately.
1.2 Context
projects introducing coding via simple computational art exercises. The Juvenile Hall course was a completely new intervention based on the fifth grade curriculum, which introduced programming by building a simple 2D game. This curriculum included substantial modifications to fit the needs of this target population.
As mentioned above, it is important to not only teach these ranges of students, but also to create the most engaging curriculum for each of their needs. Many pro-grams and organizations are already working in K-12 education, such as code.org and Bootstrap [3, 6]. There are many techniques being used to try to engage and teach young students better - groups have tried block-based coding, online modules, and more [28, 37, 62, 32, 64]. Within the context of K-12 curriculum, we specifically want to look at fostering creativity through course material, as this seems like a promising way to engage young students. One inspiration for this idea was a survey given to the fifth grade Peabody Charter students at the beginning of the school year. They were asked to rank how strongly they enjoyed learning math, enjoyed learning art, and were interested in computer programming. Students most strongly indicated an enjoyment of art (as seen in Figure 4). An inherent element of visual art is creativ-ity and design. Since designing and choosing visual elements is a natural extension of making art, we wanted to utilize the creative choice found in art and game-first approaches to engage different groups of students. Other research validates that cre-ativity is one way to engage different ages of students [64, 72, 74], strengthening our desire to research creative choice within our CS curriculum.
1.3 Contribution
First, half of the thesis was conducted with the fifth-grade computer lab at Peabody Charter. Within this context, we isolated and tested how creativity and how creative choice benefits or hinders student learning within CS. We validated this aspect of the curriculum to try to make the best learning experience for students, keeping in mind their personal preferences, effects on self-efficacy, and effects on academic learning.
From the fifth grade research, we found most students value creativity and freedom in their assignments, as well as a sense of ownership and choice. However, we also found that students who felt they were struggling preferred the non-creative assignments. A solution to this disparity is limited or contained creative assignments. One way to achieve this is through multiple choice design options. In addition, we found creative treatments had no impact on efficacy and performance.
The second half of this thesis involved designing and launching a new creative class and evaluating its initial success. The course was taught to incarcerated youth at SLO County’s Juvenile Hall. Given that the incarcerated youth population has very limited access to computer science education and that this education has benefits for this population, we believe it is important to introduce and study the effectiveness of this computing curriculum. In particular, we wanted to validate whether the creativity of game design in CS curriculum was engaging and empowering for the students.
Chapter 2
BACKGROUND
Two focuses of this thesis are evaluating the effects of creativity in a K-12 CS cur-riculum and expanding the reach of CS curcur-riculum, specifically to San Luis Obispos Juvenile Hall students. For the former, it is important to understand some definitions and ideas used within research in this area. Some important background information to be aware of includes definitions of ‘self-efficacy’ and the overall research on cre-ativity in education. For the latter, it is important to understand current research on computer science curriculum targeted at engaging high school students.
2.1 Self-Efficacy
2.1.1 Defining Self-Efficacy
Self-efficacy is a much debated term and defined in many different ways; furthermore, it is often confused with similar terms such as ‘self-confidence’ and ‘self-beliefs’ [47]. While there are debated views, the most cohesive definition, and most useful for the sake of our research, is as follows: “Perceived self-efficacy is defined as people’s beliefs about their capabilities to produce designated levels of performance that exercise influence over events that affect their lives” [17]. An important note is that it does not mean peoples’ actual capabilities, but merely theirbeliefs about their capabilities. As we will see, however, beliefs go a long way in determining results.
2.1.2 Importance of Self-Efficacy
2.1.3 Testing for Self-Efficacy
It is important to be sure of what you are actually testing - if surveys are not carefully crafted, findings may falsely attribute variables to affecting self-efficacy. There are many guides on how to properly test for self-efficacy. First of all, surveys must be testing on efficacy within narrow fields [14]. It is not practical or possible to test how one curriculum or experiment affects all realms of a student’s efficacy - hopefully, our curriculum will positively impact student computer programming efficacy, but it probably should not affect athletic efficacy or public speaking efficacy. Therefore, it is important to write questions to test the specific domain the research focuses in, leading to the second key part of testing for efficacy.
Since it is impossible to have pre-made and pre-validated surveys for all possible fields of study, it is important to carefully craft and validate questions for each new domain researchers hope to test efficacy in. Bandura gives guides on how to create surveys for various domains [14].
2.2 Creativity
Another important topic of research for our study was that of creativity. Creativity can be defined in many ways. Some new research focuses on elements of defiance [66], while others define creativity colloquially for education, focusing on engagement, mo-tivation, or flexibility in choosing learning tasks’ [63]. Another fairly straightforward definition of creativity explains it as producing novel or original work that is ap-propriate and effective for the situation [39, 76]. While there are many differing explanations or definitions, the important converging point is that research has been narrowing in on the importance of creativity for society and thus its need within K-12 education [38, 39, 76].
2.2.1 Creativity in CS Education
Creativity in the context of CS education has some interesting nuances to explore.
First, researchers have begun exploring howlimited creativity within computer science education can still pass as creative in the minds of the students [63]. Other writings explore how constraints are not only acceptable, but required for the creative pro-cess [67]. Our research explores this space, looking at the degrees of creativity that are most useful and engaging for students.
ways to engage more young adults in CS [74]. As discussed in the introduction, by reaching younger students with an engaging CS curriculum, in this case by using more creativity in computing curriculum, stereotypes about computing can be changed to create a more welcoming field of study for a wider audience.
Finally, creativity is an essential part of engineering in general, and thus should already be incorporated into curricula, despite the other aforementioned benefits. Teaching creatively makes better engineers, as innovation and novelty is an essential part of engineering by nature [27, 59]. Therefore, not only is it important for engage-ment, inclusivity, and breaking stereotypes - it is inherent to the field and thus should be inherent in its curriculum.
Figure 5: Teenage Perceptions of CS [74]
2.3 Designing a Curriculum to Engage Middle and High School Students
overlapping needs. Overall, we explored and borrowed from research about teaching CS to young adults and the diversity of curricula needed to teach non-majors.
Research shows that young adults often believe the many CS stereotypes they have been presented with. One study found young adults believing CS was boring, only for the ‘smart’ students, antisocial, lacking creativity, and tedious [74]. Another study explored how adolescent girls often avoid CS due to stereotypes saying they do not belong, and found that one way to begin breaking stereotypes is through having non-stereotypical environments and classroom settings [22, 48]. A large part in creating equity is to break stereotypes before college; therefore, it is important to investigate what the preexisting stereotypes are, what perpetuates them, and how to create more engaging experiences for all students.
2.3.1 Curricular Approaches
There is currently a lot of research on how to make more engaging curricula for non-majors and young adults.
One technique for engaging non-major students is a project-centered curriculum. One study, which created a CS0.5 course for non-majors, discussed curricular approaches to meet the needs of the diverse group of students who were not familiar with computer science, nor necessarily going to pursue computer science after the first few courses. They found success in project-based courses with elements of student selection on their project topics [29]. Furthermore, other research indicates that project based learning increases self-efficacy [46]. One particular project that some students find highly motivating is game development. Research notes that games are fun projects which often allow students creative liberties [74].
students. One study found that, for students learning math, proximal subgoals (close, attainable subgoals) over distal goals (larger, further away goals) caused intrinsic interest and personal efficacy [16]. This led us to strongly consider how to give students small subgoals along the way that would lead to the overall class goal.
Chapter 3
RELATED WORK
Numerous groups have begun striving for equity in CS education, and many have also focused on the K-12 space. Various techniques have been attempted, some more successful than others. Some notable and inspirational efforts to create equity in CS are outlined below.
3.1 Code.org
Code.org offers an amazing model of spreading CS education to young students. That said, there are distinct ways our work differs from Code.org curriculum. Code.org uses online modules, which are not accessible to all students - for example, online modules are sometimes useless in settings such as Juvenile Hall, where internet use is strictly monitored. Our work contributes to this area by creating a curriculum for these settings. In addition, Code.org (and many similar programs) use block-based programming for younger students, where code chunks are dragged and dropped. (Though Code.org does offer options to use JavaScript in addition to block-based coding for some assignments for older students, most of the modules, especially for younger students, are exclusively block-based.) While this does provide simplification to the complex confusion of learning to code, our curriculum purposely uses text-based languages so that students will have a smoother transition to future CS courses [61]. Another way our work is differs is that it is not just teaching and creating a curriculum, but is also experimental; it focuses on discovering how creative choice within the curriculum affects learning. A lot of online modules miss aspects of creativity in the generality needed to reach all sorts of students and in the goal of simplicity (though thereare some creative assignments offered as well in addition to the more restricted modules). We explore student reactions to these varying degrees of creativity.
3.2 Bootstrap
serving nearly 50 percent African American or Latinx students and nearly 45 percent women. Their curriculum is for 6-12th grade students, and one of its key features is that it teaches coding concepts through algebra (and also physics and data science). This way, the curriculum can be taught as a standalone course or can be integrated into AP CS, math, or science courses. Not all high schools currently teach CS, but all must teach algebra - this integration of material allows for further accessibility. Bootstrap also addresses some of the concerns we had with Code.org. It is text-based, using the functional language Racket. They also provide online and offline options for using their materials.
Schanzer et al. has worked to validate Bootstrap’s algebra course and creativity within its curriculum [62, 63]. Their research shows that student math skills do in fact improve through their curriculum, indicating the success of this integrated ap-proach. Their research also explores creativity withing the curriculum. Their findings are supported by our experimental findings, as questions such as “what kind of per-sonalizations do students make?” and “How many degrees of freedom do students need to feel a sense of ownership?” were mirrored in our own study. In addition, our research furthers this work by asking more detailed questions - due to the constraints of using only one school, we were able to have ‘before’ and ‘after’ surveys as opposed to just one survey asking students to recall how they felt at the beginning of the course.
aspects of a drawing. Therefore, our work explores a similar question with a different twist. In addition, the game our Juvenile Hall students made during our course is similar to their model, but, once again, the options vary. For the Bootstrap game, students can select characters from online images, which is seen as creative and free. Our students couldmake any character from shapes and lines, which is possibly more creative since students can make anything, but also more limiting since it is slow and difficult to make complex characters from scratch. It would be interesting to compare student engagement with those options in the future. In addition, our study differed in that, due to the very small class size, the students were allowed to make nearly any edits they could think of to their games, adding immensely to the creative options. Schanzer’s paper posed the question: would students feel less creative ownership when comparing this structured game creation to more free-form creation? Our curriculum was much more free-form. In the future, it would be interesting to take their question and compare Bootstrap to our curriculum across various settings.
Another difference between the work of Schanzer et al. and our research is on breadth of research. Schanzer et al. had a broader sampling of students (225 students across multiple schools versus around 100 students at one school) and also had a simpler intervention. Our work focused less on making scalable material (which is Bootstrap’s goal) and more on making better material for our specific students. With a smaller sample size, we were able to ask more questions, distribute more surveys, and have more interventions.
3.3 MyCS
Their work focuses on teachers and partnering with them to meet specific needs. They put an emphasis on fostering a “computational identity” and breaking stereotypes by teaching that “CS is something that people like me do.” Similar to Code.org, their curriculum is based on the block-based language Scratch. Their work with teachers validated the need for breadth and depth when teaching CS and also reported the need for slowing down the curriculum. They also reported on increased self-efficacy from their curriculum. Our work differs from this work by doing less of a breadth anal-ysis on teachers and focusing more individually on the two teachers we were working with. In addition, the selfefficacy portion of their research was possibly mislabeled -no validation was given on how they showed they were actually testing self-efficacy. We attempted to provide some validation in our research on if we were actually testing for efficacy or not. In addition, while we tried to pull from the teaching suggestions this research shared, we still were using our own curriculum with offline options.
3.4 Peabody Charter Outreach
Figure 6: Online Processing Editor [9]
com-puter science through 2D computational art. The students code in Processing, an open source, text based programming language based on Java, using an online editor (shown in Figures 6) [1, 71]. The curriculum was designed by Cal Poly Professor Zo¨e Wood, fifth grade teacher John Wilcox, and a Cal Poly master’s student Katie Davis, and it teaches concepts through 2D puzzles and creative activities [28]. The students are taught concepts as a group and then are guided through exercises on their own laptops with paper worksheets for guidance (Figure 7 shows a sample of one of these worksheets). This lab is held for an hour once a week for the duration of the school year.
Figure 7: Sample Curriculum [71]
teacher who first designed the curriculum.
3.5 Processing Classes
The work of Dianna Xu et al. reports on turning a CS1 computational art course into a high school course launched at two very different schools [72]. The curriculum was designed using Processing, which is what our curriculum is built on as well. Their work shows an increase in student engagement, enrollment, and female participation as well [72].
Zo¨e Wood had already created and adapted a computational art curriculum using Processing for fifth grade, high school, and a college level CS1 course [71]. This is what our research is pulled from and modelled on, specifically the fifth grade portion. However, Dianna Xu et al. provides further validation for using Processing with a diverse range of high school students, which is what we aimed to further do by also expanding this style of course to Juvenile Hall high school students. Our work also differed fromboth models of computational art by creating a Processing-based game design course for the Juvenile Hall students instead of an art course.
3.6 Introductory Computer Science Courses with Restorative Partners
the community by bringing in individuals with a broad range of skills to teach classes at SLO County’s Juvenile Hall and Jail, fostering learning and community.
Cal Poly professor Theresa Migler, teamed up with multiple students and Restorative Partners, created and launched an introductory computer programming course in Python. She teaches at Women’s County Jail and Men’s Honor Farm [50]. In order to teach in these environments, she specifically designed the curriculum within certain guidelines. For example, the student computers could not have access to WiFi during the class and computers were only available to the students during the class. This led to a careful curriculum, where all practice and homework assignments were done by hand - this way learning could continue outside the classroom, but still meet the specific needs of the situation.
Chapter 4
FIFTH GRADE CURRICULUM
This portion of the the thesis evaluates the effects of creative choice in a fifth grade computer science curriculum.
Demographics
We conducted our research at Peabody Charter Elementary School in Santa Barbara (see Figures 8 and 9 for this school’s demographics). As mentioned in Chapter 3, four fifth grade classrooms (consisting of 107 students) attended a computer science lab for an hour once a week. One of the classes had 26 students, and the rest each had 27 students.
Figure 8: Student Enrollment at Peabody Charter by Ethnicity.
Lab
Figure 9: Student Enrollment at Peabody Charter by Other Demograph-ics.
the school, John Wilcox, who also led the computer lab each week. The students received a 10-20 minute lecture each session consisting of demos and filling out ques-tions on a worksheet together. Afterwards, they worked on finishing the worksheets on their own.
Our contribution consisted of two interventions in this lab, testing different effects of creativity on the students’ views, learning, and efficacy. We designed our own worksheets, modelled off of the worksheets the students were used to, in order to test varying degrees of creative choice. We also distributed google form surveys at different points to gather data.
Research Approval
In order to conduct research with children, we applied for and received research approval from Cal Poly’s Institutional Review Board (IRB), along with the school’s permission and parent/guardian permission for each student. The IRB proposal, the permission forms, and scripts are included in Appendix A.
Motivation
As mentioned in the Chapter 1, when the fifth grade students were given a survey at the beginning of the school year, only 40.9 percent of students reported enjoying math and 63.6 percent of students reported interest in computer programming. However, 83.7 percent of students reported enjoying art. Therefore, one hypothesized way to increase student interest in programming is to have art applications.
The fifth grade curriculum already had art incorporated, as it teaches coding through 2D computational art. However, one of the key aspects of 2D art is not just the visual display of images, but the process of creating, designing, and choosing what images to produce. Computer programming, however, is a complex subject for fifth grade students to grasp. Although the visual aspect of art was always incorporated in the fifth grade lessons, it is often difficult to give students full creative choice over the art produced. Giving students choice can often increase complexity when they are already confused - often, restrictive instructions seem necessary.
Therefore, due to student preferences for art, but also the complexities of learning a new subject, we desired to explore the nuances of student opinions in this area. Did students reporting an enjoyment of art also mean they would enjoy creative choice in coding assignments? If so, how much choice is best? While learning difficult material, would students actually choose more complex and creative options or simpler paths? These are some of the questions we explore in the two fifth grade interventions.
4.1 Intervention One
4.1.1 Design
Worksheet Design Overview
The intervention was a combination of two worksheets (for two lab periods) and a survey. Both worksheets had students write the code to draw a simple picture of a character using Processing. One of the two worksheets contained varying possibilities for creative choice. While constructing a picture, students were given multiple choice options on how to make the different features (shapes and colors) of the character they were drawing. For each feature, they could pick from three provided options or pick to create their own feature. Option ‘D’ was always an option for the students to pick “other” and design their own feature if they did not like our suggestions, as seen in Figure 10. The second worksheet involved the students typing specific instructions step-by-step (no creative choice allowed), as seen in Figure 11. The former worksheet is referred to as the creative worksheet, CC worksheet, or students having “options”, whereas the latter is the non-creative, no-CC worksheet, or students following “steps.
Figure 11: The First Instruction for Making the Background Color for the Non-Creative Worksheet.
Constraints: Reducing Complexity
In order to reduce the number of variables, the worksheets for our first intervention were not designed to be very challenging - they were merely guided steps showing students what they could do with the commands they had learned thus far. We reserved more complex assignments for Intervention Two, so this one could focus on isolating creativity as much as possible. One of the fears of making more complex assignments was that if students were stuck on a problem on one of the two worksheets for whatever reason, they might automatically like the other more. Therefore, we chose to give them base code for the no-CC and the CC assignment (aside from the “other” option students could choose) to try and isolate creative choice as the only difference instead of difficulty.
Constraints: Giving Each Treatment to Every Student
in this approach, as each class is different in student composition and abilities; we wanted to see what a student would prefer when given two assignments (one creative and one not). Due to this desire, we chose to have the worksheets based on reviewing material they had previously learned instead of teaching new material (saving this also for the second intervention). If we taught new material to the students we could not apply both treatments since students would already know the material by the time they were given treatment number two. For this reason, and other simplifying effects, we chose to give two worksheets which were as similar as possible, working with identical concepts, aside from the creative choice.
Figure 12: The Two Images Made by Each Student During Intervention One (Though One of the Images Varied Depending on Which One Was on the Creative Choice Worksheet for a Given Student).
given the mouse as the CC and a snowman as the no-CC assignment. We also made sure that two of the classes were given the CC assignment first and the other two classes were given the no-CC assignment first in case students were biased to prefer the most recent assignment they completed. Each worksheet took one lab period, so they completed one worksheet the first week and the second worksheet, followed by the survey, the second week. By making sure the classes were flipped in which type of worksheet they were given first, we could minimize skews due to students preferring/only remember the most recent assignments. We also were sure to isolate why students chose worksheet preferences to help mitigate the variables introduced by provided different images (a mouse and a snowman) each week. We were sure to evaluate if students made preference choices based on ‘unrelated aesthetics’ or due to creativity levels, which is discussed further in survey design.
References
The worksheets for the creative choice mouse and snowman and the non-creative choice mouse and snowman can be found in Appendices C, D, E, and F respectively.
Survey Design
The second half of the survey asked students specifically if they preferred having options more or following steps more, regardless of which worksheet they preferred as a whole. They were given space for a free-response explanation as to why they had this preference. The free-response question was to see the self-reported descriptions of their preferences without skewing or biasing them with predefined options.
The survey can be found in Appendix G.
4.1.2 Research Questions - Design, Results, and Threats to Validity
Research Question Concerning Overall Worksheet Preferences
These questions examine the first half of the survey, where students were asked their overall worksheet preferences and why. This was to see if students picked preferences based on the creativity differences or for other reasons to determine how important creativity and design choices truly are to our students.
Research Question 1: Which worksheet did the students prefer out of the two they were given?
Research Question 2: What are student reasons for their worksheet preferences? For those that prefer creative assignments, do they actually say it is because of cre-ativity? Why do students prefer less creative assignments?
Design
This section is particularly interesting because it helps reveal what students find to be more important. It narrows down if the students identify creative choice as an important reason for liking an assignment, or if, when not specifically asked about it, they find other unrelated aesthetics more important. It helps focus how important creative choice is to them and if it is strong enough to sway preference.
Results
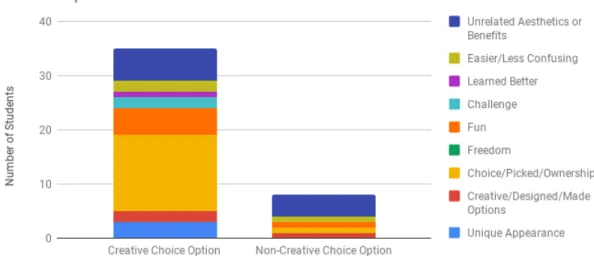
There were eight options the students could select for why they picked the worksheet they picked. Those answers could be clustered into the categories shown in Figure 13, which include: creative/freedom, easier/completed, challenge/comprehension, and unrelated.
Figure 13: Checked Reasons for Worksheet Preference
over unrelated aesthetics, with students who liked the creative assignment reporting it was because of the creativity while the minority of students who did not would report they were struggling with the material.
The initial results support our hypothesis, as 78.75 percent of students did prefer the CC worksheet. Furthermore, the most common reason for preferring the CC worksheet was creativity or freedom (see Figure 13). The most common reason for preferring the non-CC worksheet was it was easier or they completed it (see Figure 13). However, a close second was tied to the creative/freedom category. This was not as expected, and does complicate the results. However, it could be a result of students misinterpreting freedom to mean they finished faster and got more free-time (which some of the free response answers lead us to believe).
Only 41.25 percent of students chose to fill out the “other” option for why they picked the worksheet they preferred. For those who did, their free response an-swers are grouped into categories. The count of students whose responses fell into the categories (unrelated aesthetics or benefits, easier/less confusing, learned better, challenge, fun, freedom, choice/picked/ownership, creative/designed/made options, and unique appearance) are shown in Figure 14.
The most common “other” reason students preferred the CC worksheet had to do with choice, picking their options or appearance, and ownership of their work. This helps support our hypothesis of students preferring creative choice in CS curriculum. The results are strengthened by the fact that students could have picked preference for any reason (as seen by the second most popular choice being Unrelated Aesthetics or Benefits - e.g. snowmen are winter themed), yet still most commonly picked CC and picked it for the aforementioned reason.
Figure 14: Free Response for Worksheet Preference
‘choice’, but also ‘creative’, ‘design’, ‘freedom’, or ‘unique appearance’, more than half of the free-responses support the hypothesis.
Threats to Validity
Research Question Concerning Creative Preferences
These questions look into the second half of the survey, where students were asked directly if they preferred the creative choice or following steps better. This was to see, in case students picked their overall favorite worksheet based on unrelated aesthetics, what they actually thought about what we were trying to test.
Research Question 3: For students that claim to prefer creativity, regardless of overall worksheet preference, how do they define it? What aspects of “creativity” do they like or think of when hearing this word?
Research Question 4: What are student reasons for claiming to like non-creative assignments?
Design
The second half of the survey asked the students directly if they preferred being given options or being told to follow steps, regardless of which worksheet they preferred overall. Although this skews student thinking by specifically telling them what the worksheets were looking at, it allowed students to decide which style they preferred regardless of whether it was the style of their preferred worksheet or not. For example, a student might have preferred the snowman worksheet because it was winter-themed and the experiment was conducted in the winter. However, even though that rea-soning led them to prefer the snowman worksheet, they may have still preferred the creative choice style of the mouse worksheet, and would have liked a creative choice snowman best. Therefore, asking specifically about being given options or not also seemed important information to have.
Results
the following categories, as seen in Figure 15.
Figure 15: Free Response Worksheet Style Preferences (Following Instruc-tions or Picking OpInstruc-tions)
The most common reasons students gave for preferring ‘options’ were the ideas of ‘ownership’, ‘choices’, or ‘picking’. The second most common reasons were ‘design’ or ‘creativity’.
Examples of student responses binned in the top four categories are as follows:
• Choice/Picking/Ownership: “I liked it better because I like making my own disition.”
• Creative/Designed/Made: “because I got to design and it felt less like a work-sheet.”
• Unique Appearance: “beacause everybodys looked differnt”, and “because if we followed the instructions all of are makings look the same”
The few students who preferred following steps liked it because it was easier or less confusing. As expected, some of the students that preferred following steps reported struggling with Processing thus far and appreciated the simplicity of not having choice, supporting our hypothesis. Some student responses exemplifying this were as follows (copied verbatim from student surveys):
• “because then we get to know it better”
• “Because it helps me learn coding better so I can take notes and use them for other coding projects.”
• “i like better because i know what to do”
• “it felt easier to me”
• “beacuse then i can understand the meaning.”
• “because you will know what to do and no to get confuzed”
• “I liked this option better because I am not very good at processing yet.”
One student reported the following, though most preferred following steps because of the above reasons or because it was easier:
• “because it didn’t take long”
Threats to Validity
explaining the styles of worksheets. For example, students might say they preferred creativity because they think they are supposed to or it sounds better. However, research questions 1 and 2 addressed this possible issue by asking their opinions before explaining the experiment, mitigating this threat.
Research Question Concerning Worksheet Preference vs Creativity Pref-erence
After analyzing both worksheet preferences and creativity preferences, we wanted to see how many students did not have matching responses. Did many students, despite liking the creativity on one worksheet still pick the other as their favorite? This section aims to further narrow in on how strong of an importance creativity holds in the process of student engagement with computational art.
Research Question 5: How many students still picked a worksheet as their favorite despite preferring the other worksheet’s presence of or lack of creativity?
Design
As mentioned above, we asked students to report which was their favorite worksheet and also if they preferred to follow instructions or to be allowed to chose from options.
Results
Only 18.75 percent of students reported their favorite worksheet as having their less favorite style of creativity. Of these students, 12.5 percent had chosen the less creative worksheet as their favorite despite preferring creative choice over following directions. Overall, this is a very small portion of students who preferred creative choice but picked their overall worksheet preference based on unrelated aesthetics. This indicates the importance of the creative choice aspect of art over merely 2D visuals in engaging students.
Threats to Validity
As with all the survey questions, there is a chance students misunderstood our ques-tions or were skewed by the opques-tions presented in the checkboxes. However, they were asked to report their worksheet preference before they saw the checkbox options, so the threat is very small for this research question.
Research Question Concerning Degrees of Creativity
This portion of our research looks at how the students actually utilized the levels of freedom allowed. Would they choose scaffolding or full free-form design when given both options? We felt this was an important area to research because more freedom often creates curricular difficulties. Without some form of bounds, it is difficult to move a large group of students towards an end goal. If students felt they had choice without needing or wanting to go to the extra effort of designing elements from scratch, it could be helpful information in creating future curricula.
Research Question 6: Are students that report to prefer picking options over fol-lowing instructions more likely to exercise their creativity?
work?
Design
The creative choice worksheet, as mentioned in the worksheet design, offered multiple levels of creative freedom. Students had three options (options A-C) of pre-designed features (colors and geometry), or could select to create their own feature from scratch (option D). For each feature, be it nose, head shape, or eyes, students could pick from the three options or pick to create their own. The only exception was, if for the overall shape the student picked to create their own shape, all subsequent design options were automatically counted as selecting option D (e.g. if the student designed their own snowman body type from scratch, then the eyes, nose, and mouth of the snowman were also automatically option D because there were no predesigned options for their made-up body type).
Results
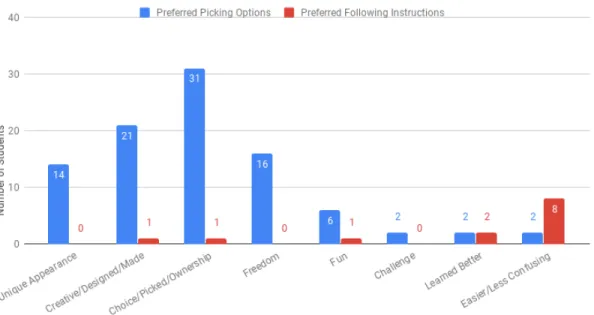
With the rules defined in the previous section taken into account, we wanted to see how many times students actually chose to create their own option versus select pre-made ones. Our hypothesis was that students that reported to prefer getting choice would also have picked to design their own options with a higher frequency. Figure 16 shows that the average number of created options per studentwas higher for students that said they preferred picking over following instructions. However, the difference is very small. In addition, 51.51 percent of students that reported to like picking over following instructions actually chose to pick option ‘D’. This is higher than the 21.43 percent of students who liked following instructions that picked at least one option ‘D’.
Figure 16: Average Count of Created Options by Worksheet Style Prefer-ence (Picking Options or Following Instructions).
exercise complete creativity. 53.75 percent of students never picked option ‘D’. Some new hypotheses from these initial results are that students want to feel they have choice, but still like some bounds and guidance on that choice. Or perhaps, students want to be given freedom and choice, but not at the cost of needing to do more work. Perhaps a limited freedom is the best approach to pursue in further research.
Threats to Validity
amount of creativity when it was limited in a particular way, but those two versions of creativity have not been directly compared.
4.1.3 Summary
Overall, the first few research questions found that most students (78.75 percent) preferred the creative assignment over the non-creative assignment. They reported liking the assignment because of the creativity and freedom. The students that gave free response descriptions of why they liked the creative assignment reported liking having choice, getting to pick from options, and having ownership over their work. However, we also found that some students (21.25 percent) preferred the non-creative worksheet because they were able to complete it or because it was easier. However, the students who gave free response reasons as to why they preferred the non-creative worksheet were mostly because of unrelated aesthetics or benefits.
From the second set of research questions, we found the most common reason students reported to prefer picking from multiple choice options was a sense of ownership, having choice, and getting to pick. The students who preferred following instructions reported they liked that it was easier and less confusing.
We also observed how creative choice played a larger role in student engagement than other unrelated reasons.
Finally, from the last set of research questions, we analyzed if students would use the full amount of creative freedom offered to them. Only 46.25 percent of students chose to create an aspect of their image on their own. The rest of the students exclusively used the suggested options we provided.
creativ-ity. We attempted to make our creative worksheet straightforward. However, as much as we tried to isolate creativity from worksheet complexity, there is inherently some complexity associated with creative freedom. Hence, a limited style of creative worksheets seems preferable. Furthermore, students reported a sense of ownership from our multiple choice assignment, but very few students actually chose to pick option ‘D’, the create-your-own option. We hypothesize that we could simplify the assignment and keep the sense of ownership and engagement by removing the option ‘D’. This way, students that preferred simpler instructions might have a better expe-rience while the students that preferred creative instructions could still feel a sense of ownership.
4.2 Intervention Two
The second intervention examines the correlation between creativity preferences, self-efficacy, and student performance while students are taught new concepts. While the first intervention removed many extraneous variables, it excluded some of the data we desired to collect. For example, Intervention One examined the positive effects of creativity on student engagement while reviewing concepts. However, does teaching new concepts add complications that minimize the positive preferences? In addition, how does creativity impact other aspects, such as student efficacy and comprehension of material? The second intervention collects this data by gathering student performance prior to the treatments; teaching a new concept with different treatments (creative and non-creative worksheets); and comparing student opinions, performance, and efficacy against this intervention’s and the previous intervention’s results.
stu-dents took a week longer than expected to complete the tasks. The first week was to apply a baseline survey to assess their performance and efficacy on the previously learned subject (variables). No worksheet design was needed on our end for the vari-able lessons since this was taught by their teacher and was already in the curriculum. We also began teaching the new concept (conditionals), and the students began their worksheets. Week two, they were given a demonstration on conditionals before con-tinuing the worksheets. Week three, they continued working on the worksheets. Week four, they finished the worksheets and received a closing survey.
4.2.1 Design
Worksheet Design
The conditional worksheets were modelled after the variable worksheets and other familiar worksheets. They were also vetted by the creators of the fifth grade curricu-lum.
There were four worksheet packets designed for this experiment - Conditionals Part One and Conditionals Part Two each in a creative choice and non-creative choice variant. Each treatment began with the same introduction to the concepts, per the lab’s usual structure, presented via a 10-20 minute lecture at the beginning of the class. These worksheets included examples and fill-in-the blank lines of questioning similar to worksheets they had been exposed to. After the lecture, the worksheets had independent work sections for the students to continue working on their own. This section accounted for the majority of the students’ time working. It is also where the creative treatment was applied.
Conditionals Part One
than comparisons and the truth value of different statements. For the independent work sections, the students were asked to use the mouse cursor position to make different pictures appear on the screen based on if the mouse cursor was on the top or bottom half of the screen. Some still found the concepts of code blocks and variables challenging. Those who did not find it as challenging and who finished early were asked to provide additional edits to their picture (e.g., changing background color based on if the mouse cursor was on the left or right half of the screen).
The students with the creative worksheets could design any picture to appear based on the mouse cursor position (Figure 17). The students with the non-creative treat-ment were asked to draw circle puzzles (Figure 18). In designing these worksheets, we considered making the non-creative treatment more engaging than circle puzzles (e.g., making a picture of a mouse and a cat). Even though the assignment lacked creative choice, this did not mean the pictures had to be bland. Furthermore, disen-gaging pictures may bias student results in favor of the creative treatment for reasons unrelated to not being given choice. However, the circle puzzles were chosen as the picture for three reasons. First, a more engaging image may lead to some emotional response and the students’ preference on the assignment may be correlated to their preference of the image itself (e.g., a student dislikes or likes mice and cats), making the data harder to dissect. Second, students may dislike it for the additional difficulty of a more complex and engaging image. Third, from previous experience working with the students, we found students often claim ownership of an accident in their code which creates an interesting change to the images they are working on. We wanted to prevent this accidental illusion of creativity. Therefore, we determined circle puzzles would be best.
Conditionals Part Two
Figure 17: Conditionals Part One: Example Picture Created by a Fifth Grade Student in the Creative Treatment Group.
Figure 18: Conditionals Part One: The Two Circle Puzzles the Students in the Non-Creative Treatment Were Asked to Make.
the creative treatment were asked to build any picture with moving pieces, applying different conditional statements to swap elements of the picture (e.g. Figure 19). Students were given multiple choice suggestions on images to make, but not told how to make any particular image. The suggestions were merely for giving students ideas. Students with the non-creative worksheet were asked to apply the same type of conditional statements to a moving ellipse (example step in Figure 20), but with explicit instructions and more restricted choice compared to the creative treatment. They were only allowed to apply changes to an ellipse as opposed to a picture of their choosing.
Figure 19: Conditionals Part Two Worksheet Segment: Example Chal-lenge Assigned to Students in the Creative Choice Treatment.
Figure 20: Conditionals Part Two Worksheet Segment: Example challenge Assigned to Students in the Non-Creative Choice Treatment.
It is important to address the styles of creative choice embedded in each worksheet. In Intervention One, students were closely guided in their design choices through the multiple choice format of the worksheets. This is a suggestive and guided style of creativity. The Conditionals Part One worksheet differed as students were not given suggestions on what images to create. This resulted in students in the creative treatment spending much of their time brainstorming or making aesthetic design decisions. The Conditionals Part Two worksheet had multiple choice, similar to Intervention One. The multiple choice gave suggestions for the students on what to make (but unlike Intervention One, had no code support). Throughout our analysis, when the term ‘creativity’ is used we are referring to the either the open style or suggestive style of creativity, depending on the treatment being referenced.
The creative worksheets can be found in Appendix H and the non-creative worksheets in Appendix I.
Survey Design
Figure 21: 5-point Likert Scale Used for Efficacy Surveys.
Students were assured we wanted their honest answers and that their responses would not reflect poorly upon them.
Survey One: Variable Self-Efficacy/Opinions
The first survey was a self-efficacy and opinion survey. First, we asked self-efficacy questions on student ability to use variables in Processing. While we tried to find previously validated computer science efficacy tests, the ones we found were either archaic, testing concepts beyond the scope of fifth graders, or for domain-specific languages that did not apply. One survey was well-written (though made for middle-school students), but it was published this year and not acquired in time for us to use [56, 68]. Therefore, we created domain-specific efficacy surveys, with statements modelled on Bandura’s Guide to domain-specific efficacy surveys [14]. The statements we asked students to examine were:
• I can write code to control the speed and direction of an ellipse using variables. • I can figure out how to use variables to change the size of an ellipse.
• I can figure out how to use variables to change the position of an ellipse. • I can figure out how to use variables to change the color of an ellipse.
• I understand variables and can help other students if they are confused about them.
Although we began validating these questions, our surveys still need further validation to determine if they are accurately testing variable self-efficacy. In addition, contrary to Bandura’s recommendation, we chose to use a 5-point Likert scale with pictures (see Figure 21) to simplify instructions for the students.
After the efficacy questions, we gathered data on student opinions about the quality and creativity of the worksheets. These questions mirrored the checkbox selections from Intervention One. Finally, we asked the students to select if they: wish they had more creativity on the worksheets, liked the worksheets as they were, or wish they had more rigid instructions. This was followed by a free-response explanation of their choice.
Survey Two: Variable Performance
The second survey was a performance quiz, testing student ability to answer questions about variables. The questions were split into general comprehension questions and application questions. We attempted to phrase the questions in a way the students could easily understand; however, they had never been given quizzes in computer lab before. Although we tried to explain their score was not a reflection on them, but on our teaching, they still showed some initial test anxiety which may have affected their performance.
Survey Three: Conditional Self-Efficacy/Opinions
After giving the two conditional treatments, we gave two more surveys to the students. Survey three was modelled on theVariable Self-Efficacy/Opinion Survey. We created and asked domain-specific efficacy questions on student ability to use conditionals. The statements we asked the students to examine are as follows:
• I can change the picture that shows up on the screen based on a conditional statement being true or false.
• I can figure out how to write a conditional statement to check if a moving ellipse is on the left half of the screen.
• I can understand conditional statements enough to do the exercises we are given. • I understand the difficult parts of conditional statements beyond just being able
to do the worksheets.
• I understand conditional statements enough to help other students if they are confused about them
In addition, unlikeSurvey One, we also included self-regulatory efficacy questions de-veloped in external research [31]. We wanted a validated way to measure self-efficacy outside of just using our newly developed surveys. Survey Three also included similar opinion questions about the quality and creativity of the conditional worksheets.
In choosing the self-regulatory efficacy survey, we researched numerous survey op-tions. While many validated efficacy surveys exist (such as the MSLQ) for academic achievement/student learning, most are targeted for college students [56, 55]. Other studies have faced similar problems in finding age-appropriate computer efficacy sur-veys [11]. There also are some efficacy sursur-veys refined for children, but some were phrased in ways that seemed susceptible to stereotype threat and others were vali-dated against measures besides academic performance [41, 31]. Due to the limited options, but the desire to use at least one survey that underwent more extensive vali-dation than we had resources for, we decided to use the following child self-regulated learning efficacy survey created by other researchers [31]:
• I can get myself to study when there are other interesting things to do. • I can always concentrate on school subjects during class.
• I can take good notes during class instruction. • I can plan my schoolwork for the day.
• I can organize my schoolwork.
• I can remember information presented in class and textbooks. • I can arrange a place to study without distractions.
• I can get myself to do schoolwork.
The strengths of this survey were that it was designed for elementary students in the US (many surveys were for the wrong age group or phrased poorly for US students) and that it tested what we wanted to test. It also underwent inter-rater reliability tests and was shown to correlate with other aspects efficacy is expected to correlate with. One of its weaknesses is that it was not validated against academic achievement, which is an important step in validating student efficacy surveys [14]. Therefore, even though this survey was validated, we still needed to test its correlation with student performance.
Survey Four: Conditional Performance
This survey was modelled on the Variable Performance Survey, replacing questions to apply to the new topic of conditionals.
4.2.2 Research Questions - Design, Results, and Threats to Validity
Research Question Concerning Baseline Performance
This section of our research reports baseline measurements of student performance in the different lab periods.
Research Question 7: Prior to applying the creative treatments, are differences in student performance, across the different lab sections, statistically negligible?
Figure 22: Oneway Analysis of Variable Performance Scores by Lab Pe-riod.
Design
A goal of this intervention is to compare performance differences between classes that have learned material through a creative versus a non-creative treatment. Within education, however, there are often many confounding variables (e.g., different over-all ability and learning paces across classes). When we were ready to implement Intervention Two, the students were finishing lessons on variables. We applied the Variable Performance Survey to evaluate if the classes were performing similarly prior to our intervention; if they performed the same, we could meaningfully attribute per-formance differences after our intervention to our treatment. In addition, this was the first time the students had been quizzed on the computer science lab material, lending another important reason we provided this baseline survey experiment.
Results
Our hypothesis was that the different classes would perform similarly on theVariable Survey. After running ANOVA to find the variable performance score variance by lab period, we found a p-value of 0.1973 (see Figure 23). This is not significant, indicating that the scores are not statistically different. However, the Monday-1:55 class does have a lower mean score than the other classes (Figure 22). Although this is not significantly lower, we still discuss solutions to the score differences in the following section.
Threats to Validity
the p-value found, it is an extra precaution we take to address this threat moving forward.
Research Question Concerning Material Validation
The following research question addresses validation of the three efficacy surveys.
Research Question 8: Do our three efficacy surveys (on self-regulated learning, variables, and conditionals) correlate with student performance?
Design
According to Bandura’s guide to creating efficacy surveys, efficacy results should correlate with academic performance [14]. To validate our surveys, we analyzed the correlation between the performance scores with the self-regulated efficacy scores, the variable performance scores with the variable self-efficacy scores, and the conditional performance scores with the conditional self-efficacy scores.
Results
The self-regulated efficacy scores do not correlate with either the variable or con-ditional performance scores. The Pearson Correlation Coefficients are 0.1206 and 0.1806 respectively, which indicate no significance. We also binned efficacy scores into high scores (4-5) and low scores (1-3) to run ANOVA on performance by high or low efficacy; we were unable to reject the null hypothesis that the mean performance scores were the same (as seen in Figure 24). There should be consistency between effi-cacy and academic performance, suggesting that either the survey or our performance quizzes were unreliable.
![Figure 2: Diversity and Gender of Awarded Bachelor’s Degree in Software Engineering, 2016 [7]](https://thumb-us.123doks.com/thumbv2/123dok_us/8213892.2177652/15.918.213.754.649.920/figure-diversity-gender-awarded-bachelor-degree-software-engineering.webp)
![Figure 3: Racial Diversity of Awarded Bachelor’s Degree in Software En- En-gineering, 2016 [7]](https://thumb-us.123doks.com/thumbv2/123dok_us/8213892.2177652/16.918.192.782.189.463/figure-racial-diversity-awarded-bachelor-degree-software-gineering.webp)
![Figure 7: Sample Curriculum [71]](https://thumb-us.123doks.com/thumbv2/123dok_us/8213892.2177652/34.918.161.801.433.865/figure-sample-curriculum.webp)