243
Prevention Program for Young Squash
Players - Impacts on Physical
Performance and Hamstring Injuries
Ahmed Fadhil Farhan
Faculty of Health Sciences, UITM, Malaysia [email protected]
Article Info
Received: March 13, 2014 Accepted: April 14, 2014
Published online: September 01, 2014
ABSTRACT
Hamstring injuries are more common among squash female players compared to male and also, more frequent in youths compared to older players. The aims of the present study were to investigate the effects of a prevention program on physical performance and hamstring injuries in youth female squash players between 16 and 18 years of age. Randomized
controlled trial study. Seventeen girls from local squash club, were randomly assigned to
either an experimental (EXP, n = 9) or control (CON, n = 8) group and assessed at baseline and 8 weeks on isokinetic and isometric strength protocols for the quadriceps and hamstrings, isometric hip adduction and abduction strength, countermovement jump (CMJ), and Illinois agility tests. The intervention is a 15-min program consisting of ten exercises for lower extremity strength, and core muscles, jumps and balance exercises and was performed 5 times a week for 8 weeks in connection with the warm-up before squash training. The control group performed its‟ usual training. There was difference between the intervention and control groups in the change in physical performance from the pre-to post-test for all of the tests used. In addition, the hamstring injuries per 1000 hours of training and playing squash was 5.7 in the intervention group and 7.5 in the control group, which equates to 20% fewer injuries in the intervention group. The greatest effects were observed for mild injuries and injuries incurred during training. An injury prevention program that was performed five times a week in connection with the warm-up was improving squash specific performance and reduces hamstring injuries, especially in youth female squash players.
Keywords: Physical performance, injury prevention, squash, youth, hamstrings injuries.
1. Introduction
244
Unfortunately players get injured during squash play. Many researchers have shown a disparity in injury incidence between male and female soccer players and one of the major injuries, the anterior cruciate ligament injury, is more common among women, particularly teenage girls. Several studies have shown that the incidence of squash injuries can be reduced by adopting various injury prevention strategies including: warm-up, with an emphasis on stretching; proper medical attention for injuries; appropriate recovery methods and time; appropriate cool-down; use of protective equipment; good playing field conditions and adherence to existing rules (Blaser and Aeschlimann, Hawkins and Fuller, 1999).
An exercise program, the Prevention Program (PP), was design to prevent the most common injury types; knee and ankle sprains, hamstring and groin strains. The “PP” is a 10-min program consisting of 6 exercises focusing on core stability, lower extremity strength, balance, agility. The prevention training protocols are designed to not only prevent injuries, but to also increase player performance, this could potentially increase coach and athlete compliance. The main aim of this study was to assess the effect of the “PP” on injury risk and on physical performance variables in young female squash players.
2. Methodology
2.1 Subjects
Seventeen girls (mean ±SD: age 17.2 ± 0.9) from a local squash club. Players were randomly assigned to either an experimental (EXP, n = 9) or a control (CON, n = 8) group. Before the start of the investigation, the 17 players available received written and oral information about the study, and it was emphasized that participation in the „„PP‟‟ was voluntary. Written consent was obtained. The players were screened for injuries using a questionnaire at the start of the study, and they had to be uninjured to be included. Two players had to be excluded because of injury.
2.2 The Prevention Program
245
(Table 1)
Guidelines for Physical Performance of “The PP”
Exercise Name Guidelines
Core stability The bench Balance
Cross-country skiing
Chest pass in single-leg stance Strength
Hamstrings Plyometrics
Jumps over a line (sideways, forwards-backwards) Zigzag shuffle (forwards and backwards)
Hold for 15s each leg X 4 repetitions
15 s X 2 repetitions on each leg 15 s X 3 repetitions on each leg
5 repetitions
15 jumps of each type
2 repetitions in each direction (20 m)
2.3 Physical Tests
After a familiarisation session, participants performed the following tests, before and after a 8 week intervention: 1) isokinetic and isometric strength protocols for the quadriceps and hamstrings; 2) isometric hip adduction and abduction strength; 3) countermovement jump (CMJ); 4) Illinois agility tests. A standardized ten minute football-specific warm-up was conducted prior to each battery of physical tasks. The test battery included four test stations and was completed within 3-4 hours. The tests were conducted in the same order for each player for the pre- and the post-tests. One week before the pre-test, all players participated in a test run to familiarize themselves with the testing procedures. The test run and the pre- and tests were led by the same experienced lab personnel. Pre- and post-tests were performed at the same time of day (16:00 ± 0.4hrs), in the same indoor venue.
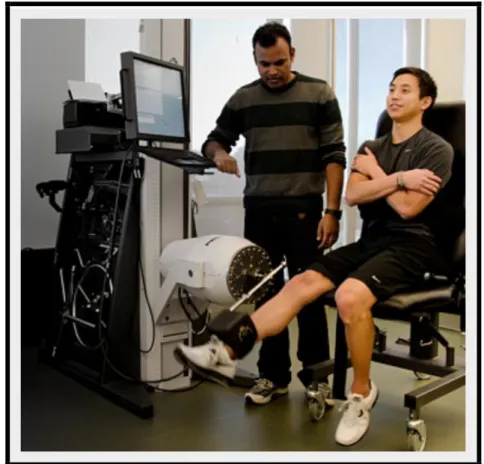
2.3.1 Lower Extremity Isokinetic and Isometric Torque Test
The players warmed up for 5 min on a bicycle with an intensity of 70–100 W. When the players underwent the test run, the dynamometer position, seat position and attachment arm length were recorded to ensure test replication. Straps were used to minimize movements of the torso and the thigh segment of the tested extremity. The arms were held across the
chest. The hip angle was 900. The axis of rotation of the dynamometer was aligned with the
knee joint, and the angular movement of the knee joint was 900. Concentric isokinetic
quadriceps and hamstring torques were measured at a test angular velocity of 60 and 2400/s,
while eccentric isokinetic torque was tested at 600/s only. After four warm-up repetitions, the
246
The quadriceps: hamstring ratio was calculated for all angular velocities for concentric
torque, and for concentric quadriceps torque vs eccentric hamstring torque at 600/s. The
isometric quadriceps and hamstring torques were measured at 300, 600 and 900 of knee
flexion. The players performed a 5-s maximal contraction at each knee flexion angle (Figure 1). Between two contractions at the same angle, the players had a 10-s pause, while they were given a 20-s rest between contractions at different angles. Strength was reported as the peak torque recorded (N m), and the best of three concentric, four eccentric and two isometric repetitions were used in the data analysis.
Figure 1.Lower Extremity Isokinetic and Isometric Torque Test
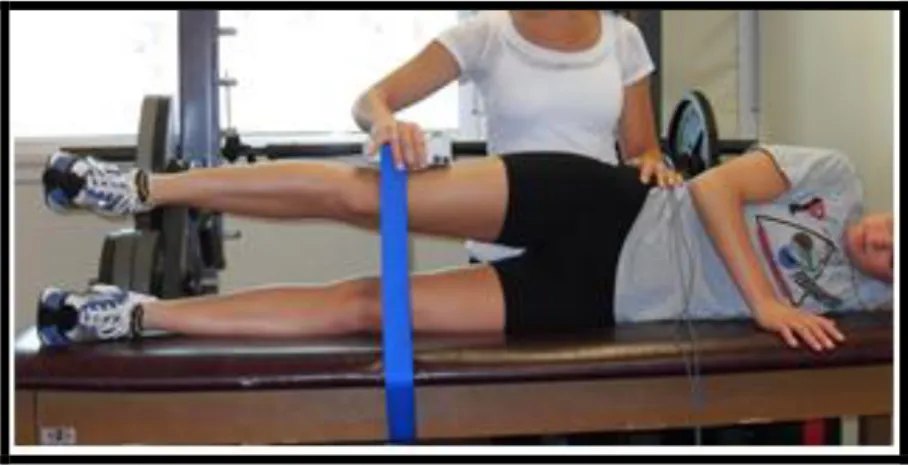
2.3.2 Isometric Hip Strength
Before the isometric strength tests for hip abductors and adductors, the players warmed up for about 5 min using a bicycle at an intensity of 70–100 W. The isometric strength of the adductor and abductor muscles was tested with a handheld dynamometer, similar to Krause et al. (2007). The tests were conducted with the players lying in a supine position on a bench
(Figure 2). For the adductor muscles, tests were conducted with the knee in extended and
247
The dynamometer was positioned 5 cm proximal to the lateral ankle malleolus. The arms were held across the chest during the test. Both legs were tested, with two maximal contractions for each test variable and a 10-s rest period between the two attempts. The highest value for each of the three tests was registered. The dominant leg for each player was recorded in order to analyze the values for the kicking and standing foot, respectively.
Figure 2.Isometric Hip Strength Test
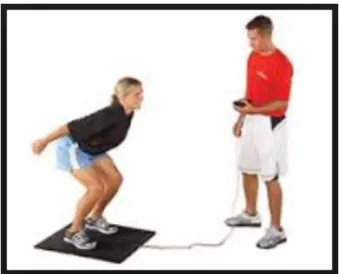
2.3.3 Vertical Jump
Maximum vertical jump height was measured using a maximal double-leg
counter-movement jump, accompanied by an arm swing, using a contact mat system (Figure 3). The
contact mat system measures jump height, flight time and ground contact time and has been shown to demonstrate high reliability (flight time r = 0.95; contact time r = 0.99) when compared to a force platform (Cronin and McLaren, 1999). Participants positioned their feet approximately shoulder width apart on the contact mat before attempting the jump. Steps or run-ups into the jumping action were not permitted and the landing had to occur on the contact mat. Jump height was determined to the nearest 0.1 cm using the following formula:
Jump Height (m) = 0.5 x g (t/2)2 Eq 1
Where g represents acceleration due to gravity (9.81 m·s-1); and t represents the flight time of the jump in seconds.
248
Figure 3.Counter-Movement Jump Test
2.3.4 Agility
Agility was determined using the Illinois agility test (Figure 4). Participants start the test lying face down, with the hands at shoulder level. Times were recorded to the nearest 0.01 s, using the aforementioned timing gate system, and the mean of the best two times recorded. Reliability of this test has been reported to be high, ICC = 0.88 (Gabbett, 2002).
249
2.4 Statistical Analysis
The primary hypothesis, that there would be a difference between groups in the change in performance from pre- to post-tests, was analyzed using unpaired t-tests. The results from pre- and post-tests are reported as means with SD, while the changes within the EXP and CON from pre- to post-tests are given as means with a 95% confidence interval. An intention to- treat analysis was performed including all players who completed the pre- and post-tests, as well as a per-protocol analysis restricted to players who participated in the pre- and post-tests and completed more than 18 training sessions with the „„PP‟‟ The best result obtained in each of the performance tests was used in the statistical analysis. Incidences of injury were
compared by calculating z-values. The level of significance was chosen to be P < 0.05 and all
tests were two-tailed.
3. Results and Discussion
There were significant differences between the EXP and CON group in all of the results on the pre-tests. Maximal concentric, eccentric and isometric hamstring torques were change from pre- to post-test within EXP group, it was a significant increase in isometric quadriceps torque at 90 degree (P<0.01), but there was no significant within the CON group. However, significant differences were observed between groups in the change from pre- to post-test for the hamstring or quadriceps strength tests. In addition, there were significant between-group differences in the quadriceps: hamstring ratio change. P-values for these lower extremity strength variables ranged from 0.01 to 0.02.
Also, isometric hip strength results shown there were significant differences between the EXP and CON group in the change from the pre- to the post-test of the three tests (P<0.01) for kicking foot extended, P<0.03 for kicking foot flexed, (P<0.01) for standing foot). In addition, jumping ability results shown there were significant differences between the EXP and CON group, the analysis showed increase mean jumping performance values in the EXP group for maximal countermovement jump test. The significant between-groups differences in the change from the pre- to the post-test observed (P<0.01) for
countermovement test).Furthermore there was a significant difference between the EXP and
CON group in agility to improve in EXP group from the pre- to the post-test observed
250
(Table 2)
Results from the pre-test (mean ±SD) and change (∆, mean ± 95% CI) from pre- to post-tests within the intervention and control groups, as well as between-group
differences in the change from the pre- to the post-test (∆G, mean ±95% CI).
Variables EXP group (n =9) CON group (n =8) Between-group ∆G (95% CI) Pre-test ∆ Pre-test ∆
Lower extremity isokinetic torque
Qcon 600 S-1 (N m) Qeon 600 S-1 (N m) Qcon 2400 S-1 (N m)
147.0 (11.2) 184.5 (17.3) 95.7 (9.6) 12.8 13.5 15.4 145.6 (13.4) 188.4 (13.8) 97.3 (6.8) 1.4 0.8 -1.6
10.6 (26.1 to 0.8) 12.4 (6.7 to 24.2) 15.2 (5.3 to 22.7)
Lower extremity isometric torque Qiso 30
0 (N m) Qiso 600 (N m) Qiso 90
0 (N m) 97.8 (11.5) 155.9 (23.6) 151.6 (18.5) 11.8 14.3 15.7 99.2 (15.7) 159.4 (12.5) 154.4 (20.7) 0.4 -2.5 -1.8
10.7 (7.3 to 21.8) 14.1 (5.6 to 23.6) 15.5 (8.1 to 20.3) Ratio (Q:H)
Q:Hcon 600 S-1 (%) Q:Heon 600 S-1 (%) Q:Hcon 600 S-1 (%)
59.4 (6.2) 58.6 (3.5) 73.7 (4.1) 10.9 12.3 11.9 61.5 (8.1) 60.7 (8.5) 75.4 (6.2) -4.1 -1.6 -2.3
10.5 (4.3 to 28.5) 11.8 (6.8 to 18.9) 10.7 (3.2 to 16.8)
Isometric hip strength Kicking foot extended (kg) Kicking foot flexed (kg) Standing foot (kg)
14.9 (5.3) 15.4 (2.5) 11.9 (3.7) 16.3 14.7 15.4 15.3 (7.1) 16.1 (4.1) 12.5 (2.3) 0.4 -2.1 -3.5
15.9 (5.3 to 24.7) 13.7 (7.2 to 17.8) 14.8 (4.9 to 28.1) Jumping ability
Countermovement jump (cm) 172.5 (6.4) 10.9 175.1 (3.1) -4.5 9.8 (3.9 to 18.3)
Illinois agility
Agility (sec) 11.22 (0.47) 9.7 10.78 (0.72) -3.7 10.3 (5.7 to 25.2)
251
(Table 3)
Comparison of Exposure Time and Incidence of Injury in the Experimental and the Control Groups
Variable
EXP Group CON Group
(N=9) N (%)
(N=8) N (%)
Injuries 7 (100) 11 (100)
Injured players 5 (21.3) 7 (36.2)
Mean (SD) Mean (SD)
Training hours 8.6 (1.4) 13.5 (3.2)
Match hours 6.2 (3.9) 9.5 (1.6)
Injuries in relation to exposure time
All injuries per 1000 hours of exposure 0.6 0.8 Overuse or training injuries per 1000 training hours 0.2 0.5 Matches injuries per 1000 match hours 0.9 2.1
The number of injured players was 20% lower, and the rate of injury per player was 33% lower. When the incidence of injuries per player per year was analyzed with regard to different grades of severity, circumstances, and location of injury, specific effects of the PP could be demonstrated. Almost all types of injuries were less frequent in the EXP group compared with the CON group. In the control group of the present study, the incidence of injuries, especially of overuse injuries and injuries during training, was higher
The differences were statistically significant for mild injuries, overuse injuries, noncontact injuries, injuries incurred during training, and injuries of the groin. However, even when the incidence of injury was calculated per 1000 hours of training and matches, the EXP group still demonstrated 20% fewer injuries than the CON group The incidence of overuse injuries and injuries during training as related to the amount of time spent in training was 30% lower in the EXP group, and the incidence of match injuries related to the time spent in matches was 20% lower in the EXP group than in the CON group (McLean et al., 2005). The results of the present study clearly indicate that the incidence of soccer injuries in youth amateur squash players can be reduced by a prevention program. This outcome is in agreement with results of previous studies in female high school players.
4. Conclusions
252
References
Blaser, K.U. and Aeschlimann, A. (1992). Unfallverletzungen beim Fußball. Schweizer Zeitschrift für Sportmedizin. 40, 7-11.
Cronin, J. and McLaren, A. (1999). Functional measurement of leg extension musculature: protocols, research and clinical applications. New Zealand Journal of Sports Medicine 27, 40-43.
Gabbett, T.J. (2002). Physiological characteristics of junior and senior rugby league players. British Journal of Sports Medicine 36, 334-339.
Hawkins, R.D. and Fuller, C.W. (1999). A prospective epidemiological study of injuries in four English professional football clubs. British Journal of Sports Medicine. 33, 196-203.
Krause DA, Schlagel SJ, Stember BM, Zoetewey JE, Hollman JH. (2007). Influence of lever arm and stabilization on measures of hip abduction and adduction torque obtained by hand-held dynamometry. Arch Phys Med Rehabil .88: 37– 42.
McLean SG, Walker K, Ford KR, Myer GD, Hewett TE, van den Bogert AJ. (2005). Evaluation of a two dimensional analysis method as a screening and evaluation tool for anterior cruciate ligament injury. Br J Sports Med 39: 355–362.