TidalSim Senior Project Report
Client
Rob Brewster
Advisor
Lynne Slivovsky
Team Members
Kent Zhang: [email protected] Colin VanDervoort: [email protected]
Contributors
Table of Contents
Table of Contents 2
Introduction 3
Project Overview 3
Clients and Community Partners 4
Stakeholders 4
Framed Insights and Opportunities 5
Project Goals and Objectives 7
Project Outcomes and Deliverables 8
Background 10
Formal Product Definition 10
Engineering Requirements 11
Use Cases 14
Design Development 16
Final Detailed Design 22
System Integration, Testing, and Analysis 33
Requirements Met 38
Future Work 39
Management Plan 40
References 42
Introduction
Project Overview
Throughout the course of this project, our team helped the Cal Poly Biological Sciences department refine an intertidal zone simulator. The aim of this device is to allow any marine biologist to easily simulate a vast range of tidal zones in order to test animal behaviors within these zones. Another goal of this project is to make each simulation tank independent from the others by using a single microcontroller to handle all inputs and outputs of the system as well as logging all relevant data. The current system is set up so that a separate microcontroller handles dissolved oxygen and food dosing for all four tanks. One program controller per tank will make experiment setup more straightforward and thus was main goal of the project. Another goal was to make experiment setup data (tide transitions, temps, DO etc) input all in one file in Excel. The current system has some experiment data input through Excel and some that needs to be
Clients and Community Partners
Cal Poly’s biology department performs research on inter-tidal zones on the coast of California. A multidisciplinary team including Rob Brewster has created a tidal simulator at the Cal Poly Pier to aid in this endeavor. Our client, Rob, is an electromechanical engineer who works on repairing and installing scientific equipment for Cal Poly’s biology department. Throughout the years, the tidal simulator has served as an experimentation system to observe and record
biological behavior and reaction to environmental parameters. Dr. Tomanek’s research on climate change and the effect this has on intertidal animals has led the Tidal Sim to continue expanding its capabilities. Today, Tidal Sim has evolved to have a system of Arduino Megas controlling the following:
● Temperature ● Dissolved oxygen ● IR light
● Water level ● Food ● LED lights
These controllers are currently accessed through modifications of the arduino source code and an excel file that is read from an SD card. The sensors currently communicating with the Arduino Megas are the following:
● Dissolved oxygen
● Water and Roboclam temperature ● Ph level
Stakeholders
simulation setup. On a much larger scope, this device would be desirable for any scientist who wishes to do research on an intertidal zone as it will allow them to have very fine control over all the factors that build that zone. Recent changes to the system enable experiments without tide changes or infrared heating, so that non-tidal environments can be simulated as well.
Framed Insights and Opportunities
Figure 1. Current TidalSim dissolved oxygen layout
In our second meeting with Rob, we had a brief overview of the documentation for the tidal simulator. The code for the current design contains several prototyped versions that we were had some confusion about. After Rob’s guidance and walkthrough in the code, we had a better understanding of what each part of the code entails. After being linked to all the code and documentation for the project, we decided careful organization through GitHub was prudent for effective future development. Multiple versions of the TideSim source code were in circulation and we knew that using version control software could streamline our work.
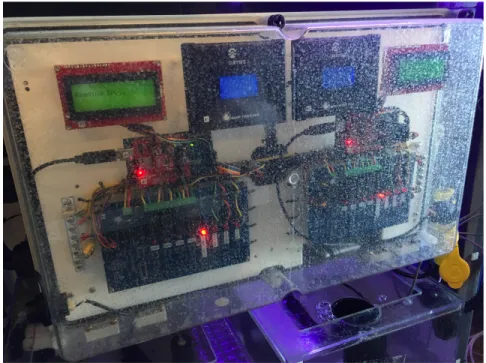
Figure 2. Current TidalSim module (there are 2 TidalSim modules in this picture).
In our third meeting with our client, Rob, we discussed possible hardware parts for a new prototyping/testing rig. We selected the Atlas Scientific Tentacle Shields which can be doubled up on top of the Arduino to connect up to eight different probes/sensors on to one Arduino. Originally we were going to use an Arduino MEGA 2560 and an Arduino Uno on each simulator so that we would have enough GPIO pins to support the original peripherals, but we later
prototype of what we had in mind to display information on our LCD screen. We gained some useful information about what else we needed to display, and learned about a piece of code that was currently used during the tidal transition phase that we plan to reuse.
In one of our later meetings with Rob, we got to meet two scientists who currently work with the TideSim device; Melissa and Alycia. In this meeting we learned what type of information is really important to show on the LCD display, and what information doesn’t need to be shown. This informed our final display layout, and allowed us to show all the relevant information on a single screen.
Client needs:
● LCD interface
● Functional single system stand-alone code
● Single system stand-alone prototype that controls all functions of the project ● Data-logging
Stakeholders needs:
● Device is easy to use and it is relatively simple for anyone to set up an experiment
Project Goals and Objectives
The tidal simulator is currently being used for research, so we aimed to implement some features and improvements. We made large changes to the structure of the software, which required extended amounts of time before being put into the working system. Once the core objective of integrating the system into one microcontroller was completed, there were a number of
accessibility and convenience features we attempted to implement. Goals:
● Create a single, stand-alone device that controls all the required factors for simulating an intertidal zone
● Allow for any non-programmer to easily set up the device in order to simulate any experiment they so desire
● Build the device such that it is easy to tell when and where an error occurred during an experiment
● Fully document the creation of the device to allow for easy replication
Objectives:
● Re-architect the project so each tank is fully controlled by 1 micro-controller
● Create an easy to use UI to set up and run an individual experiment without recompiling the device
● Implement an easy to read display to tell the user everything about the current status of the experiment
● Log real-time data in an easy to read format ● Create a GIT repository to organize project code
○ Utilize issue tracking features on Github
○ Use an effective git branching model to develop features
Project Outcomes and Deliverables
A core goal of this project was to simplify and improve ease of use for the TideSim system. In order to achieve this we consolidated the processing into one Arduino Mega. We also set up the system to read all experiment parameters off of an SD card. This way, the scientists will not have to program any microcontrollers to set up the experiment. Instead, most of the setup occurs in a well-documented process of formatting a SD card and writing a CSV (comma separated values) file to it. The existing system already requires SD card setup in order to input tidal data, so the overall process should be simplified considerably.
Background
We heavily based our current design of the TideSim on the current design that is at the Cal Poly pier. This current design is not ideal as it consists of two seperate microcontrollers that control the variables for a single tank. Most of the control is done by a single controller per tank, but there are two controllers that control factors that influence all four current tanks. We have
removed the need for the extra microcontroller, and are controlling everything for one tank off of a single microcontroller. There are some similar devices that other researchers have developed to simulate tide transitions in a controlled environment [1]. However this device focused on
predicting tide conditions whereas our device will allow the experimenter to define their own tide conditions, as well as temperature, food dosing, and pH of the tank.
Formal Product Definition
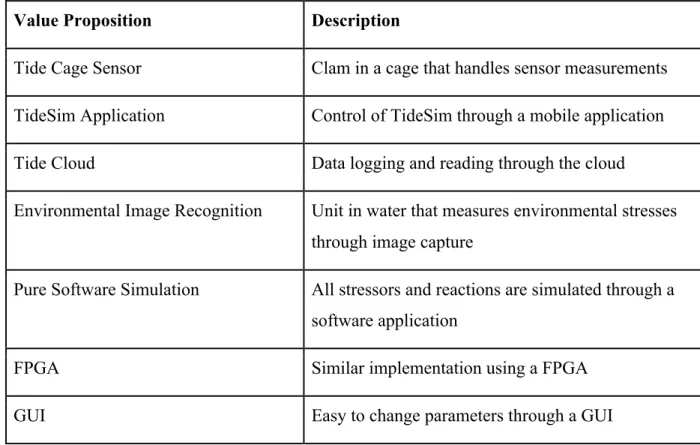
The overall goals for our project includes a stand-alone device that controls all the required factors for simulation of an intertidal zone. In our final design we chose to use a single Arduino MEGA 2560 to control all functionality. We continued to figure out solutions for any non-programmer to easily set up and access the device while changing parameters to simulate their experiment. Current format of changing parameters include using a SD card reader with a provided Excel macro activated template. Full documentation for replication of the product is available. Table 1 shows the result of a brainstorming exercise our group completed in order to come up with some out-of-the-box ideas regarding the tidal simulator.
Value Proposition Description
Tide Cage Sensor Clam in a cage that handles sensor measurements
TideSim Application Control of TideSim through a mobile application
Tide Cloud Data logging and reading through the cloud
Environmental Image Recognition Unit in water that measures environmental stresses through image capture
Pure Software Simulation All stressors and reactions are simulated through a software application
FPGA Similar implementation using a FPGA
GUI Easy to change parameters through a GUI
List of customer requirements:
● Single tank is fully controlled by an Arduino MEGA 2560
● LCD display that displays sensor values and other experimental information ● Easy changeable parameters of experiment read by SD card
● Logging of real-time data into a .csv file
Table 2 illustrates the engineering requirements for our product and includes parameters with their targets/tolerances. The development of choosing our parameters includes thinking about what is measurable and important to our system functionality. Target values include a tolerance of either maximum or minimum and are chosen based on minimum/ maximum of steps, time, and dimensions to be used.
Engineering Requirements
Spec. Number Parameter Description
Requirement/ Target
Tolerance Risk Compliance
1 Experiment Setup Process
5 steps Max Medium T
2 Physical
Dimension
Existing enclosure
Max Low I, S
3 Display Refresh Rate
30 s ± 5 s Low I
5 Water Resistance IP66K Min Low S
6 Sensor Sample Rate
1 s Max Low T
7 Data Logging Rate
1 min Min Low T
8 Time Between Failures
3 months Min High I, T, A
9 Memory Storage 1 GB Min Medium A
10 Chiller Rest Period
15 mins Min Medium T, S
11 Environmental Temperature
110 F Max Low S
12 Environmental Humidity
80 % Max Medium S
We did not intend to add much more hardware, so we aimed to fit all the water-sensitive electronics into the existing waterproof enclosures on the simululators.
Our requirement for IP66K water resistance was put into the table directly, but other
requirements were obtained by breaking down more general client requirements and requests. For example, Rob told us that he wanted the LCD to convey all the information within a reasonably short amount of time, so decided on 30 ± 5 seconds for the amount of time required to cycle through all the screens. This requirement was not hard to meet but it gave us something to design around. Our goal for sensor sampling rate was one second - this allows the Arduino to correct deviations from the experiment parameters quickly and it seemed like a reasonable goal given the clock speed of the Arduino processor. For data logging we wanted a balance between readability of system logs and having sufficient data to troubleshoot if necessary, so we decided to log sensor values every minute. Time between failures is specified as being at least three months, this was derived from the longest experiments being run. Minimum memory storage was calculated based on the maximum anticipated input and output files on the SD card.
Use Cases
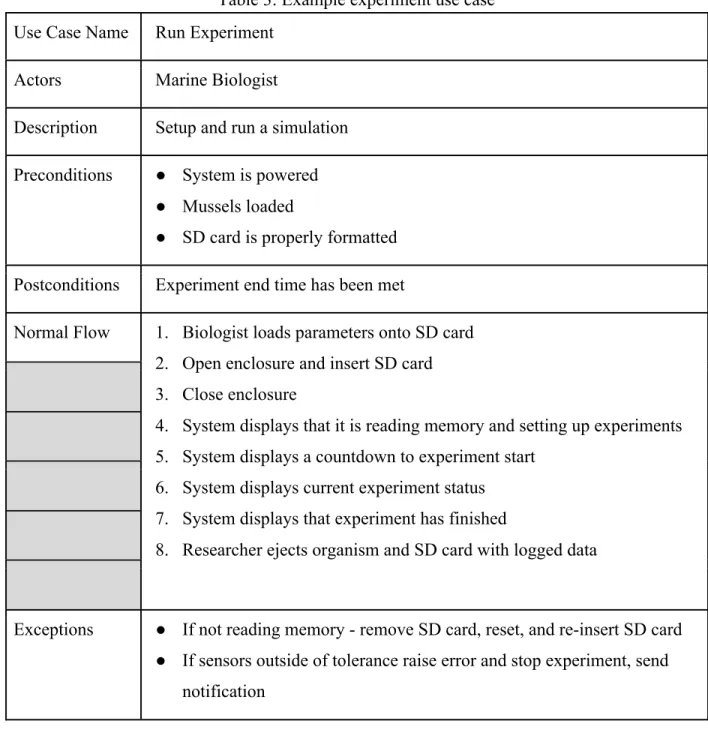
Table 3: Example experiment use case
Use Case Name Run Experiment
Actors Marine Biologist
Description Setup and run a simulation
Preconditions ● System is powered ● Mussels loaded
● SD card is properly formatted
Postconditions Experiment end time has been met
Normal Flow 1. Biologist loads parameters onto SD card 2. Open enclosure and insert SD card 3. Close enclosure
4. System displays that it is reading memory and setting up experiments 5. System displays a countdown to experiment start
6. System displays current experiment status 7. System displays that experiment has finished
8. Researcher ejects organism and SD card with logged data
Exceptions ● If not reading memory - remove SD card, reset, and re-insert SD card ● If sensors outside of tolerance raise error and stop experiment, send
notification
Table 3 shows an experiment use case in which a marine biologist sets up experiment parameters and the system displays sensor values through the LCD. The researcher then retrieves the logged data through the SD card. The tank maintenance use case (figure 3 and table 4) shows a
terms of development required, but it is importance to consider maintenance as well, as it must be done multiple times for each experiment.
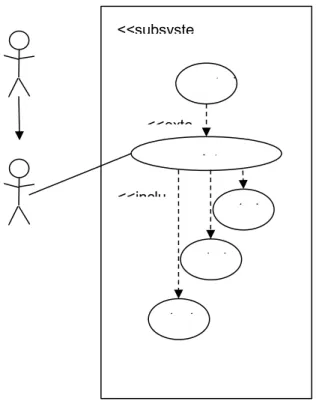
Figure 3: Tank Maintenance Use Case
Table 4: Use Case Diagram/Table
Use Case Name Perform Maintenance on Tank
Actors Technician
Description An agent such as a technician uses the control interface to drain the tanks or change the valve positions, allowing the tank to be cleaned.
Preconditions Not currently running an experiment
Postconditions Default parameters for new experiment met
Normal Flow 1. Set default/maintenance parameters 2. Adjust parameters accordingly 3. Turn off system
<<subsyste
mainten
<<inclu
drai
drai
test control
Exceptions N/A
Assumptions Needs maintenance
Marine Biologist - PERSONA: ❖ Age: 42 years
❖ Gender: Male
❖ Familiar with sophisticated experimentation tools ❖ Affiliated with research institution
❖ Designs and runs experiments ❖ Interested in marine life
❖ Interested in valid and accurate data collection tools ❖ Interested in obtaining reproducible results
❖ Interested in sharing results with scientific community ❖ Environmentally conscious
❖ Ph.D.
Design Development
The first thing that we did was make sure we had a good understanding of how the current system works. This involved going out to the Cal Poly pier and viewing the actual device while Rob and John Gerrity described to us how each part of the tank worked. Once we had an understanding of how the current device worked we moved on to fully understanding the
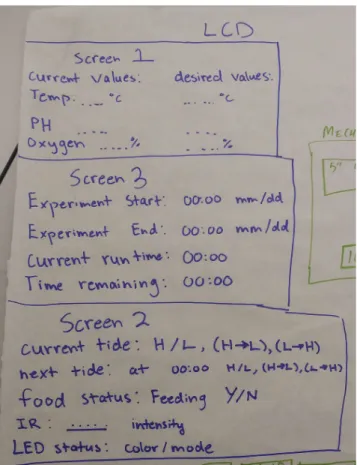
Figure 4. LCD screen layout prototype 1
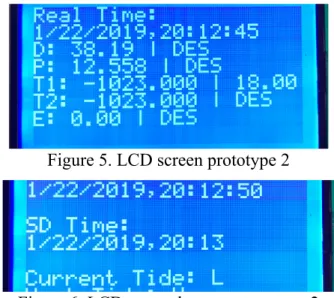
Figure 5. LCD screen prototype 2
Figure 6. LCD second screen prototype 2
Figure 7 displays our beta prototype single screen display. In our final design we decided to switch from using multiple screens to using a single screen so that all the necessary information would be displayed. In this screen, acronyms are used and real time/ SD time are removed to save space on the screen. Having a single screen was preferable to multiple screens because it avoids the scientists having to wait until the screen changes to see the desired information.
Figure 7. Screen prototype 3
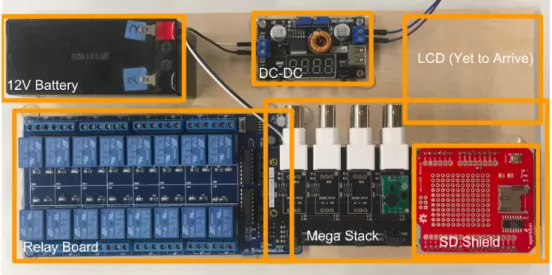
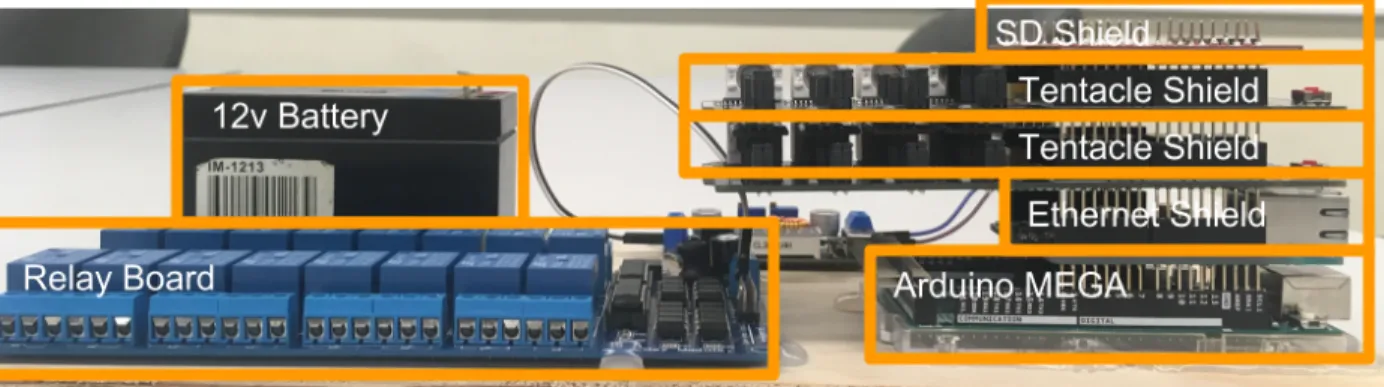
dropped voltage of 5v. Figure 8 also shows the 16 channel relay board which is used to control all the tank valves for controlling the flow of water, as well as the heater and chiller and other peripheral devices used to control tank environment. The side view of this prototype is shown in figure 9. The MEGA stack includes the SD shield, 2 tentacle shields, ethernet shield and the Arduino Mega. Voltages of the controls from the MEGA will be sent to the inputs of the relay board to be sent the controls in the tank. The LCD was not seen in this prototype as it was being shipped.
Figure 8. Prototype Top View
Final Detailed Design
Figure 11 displays TideSim’s system hardware architecture with each individual component communicating with one another. The Arduino Mega stack consists of: the Mega, the SD card shield and RTC, and two tentacle shields on top (modules listed bottom to top). The 12V battery powers the 16 channel relay and the buck converter allows for a step down voltage powering the mega stack and LCD at 7V.
Figure 11. Hardware Architecture
Figure 12 shows the final design layout for the LCD screen. We have decided to use a single screen to present all the relevant data to avoid scientists needing to wait to see relevant information. Acronyms are as follows:
ST [℃]: Set temperature for water in the tank
WT [℃]: Actual water temperature as read from the sensor
IS [℃]: Set temperature for the air (controlled using the Infared Lights) IR [℃]: Actual air temperature as read from the sensor
DOS [mg/L]: Set dissolved oxygen level in the water
DO [mg/L]: Actual dissolved oxygen level as read from the sensor PH [unitless]: Actual pH as read from the sensor
EC [S/m]: Actual electrical conductivity as read from the sensor
The next event shows the time that the next event will happen. Below that are a list of things that are changing, Acronyms for these are as follows:
L: Tide is changing to low tide H: Tide is changing to high tide
FD: Food will be pumped into the tank for a set number of seconds
FSW: Filtered sea water will be pumped into the tank for a set number of minutes
LED: The LED lights will be changing states (if they are on they will turn off and vice versa) PUMP: The PUMP will be changing states (if it is off it will turn on and vice versa)
Figure 13. Top-Level Software Architecture
Figure 13 shows our high level software architecture diagram. There are two main functionalities in the high level architecture, one when the SD card is present in the device, and one when it is removed. When the SD card is present, the software will continuously check if the event has passed, and if so it will process that event and get the next one from the SD card. If the SD card is not present, it will only maintain the current set temperature and DO (or any other set
Figure 14. Heating/cooling flow chart
Figure 15. Top-Level Software Architecture of Excel Macro
Figure 15 shows the flow necessary to complete a tide transition fully in excel. The process is ultimately threefold:
1. Check if any cell in column C (the tide column) has the string “HTL” or “LTH”. 2. Insert the necessary blank rows to satisfy the series of events that completes the tide
transition.
3. Fill those rows with the correct event times and tide (‘H” or “L”) and copy data from other cells (Temp, IR temp etc…)
Figure 16. Wiring Schematic I
Figure 17. Wiring Schematic II
Figure 18. Wave Algorithm Graph (Low to High Transition)
Figure 19. Top View of Final Design Concept
Figure 20. Back Side View of Final Design Concept
Figure 22. Wiring schematic of MQTT system
Figure 22 displays a detailed wiring schematic of the MQTT system connected to the Arduino Mega. The Arduino Mega writes to the ESP32 through serial communications. The ESP32 transmits messages to the Raspberry PI MQTT broker and is then logged to the MQTT mobile application on a phone through wifi. Data is also logged into an external hard drive via USB.
Figure 23 is a theoretical full system architecture if four functional computers connected to tanks were in a fully functional system. Control messages and data logging is sent between the
computers of each system and the Raspberry Pi’s local server.
Figure 24. ESP32 State Machine Diagram
Figure 24 displays a state machine with detailed transitions of the ESP32. This includes set up, usage, and teardown of the connection between the server. Figure 25 displays the server side state machine and the various states of connection/ disconnection.
System Integration, Testing, and Analysis
Table 5. Failure Mode and Effects Analysis
In Table 5 we have identified some of the ways that the system could fail to function as intended, as well as approaches for mitigating the impact of these failures. Most of these failure modes are hard to completely eliminate, but at minimum we have thought of ways to identify their
Table 7. Sensor Data Logging Test
Test Case Name Sensor Data Logging
Requirement Sensor Data is logged every minute
Component MEGA firmware and SD subsystem
Setup Setup experiment on event input CSV with entries that span 1500 minutes
Safety N/A
Procedure Flash current version of MEGA firmware onto the simulator and insert the experiment SD card. After the experiment verify that the sensor log file contains 1500 entries
Pass Criteria Sensor data is logged to the SD card
Expected Results 1,500 lines of sensor data logged successfully
Observed Results 1,500 lines of sensor data logged successfully
Status PASS
Table 8. Event Validation - Tide changes Test
Test Case Name Event Validation - Tide changes
Requirement For every tide change specified in the input CSV, a drain valve relay event is logged in the output CSV
Component MEGA firmware, relay module, and SD subsystem
Setup Create input CSV with 24 events with H and L values for tide alternating
Safety N/A
Procedure Flash current version of MEGA firmware onto the simulator and insert the experiment SD card. After the experiment verify that the sensor log file contains 1500 entries
Pass Criteria All changes from H to L or L to H are logged in event log file
Expected Results 23 drain valve relay events logged
Observed Results 23 drain valve relay events logged
Status PASS
Table 8 displays the final design’s event validation test to make sure the correct valves are open and closing via the relay during an intertidal change. This test involved specifying tide changes in the input excel template and logging if the relay event has happened on the output csv file. Confirmation of relay events were logged and the test passed.
Requirements Met
some agent will still need to recompile every once and a while in order to update the Real Time Clock to the correct value and also to calibrate the sensors.
Future Work
If wireless networking was added then the clock could be updated automatically throughout the course of experiments. Calibrating the sensors is currently done by connecting a PC to the USB port on the Arduino and running a separate calibration program. This calibration program talks to the sensor breakout boards and updates internal calibration values, then the TideSim software is flashed onto the Arduino again. If the calibration program was combined with the TideSim software then scientists could still calibrate the sensors before each experiment without having to reprogram the Arduino multiple times. Another useful feature would be something that would allow the scientists to step through the experiment line by line to ensure that all the events happen as they are supposed to. Finally, to allow for ease of future development we talked about adding debug flags to the arduino code so it will print status messages over the serial port.
MQTT Wireless Data Logging Progress
The system for wireless data logging is almost complete but sending the logs from the Arduino MEGA to the ESP8266 needs to be worked out. The MEGA’s UART transmit buffer is 64 bytes, and the receive buffer on the ESP8266 is also 64 bytes. These buffers are both implemented in the Arduino HardwareSerial libraries. In reality though the MEGA’s hardware UART interface only has a single byte that can be buffered, so note that Serial.write() will block until all bytes have been sent. It may be a good idea to pad the end of all messages sent over UART with zeros, and then read the entire buffer’s worth of data once (Serial1.available() == 64) evaluates to true. Thought needs to be given to the frequency that the MEGA sends logs versus the frequency that the ESP8266 wireless interface reads them from its receive buffer. The ESP8266 must check and read from the buffer much more often, otherwise there is a chance that data will arrive at the ESP8266 and will be discarded due to buffer overflow.
project would have the Raspberry Pi send live updates to a website with the current sensor values instead. As we left the code, control messages can be sent from the phone app to the ESP8266, but we did not actually implement any maintenance features. A website should also be able to have an interface where a credentialed login is able to send these messages.
Management Plan
In order to achieve our mission of developing a comprehensive inter-tidal simulation system, we have outlined our core objectives and assigned team/technical roles. This is a rough outline of our schedule throughout the two quarters of working on this project. During the first quarter of development it was mainly design and hardware implementation. The second quarter consists of mainly testing and software design/implementation. Overall we completed the secondary tasks along the way like documentation. Unfortunately, we did not get the opportunity to run a mock experiment at the pier.
Objectives:
● Have each team member check [email protected] email daily ● Update the client in weekly meetings
● Gather customer/user feedback on the current system ● Communicate effectively
● Ensure that everyone’s ideas are heard
Team Roles:
● Project Manager: Colin VanDervoort ● Procurement: David Lutze
● Secretary: Kent Zhang ● Liaison: Daniel De Leon
Technical Roles:
● Software Architect: David Lutze
● Development Tools Specialist: Colin VanDervoort ● System Interface: Kent Zhang
● Documentation and file organization (Github): Daniel De Leon
Capstone Project Timeline:
Table 9. Project timeline
Date Task 1 Task 2
10/25/18 Finish group charter High level programming architecture
11/1/18 Finalize screen layouts Set up our Git repo
11/8/18 Get devices talking to each other
Organize old code so we know what we are going to reuse
11/15/18 Create a physical test setup Documentation
11/22/18
Read from all sensors at regular
intervals Documentation
11/29/14 Process sensor data/control relays
Implement any old code we decided to reuse
12/6/18 Implement data reading and set up Run a mock experiment
1/10/19
Write code for displaying all vital
information Documentation
1/17/19
Create interface for scientists to define
experiment parameters Documentation
1/24/19 Implement manual maintenance features Documentation
1/31/19
Wiggle room to catch up on any task
unfinished Documentation
2/7/19 Construct a model at the pier Documentation
2/21/19 Implement data logging Documentation
2/28/19 Add additional features Documentation
3/7/19 Log data to a server Documentation
3/14/19 Ensure documentation is sound
Senior Project Timeline:
Date Task 1 Task 2
5/2/19 Add IR ramp from low tide start temp
feature Write tests for old and new stuff
5/9/19 Get broker to send data to phone app Documentation
5/16/19 Get phone to send control messages to
TideSim Documentation
5/23/19 First prototype of data logging client
written for Raspberry Pi Documentation
5/30/19 Leftover work Documentation
6/6/19 Testing Documentation
References
[1] L. Miller and J. Long, "A tide prediction and tide height control system for laboratory mesocosms",
PeerJ, vol. 3, no. 1442, 2015.
[2]A. Dunkels, "Protothreads - Lightweight, Stackless Threads in C", Dunkels.com. [Online]. Available: http://dunkels.com/adam/pt/. [Accessed: 14- Nov- 2018].
[3] https://www.atlas-scientific.com/product_pages/components/tentacle-shield.html [4] LCD Datasheets http://www.vishay.com/docs/37329/37329.pdf
[6] “Documentation.” Eclipse Mosquitto, 2 Jan. 2018, mosquitto.org/documentation/. [7] Eclipse Paho - MQTT and MQTT-SN Software, www.eclipse.org/paho/.
[8] Pelayo, Roland. “Serial Communication with Microcontrollers.” Microcontroller Tutorials,
Microcontroller Tutorials, 8 May 2019, www.teachmemicro.com/microcontroller-serial-communication/. [9] “Wireless Communication between Raspberry Pi's via MQTT Broker/Client.” Raspberry Pi Tutorials, tutorials-raspberrypi.com/raspberry-pi-mqtt-broker-client-wireless-communication/.
[10] Yourself, Tech It. “Demo 14: How to Use MQTT and Arduino ESP32 to Build a Simple Smart Home System.” Demo 14: How to Use MQTT and Arduino ESP32 to Build a Simple Smart Home System ~, 1 Jan. 1970, www.iotsharing.com/2017/05/how-to-use-mqtt-to-build-smart-home-arduino-esp32.html.
Appendices
Table 10. Bill of Materials
NAME LINK QTY
UNIT COST COST
QTY
PURCHASED
Arduino Mega 2560
rev3 https://store.arduino.cc/usa/arduino-mega-2560-rev3 2 38.5 77 0
16 Channel 12V Relay Module
https://www.sainsmart.com/collections/all/products/16-channel-12v-relay-module 2 15.99 31.98 0
EZO pH Circuit
https://www.atlas-scientific.com/product_pages/circuits/ezo_ph.html 1 40 40 0
EZO Dissolved O2 Circuit
https://www.atlas-scientific.com/product_pages/circuits/ezo_do.html 1 46 46 0
EZO Temperature Circuit
https://www.atlas-scientific.com/product_pages/circuits/ezo_rtd.html 2 28 56 0
EZO Conductivity Circuit
https://www.atlas-scientific.com/product_pages/circuits/ezo_ec.html 1 60 60 0
RTC
Tentacle Shield
https://www.atlas-scientific.com/product_pages/components/tentacle-shield.html 2 127 254 0
DC-DC Converter
https://www.amazon.com/DROK-180057-Converter-Step-down-Stabilizer/dp/B07JGSGKR6/ref=sr_1_9?ie=UTF8&qid=15399057
82&sr=8-9&keywords=dc-dc+converter 1 11.99 11.99 0
SD-Card reader
https://www.amazon.com/SparkFun-LYSB01CF50NJA-
ELECTRNCS-microSD-Shield/dp/B01CF50NJA/ref=sr_1_4?ie=UTF8&qid=1539908398
&sr=8-4&keywords=microSD+Shield 1 14.95 14.95 0
0 0
SD card https://www.adafruit.com/product/1294 1 9.95 9.95 0
128x64 LCD
(alternate) https://www.adafruit.com/product/188 1 25 25 0
90 degree pin adapter
https://www.adafruit.com/product/2823?gclid=Cj0KCQiA2o_fBR
C8ARIsAIOyQ-lRs3yWHXeduh_HYOVN0BnBqxyxYPTuOWzV6MjdWswFVF3
dbrRw5aQaArKtEALw_wcB 1 1.5 1.5 0
0 0
0 0
TOTAL
634.5
Table 11. MQTT Senior Project Bill of Materials
Raspberry Pi 3 - Model B+ - 1.4GHz Cortex-A53 with 1GB RAM
https://www.adafruit.com/product/3775?src=raspberr
ypi 1 35 35 1
TXB0104 Bi-Directional Level
Assembled Feather HUZZAH w/ ESP8266 WiFi With
Stacking Headers https://www.adafruit.com/product/3213 1 19.95 19.95 1
KESU
2.5-Inch120GB Portable External Hard Drive USB3.0 SATA 2.5" HDD Storage Compatible for PC, Desktop, Laptop
https://www.amazon.com/Military-Grade- Shockproof-Anti-Pressure-Waterproof-Pocket-Sized/dp/B0761XC45X/ref=sr_1_2_sspa?crid=1S5D 519NCPEU8&keywords=external+hard+drive&qid= 1555633009&refinements=p_n_feature_two_browse
-bin%3A562237011&rnid=562234011&s=electronics
&sprefix=externa%2Celectronics%2C185&sr=1-2-spons&psc=1 1 16.99 16.99 1