Assessment and Instruction: Two Sides of the Same Coin.
Abstract: In this paper we describe our research and development efforts to integrate assessment and instruction in ways that provide immediate feedback to students and meaningful data for our Digital Dashboard for Learning (DDL). The DDL is an instructional tool that collects learning data as students work through online instructional activities, summarizes the data, and displays mean-ingful indicators of students’ progress so that (1) faculty can monitor students’ progress and inter-vene where necessary and (2) students can monitor and adapt their own progress through their learning.
We will review the importance of embedding ongoing formative assessment and feedback into online instructional activities and aligning the student data collected from these activities so that it can be used to inform and modify the learning activities of the students as well as the teaching ac-tivities of the instructor. We will also describe our new assessment platform that enables course de-signers to construct feedback customized to the students’ needs.
Embedding Ongoing Formative Assessment and Feedback into Instructional Activities is Important
Many learning studies have shown that students’ learning improves and their understanding deepens when they are given timely and targeted feedback on their work (Hattie & Timberly, 2007; NRC, 2004.) Reports from the National Science Research Council and others (e.g., NRC, 1996) have recognized the importance of feedback provided through formative assessments as vital to effective learning environments. They describe assessment and instruction as being “two sides of the same coin,” emphasizing that when students engage in assessment activities, they should learn from them. This learning can come in the form of scaffolding and feedback constructed within the assessment activity by the instructor as well as additional scaffolding and feedback provided by the online learning environ-ments in which the students study.
One of the most powerful features of well designed technology-enhanced learning environments is that they enable us to embed ongoing formative assessment and feedback into the instructional activities themselves. In this way, the student not only gets the chance to practice what they are learning but also receives performance feedback that they can immediately use to tune their learning. Similarly productive learning can take place in the classroom when an instructor, while delivering his lecture, asks and responds to questions, observes student body language, and generally gauges whether or not students are “getting it”. Outside the classroom, however, the direct feedback loop between instructor and student is broken. When reading a textbook or using non-interactive material, a student’s questions may go unanswered until the next lecture. Likewise, the instructor may remain unaware of student misconceptions until homework is collected. Online courses provide an opportunity to reconnect this feedback loop and provide student and instructor with richer, more immediate feedback. Figure 1
Figure 1: Feedback loops demonstrating how student learning data informs the stake holders.
By “feedback” we mean information, derived from student interaction, that is used to influence or modify further learning. In the case of feedback to students, we refer to corrections, suggestions and cues tailored to the individual’s performance and that encourage revision and refinement. In the case of feedback to instructors, we refer to aggre-gate reports on student activities and performance through the learning materials. These reports provide the instruc-tor with insight into student performance based on various metrics, such as level of student engagement with the materials, questions they might have, and success rates on formal assessment activities. This information allows the instructor to decide whether more explanation or practice is needed before moving on. It can also guide the content of the next lecture. For example, if it is clear from the feedback reports that most of the class understands point A of tomorrow’s lecture, that point can be briefly covered in favor of spending more time on a more difficult point. Our standard procedure when integrating new tools into courses in our online environment is to perform targeted studies to gage the effectiveness of new approaches. Results from a recent study shows that students not only per-form better from this continual feedback approach, but they can learn the materials more quickly. (Lovett, Meyer, Thille, 2008) We are also collecting a growing body of data indicating student preferences with this kind of interac-tive learning experience. One sampling:
In general on a 4 point likert scale, anywhere between 75%-85% of students respond that they would "defi-nitely recommend taking the course this way" and the remaining 15%- 25% reply that they would "proba-bly recommend" taking the course this way and no one replies that they would "proba"proba-bly not" or "definitely not" recommend.
According to the exit surveys from some of our other online courses, the Economics course and the Statis-tics course do increase the students' interest in the subject matter and provide students with enticing learn-ing opportunities, through problem solvlearn-ing and feedback. In terms of the users' expectations, the data con-firms reports in the educational literature concerning the promises and concerns of online learning. Pro-spective students expect a learning experience that is self-paced, autonomous, and consistent with and adaptable to their particular goals.
Using the Digital Dashboard for Learning(DDL) to Display Student Learning Data
Students generate a staggering volume of data from their interactions with course materials. Yet, instructors have only limited time to analyze learning data. Moreover, despite their deep domain expertise, instructors may lack the learning science background required to make sense of and draw inferences from raw metrics.
For this data to be useful for instructors and students alike, we must aggregate and filter the various performance measures we collect to draw forth the salient features requiring the instructor’s attention. We must then communi-cate these observations in a manner that facilitates effective adaptation of teaching methods to address student needs. It has become apparent to those of us working within our online learning environment that there is a missing tool which is needed to provide this kind of feedback to instructors and students. We are working towards creating this tool, the Digital Dashboard for Learning (DDL) (Brown, W., Lovett, M., Bajzek, D. & Burnette, J. 2006) The DDL can turn the continuous stream of student learning data into dynamic information the instructor can use to shape the delivery of the course and students can use to modify their learning efforts.
We are designing the DDL to process this data in this manner. With this tool we want to provide immediate mean-ingful summaries of the data along with ways to drill down for more detailed information in a clear concise form. To these ends, the DDL must be grounded in solid principles of learning science and iteratively refined by what we learn from the data. We must identify which variables and measures are significant, what feedback is relevant and meaningful to instructors, and how to efficiently communicate findings. We are currently engaged in this area of research. It is an interdisciplinary task involving learning scientists, course designers, content experts, computer sci-entists, human computer interaction specialists, and visual designers.
The current phase of our DDL design process includes:
- improving opportunities for feedback (via rich, embedded authentic assessments, aligned to learning objectives) - structuring and aggregating this enriched data (new assessment software platform)
- designing displays to the data (instructor reports)
Using Embedded Assessment Activities Within Instruction
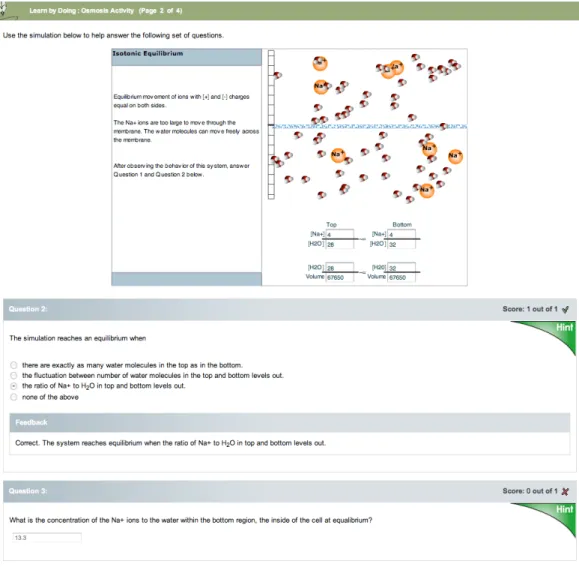
Assessment activities embedded within instruction can take many forms. When they are embedded within online instruction they provide many opportunities for immediate feedback. The example in Figure 2 shows a learn-ing/assessment activity providing a learning object (virtual lab, simulation, tutorial) as a reference as the students move through items within an assessment. Because students pay more attention to questions they believe will end up in the gradebook, integrating these questions within the context of the material they are learning, causes them to think more actively about content they are reading. The very content of the questions, answers, hints and feedback provide additional opportunities for learning.
Figure 2: Example of activity providing the students with a learning object which can be manipulated and explored by the student providing data for analysis and visualization for interpretation. Immediately below are assessment questions requiring the student to articulate what they believe they are learning about the activity. Results of these questions are accumulated and added to feedback reports.
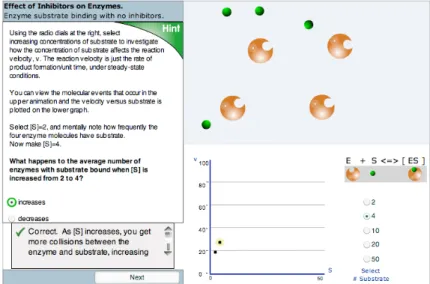
Throughout the activity shown in Figure 3, the text region on the left guides the students through their exploration of the simulation on the right by asking them questions to focus their attention on important features of the simula-tion or data chart. When the students respond, or ask for hints, they are provided with the explicit feedback relevant
to the current state of the activity. Students’ answers to the questions on the left are recorded and can also result in varied behavior of the simulation on the right, which is another form of feedback.
Figure 3: Tightly integrated assessment activities within learning activities guide the students’ exploration.
Constructing Tools for Feedback Authoring, Collection and Reporting
This past year we released a new assessment software platform which provides assessment authors the ability to more tightly integrate content with assessment along with significant flexibility constructing assessments that can target feedback to the students’ particular areas of misconception. Question prompts, hints, and feedback may contain text, images, tables, lists, audio, video, formulae, etc. Additional declarative content can be included alongside questions. The assessment system supports a variety of question types similar to what one might expect to find in current course management systems. However, the difference comes in how they are evaluated. Student responses are flexi-bly evaluated accordingly to criteria specified by the course designer. Rather than provide generic feedback, course designers can target common student misconceptions. This is particularly valuable for questions which solicit open ended responses, such questions expecting a numeric or text response.
Responses are sorted into different groups by matching against different sets of criteria which we call response con-ditions. If the criteria match the response, then the corresponding score and feedback are assigned. Course designers are encouraged to construct response conditions that trap common student errors. Each response condition may be assigned a label or tag which is used to identify the error type in the instructor feedback reports. These labels aid instructors in reading the reports more quickly. Rather than seeing that 30% of students responded ‘17’, a label might inform the instructor that these students added when they should have multiplied. Figure 5 shows another example of how these misconceptions can be labeled.
To identify opportunities for feedback and then create appropriate interactivity, course designers rely upon their teaching experience and domain expertise, examine previous artifacts of instruction, and engage in a process of it-erative refinement driven by student learning data. This degree of sophistication in designing feedback to student responses requires more effort than a single instructor can afford when applied to each assessment question in the course. However, by creating some regularly interspersed assessment activities in this manner, the course designer can provide feedback that students can use to modify their approaches (e.g. they can be shown why they got the question wrong and how they might alter their process in order to get to the correct solution.)
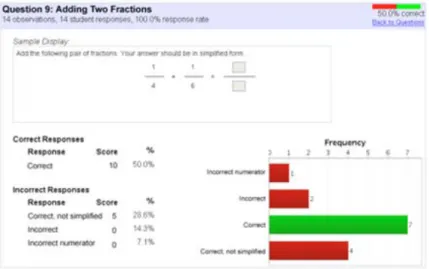
In Figure 4, a question is posed that requires the student to add two fractions together and give their answer in sim-plified form. The author of the problem knows a few common mistakes students make when answering the ques-tion. Students may reach the correct value but not simplify the result, or they may reduce the denominator but not reduce the numerator correctly. Each of these cases are identified by the author and appropriate feedback is given for
each. In this example, the student correctly added the fractions but has not reduced the result. The system matches this case to the appropriate feedback written by the author, and the student is given feedback tailored to their common error.
Figure 4: An example of constructing an assessment question so that the student is given feedback tailored to their common error.
Additionally, the author labels these mistakes so that when the instructor views the performance of their class, rather than simply seeing all of the values entered for numerator and all of the values entered for denominator with a fre-quency, the instructor receives feedback about which categories of mistakes student made Figure 5.
Figure 5: An example of constructing an assessment question so that the student is given feedback tailored to their common error.
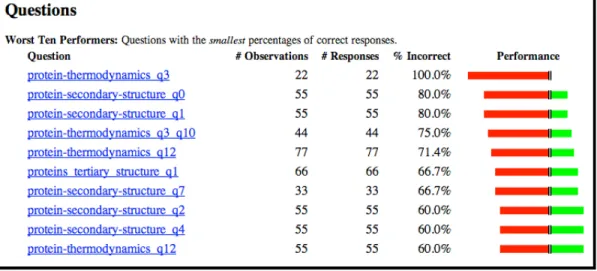
The aggregated assessment results can provide the instructor insight into how well the students are meeting the module objectives. Figure 6 shows the results of an assessment constructed by pulling questions from several pools of questions tagged by concept. The top display of the feedback report, the “Worst Ten Performers” shows that most of the student mistakes came in answering questions about two of the topics. The instructor can click on the question link and view the results of the specific question in a manner similar to the display above in Figure 5.
Summary
Guided by our beliefs that assessment and learning are so interdependent that they really can be viewed as two sides of the same coin, we have been enhancing the content of our online courses with even learning/assessment activities containing ever richer feedback to the students. The richer and more reliable (authentic) the assessment activities embedded into the instruction are, the more useful the information provided by the Digital Dashboard for Learning (DDL) will be and the more students and instructors can learn about the learning that is happening in the course. The goal of the DDL is to provide broad overviews of the students’ performance along various dimensions through simple visual graphics, charts and tables within a web browser. These visual displays should provide at-a-glance analysis while allowing users to drill down to the details. This will help the instructors to monitor students,
visualiz-ing where the class stands in meetvisualiz-ing certain learnvisualiz-ing objectives based on various metrics and where additional in-struction is required. Additionally, students will better understand their own learning achievement in the course. While a long way off from having such a tool in our online environment, we have been reengineering many of the
Figure 6: Summary of the assessment items the students did worst on. The question labels on the left ind cate the
References
Brown, W., Lovett, M., Bajzek, D. & Burnette, J. (2006). Improving the Feedback Cycle to Improve Learning in
Intro-H
N . Washington, DC: National Academy Press.
elements of our current environment so that these tools will use uniform mechanisms for reporting and recording feedback. At the end of this path, we want all parts of our online environment to report their data to the DDL and let standard and instructor designed custom views tie together the data from student activities into meaningful feedback to the students and faculty.
i
topic pool and question. The most frequently missed questions came from the “protein-secondary-structure” and “protein-thermodynamics” pools. Clicking on the link takes the user to the specific question.
ductory Biology Using the Digital Dashboard. In G. Richards (Ed.), Proceedings of World Conference on E-Learning in Corporate, Government, Healthcare, and Higher Education 2006 (pp. 1030-1035). Chesapeake, VA: AACE. attie, J., & Timperley, H. (2007). The power of feedback. Review of Educational Research, 77(1), 81-112. Lovett, M. C., Meyer, O., & Thille, C. (in press). Open Learning Initiative: Testing the accelerated learning
hypothesis in Statistics. Journal of Interactive Media in Eduction. ational Research Council. 1996. National Science Education Standards
National Research Council. (2001). Knowing what students know; The science and design of educational assessment. Washington, DC: National Academy Press.