BY MILES CORAK
CHASING THE SAME DREAM,
CLIMBING DIFFERENT LADDERS:
ECONOMIC MOBILITY IN THE UNITED STATES AND CANADA
P
PEEWW’’SS EECCOONNOOMMIICC MMOOBBIILLIITTYY PPRROOJJEECCTT TTEEAAMM John Morton, Managing Director
Scott Winship, Ph.D., Research Manager Jeremy Ratner, Communications Officer Samantha Lasky, Communications Manager
Erin Currier, Senior Associate Colleen Allen, Specialist
Lindsay Nelson, Administrative Assistant
All Economic Mobility Project (EMP) materials are reviewed by and guided with input from the project’s Advisory Board (see back cover). The views expressed in this report are
those of the authors, and not necessarily those of the institutions they represent, of EMP’s Advisory Board or of The Pew Charitable Trusts.
www.economicmobility.org
the American Dream is kept alive for generations that follow.
A
ACCKKNNOOWWLLEEDDGGEEMMEENNTTSS
Miles Corakis a professor of economics with the Graduate School of Public and International Affairs at the University of Ottawa in Ottawa, Canada.
This research was supported by The Pew Charitable Trusts and, through a Standard Research Grant to Dr. Corak, the Social Sciences Humanities Research Council of Canada. EKOS Research Associates conducted the public opinion poll of economic mobility in Canada. The help of Frank Graves and Angela Scanlon of EKOS is also acknowledged with thanks. The research also benefited from the comments and
suggestions of Scott Winship, Ianna Kachoris, and Erin Currier, as well as Julia Isaacs and other participants at the working conference, Intergenerational Mobility Within and Across Nations, sponsored in part by the Pew Economic Mobility Project
and the Russell Sage Foundation and organized by the Institute for Research on Poverty at the University of Wisconsin-Madison in September 2009. The Economic Mobility Project would also like to thank Daniyal Zuberi, Assistant Professor of Sociology, University of British Columbia, for reviewing
BY MILES CORAK
C O N T E N T S
CLIMBING DIFFERENT LADDERS:
ECONOMIC MOBILITY IN THE UNITED STATES AND CANADA
EXECUTIVE SUMMARY INTRODUCTION
ECONOMIC MOBILITY IN THE UNITED STATES AND CANADA
PUBLIC OPINION ON ECONOMIC MOBILITY AND OPPORTUNITY
CONCLUSIONS NOTES
RESOURCES 2
5 6
10
20 22 24
The United States and Canada have a great deal in common, with histories and cultures shaped by newcomers seeking opportunities and better lives. Yet there are very important differences in social and economic trends on either side of the 49th parallel. In particular, previous analyses of economic mobility in the United States and other industrialized nations reveal that the United States has less, not more, mobility than its northern neighbor. That is, one’s family economic
background is more likely to influence one’s economic outcomes in the United States than in Canada.
Chasing the Same Dreampresents a comparable analysis of economic mobility over a generation, using the best available administrative data from both
countries.i Additionally, it evaluates nationally representative polls conducted in both countries, commissioned by the Pew Economic Mobility Project, to explore whether the differential rates of mobility in the U.S. and Canada reflect
differences in public opinion, values, or underlying societal goals.iiThe report finds the following:
The United States has less economic mobility than Canada as revealed by comparable estimates of earnings mobility across the generations.
• American sons of top-earning fathers are more likely to remain in the top tenth of earners as adults than are Canadian sons (26 percent vs. 18 percent).
• American sons of low-earning fathers are more likely to remain in the bottom tenth of earners as adults than are Canadian sons (22 percent vs. 16 percent).
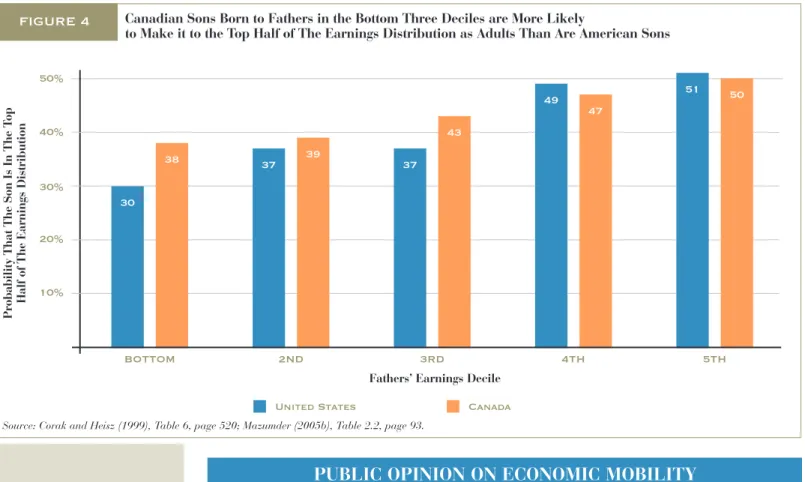
• American sons of fathers in the bottom third of the earnings distribution are less likely to make it to the top half as adults than are sons of low-earning Canadian fathers.
- For example, among sons of fathers in the bottom decile, 30 percent of American sons versus 38 percent of Canadian sons make it to the top half.
CHASING THE SAME DREAM,
CLIMBING DIFFERENT LADDERS:
ECONOMIC MOBILITY IN THE UNITED STATES AND CANADA
E
X
E
C
U
T
I
V
E
S
U
M
M
A
R
Americans and Canadians share similar definitions of the American Dream and “Canadian Dream.”
• Both Americans and Canadians most strongly associate the “American Dream” or the Canadian “good life” with individual freedom and being financially secure.
Americans are more likely than Canadians to think that their children will have a higher standard of living than they have.
• Sixty-two percent of American parents think their children will have higher living standards than they have, compared to just 47 percent of Canadian parents.
Both Americans and Canadians feel strongly that individual characteristics outweigh external factors in determining economic mobility.
• The most common factors that both populations indicated were essential or very important to experiencing economic mobility refer to personal attributes, including a strong work ethic, ambition, and a good
education.
• External factors that are not in an individual’s control, like the economy and family background, were ranked as less important.
Americans and Canadians have similar attitudes toward equality of outcomes and equality of opportunities as public policy priorities.
• Seventy-one percent of Americans and 68 percent of Canadians said that it was more important to ensure that everyone has a fair chance of improving their economic standing, while only 21 and 26 percent, respectively, said it was more important to reduce inequality. • Exactly the same majority of respondents in the two countries—53
percent—suggested that the difficulty in moving upward for those born at the bottom was a major problem. A much smaller proportion—17 percent in the United States and 12 percent in Canada—suggested that the persistence in status of those born to the top was a major problem.
E
X
E
C
U
T
I
V
E
S
U
M
M
A
R
Americans are less likely than Canadians to believe that parents’ economic resources affect children’s opportunities.
• While economic mobility is more tied to parental income in the United States than in Canada, Americans are less likely than Canadians to think that their financial success is linked to their parents’ income.
- Only 42 percent of Americans believe that chances for financial success are related to parental income, compared to 57 percent of Canadians.
Americans are less likely to view current government policies as helpful in promoting upward economic mobility. At the same time, Americans are more likely to suggest the government enact a range of policies to promote economic mobility.
• Forty-six percent of Canadians feel that government does more to help than to hurt its citizens’ economic mobility, compared to 36 percent of Americans, while 46 percent of Americans feel government does more to hurt economic mobility versus 39 percent of Canadians.
• However, when presented with a range of policies the government could take to improve economic mobility, Americans are more likely than their Canadian counterparts to say that various policy options could be “very effective” in promoting economic mobility.
- In both countries, the top three policy choices that respondents thought would be very effective were “keeping jobs in America/Canada,” “making college more affordable,” and “reducing crime.”
The differences in attitudes toward specific government interventions may reflect differences in satisfaction with what each of the governments are doing, rather than different values underlying the legitimacy of government
involvement. For example, two-thirds of Americans suggest that a reduction in health care costs would be very effective at promoting economic mobility, while only one-third of Canadians feel the same way.
iAmerican fathers’ earnings were measured from 1970 to 1985. Their sons’ earnings were measured
from 1995 to 1998, when they were age 27 to 35. Canadian fathers’ earnings were measured from 1978 to 1982. Their sons’ earnings were measured from 1993 to 1995, when they were 27 to 32 years old.
iiThe surveys were conducted in the U.S. in January and February 2009 and in Canada in August and
September 2009.
E
X
E
C
U
T
I
V
E
S
U
M
M
A
R
CHASING THE SAME DREAM,
CLIMBING DIFFERENT LADDERS:
ECONOMIC MOBILITY IN THE UNITED STATES AND CANADA
INTRODUCTION
The United States and Canada have a good deal in common, making them arguably the two most similar countries in the Organisation for Economic Co-operation and Development (OECD). Not least of these similarities is a common perspective that informs and defines the self-image and social goals of their citizens, whose histories and cultures have been shaped by newcomers seeking opportunities and better lives. The idea of “equality of opportunity,” in which inherited aspects of family background play a secondary role to individual motivation, talents, and energy in determining economic success is an important part of this common heritage and makes “land of opportunity” a common defining metaphor.
Yet there are very important differences in social and economic outcomes on the two sides of the 49th parallel.1The United States is richer, with a per capita
income nearly 20 percent higher than Canada’s—but the distribution of income is more unequal.2 Households ranking at the top decile of the American income
distribution have almost six times as much as those at the bottom decile, a ratio that is the third highest among 30 OECD countries. In Canada, this ratio is just over four, essentially at the OECD average and 18th among the 30 countries.3
This report addresses another difference that has been recently uncovered: that economic mobility across the generations—the tie between family economic background and the adult economic outcomes of children—is not the same between these countries. A general consensus has developed among researchers that Canadians are more likely to experience relative mobility of earnings across the generations than are Americans. That is, on average, Americans are much more likely to occupy the same place on the earnings ladder as their parents did a generation earlier than are Canadians.
The report summarizes and documents the degree of intergenerational economic mobility in these two countries. It suggests that observed mobility differences are not due to differences in measurement, analytical methods, or underlying data instruments. Rather, they reflect the fact that family background is more strongly related to the adult outcomes of children (that intergenerational
mobility is lower) at the very top and the very bottom of the earnings ladder in the United States than in Canada.
Further, using comparable public opinion polls conducted in the United States and Canada about perceptions of economic mobility and opportunity, this report investigates the extent to which Canadian values, and the meaning of the social goals they underlie, explain the different rates of mobility between these two countries. An appreciation of differences in the social goals important to the citizens of these societies is essential for understanding differences in economic institutions and public policies that may influence economic mobility. It may well be that the citizens of these two countries are simply chasing different dreams.
The report finds that this is, in fact, not the case. Mobility differences between the countries cannot be characterized as being the result of fundamentally different values over the meaning of equality of opportunity and hence, different social choices that in some sense are optimal for each country. The citizens of both countries have a very similar sense of the meaning of a good and successful life, one that is rooted in individual aspirations and freedom. They also have similar views on how these goals should be attained, with individual attributes like hard work and human capital accumulation being central.
However, there is an important exception. Americans are less likely to view government policies as helpful in achieving upward economic mobility, but they are more likely to suggest that a range of policies to promote mobility would be effective. This comparative analysis suggests that American opinions about economic mobility may reflect concerns that public policy has left unaddressed or at best, a view that current policies are not as effective as they might be.
ECONOMIC MOBILITY IN THE UNITED STATES AND CANADA
The United States has less relative mobility than Canada as revealed by comparable estimates of earnings mobility across the generations
The strength of the tie between parental earnings and the earnings their children ultimately attain in adulthood offers an overall indicator of the degree to which economic advantage and disadvantage are transmitted across the generations.4
A set of internationally comparable estimates of this cross-generational link drawn from previous research recognizing differences in study designs is offered in Figure 1. These estimates are not meant to be definitive for each country, but
rather, as the best estimates suitable for international comparisons. Further, they refer exclusively to the relationship between father and son earnings, as the literature on both parents and on daughters is still too sparse for analysis. The mobility indicator used is the “intergenerational elasticity,” a measure of how closely related a child’s and a parent’s rank are on the income ladder. The higher the elasticity, the more similar their position in their own distribution.
The United States is among the least mobile countries in this group, Canada among the most. The literature upon which these findings are based could reasonably suggest a range of elasticity estimates for the United States of between 0.40 at the low end to 0.52 at the upper end. However, this is still outside a comparable set of bounds for Canada, which range from 0.16 to 0.21.5
The elasticity estimates imply that less than one-fifth of an earnings advantage is passed on across the generations in Canada, compared to about one-half or more in the United States.
FIGURE 1
Comparable Estimates of the Intergenerational Elasticity of Earnings between Fathers and Sons
Note: The higher the intergenerational elasticity of earnings, the more highly correlated one’s income is with that of one’s parents. Source: Adapted and updated with information for Italy, Spain, and Australia from Corak (2006), Table 1.
0.1 0.2 0.3 0.4 0.5 0.6
0.5
UNITED KINGDOM
0.48
ITALY
0.47
UNITED STATES
0.41
FRANCE
0.4
SPAIN
0.32
GERMANY
0.27
SWEDEN
0.26
AUSTRALIA
0.19
CANADA
0.18
FINLAND
0.17
NORWAY
0.15
A more definitive estimate of the intergenerational elasticity in father-son earnings for the United States is offered by research based on the best available data, which involves a linkage between survey and administrative data on earnings.6 This research yields an estimate of the intergenerational elasticity of
earnings between fathers and sons as high as 0.613.7 The nature of the data
and the age cohorts used in this study make it directly comparable to a second study based on earnings data from the Canadian income tax system, which yields an intergenerational elasticity estimate of 0.23.8
On this basis, the difference in the degree of relative intergenerational mobility is higher than suggested by Figure 1, being about three times as great in Canada as in the United States.9 Just as importantly, however, these two studies are
based on sufficiently large sample sizes to permit analyses of differences in mobility at different points in the parental earnings distribution.
Lower mobility in the United States is due to more “stickiness” at the top and bottom of the earnings distribution than in Canada.
These large differences in average mobility are due to differences at the extremes of the distribution, as summarized in Figures 2 and 3, for sons born,
respectively, to top-decile and bottom-decile fathers. In other words, there is a greater tendency for American children starting out at the bottom to remain “stuck” there as adults than there is in Canada and a greater tendency for children at the top to remain there in adulthood.
FIGURE 2
United States Canada
25%
20%
15%
10%
5%
BOTTOM 2ND 3RD 4TH 5TH 6TH 7TH 8TH 9TH TOP
3
8
.4 8
7
.8
6 7.6 7 7.5 7 8
.2 5 8 .7 1 0 9 .6 1 6 1 1
.2 11 13
.2
2
6
1
8
Source: Corak and Heisz (1999), Table 6, p. 520; Mazumder (2005b), Table 2.2, p. 93.
Son’s Earnings Decile
P er ce n t o f S o n s in E a rn in gs D ec il e
American Sons of Top-Earning Fathers are More Likely to Remain in the Top Decile Than Canadian Sons
Of the American sons born to fathers whose earnings place them among the top ten percent of earners in their distribution, over one-quarter (26 percent) grow up to be adults who are also in the top ten percent of their earnings distribution. In Canada, this proportion is 18 percent. It is also notable that sons of top-decile fathers are more likely to drop to the very bottom of their earnings distribution in Canada than in the United States, where eight percent find themselves in the bottom, compared to just three percent.
Just as downward mobility is less likely in the United States, so is upward mobility. Twenty-two percent of sons born to bottom-decile American fathers remain in the bottom as adults, and a further 18 percent only move up one decile (see Figure 3). In Canada, 16 percent (15.8) remain in the bottom, and 14 percent move up only one decile. Though sons of these low-earning fathers are equally likely to make it to the very top of the earnings distribution in the two countries, on the whole, Americans are less likely to move to the top third.
FIGURE 3 American Sons of Low-Earning Fathers Are Also More Likely to Also Have Low Earnings Than Their Candian Counterparts
Earnings decile of sons born to bottom-decile fathers
United States Canada
25%
20%
15%
10%
5%
BOTTOM 2ND 3RD 4TH 5TH 6TH 7TH 8TH 9TH TOP
2 2 1 5 .8 1 8 1 3 .7 1
0 11.7
1
0 11 11
9 .7 1 1 8 .7 5 8 .3 5 7
.4 7 7
6
.9
2
Source: Corak and Heisz (1999), Table 6, page 520; Mazumder (2005b), Table 2.2, page 93.
Son’s Earnings Decile
P er ce n t o f S o n s in E a rn in gs D ec il e
Figure 4 summarizes the extent of upward mobility in these countries by contrasting the chances that a son born to a father in the bottom half of the earnings distribution will move to the top half. While the chances of this
happening for those born to fathers just below the median, in the fourth or fifth deciles, are similar in the two countries—around 50 percent for an upward movement of one or two deciles—they are noticeably higher in Canada at lower deciles. The probability that a bottom-decile Canadian son will have adult earnings placing him in the top half of his earnings distribution is 0.38, but for a comparable American, this is 0.30. In fact, a son raised in the bottom decile in Canada has about the same chances of reaching the top half of the earnings distribution as a third-decile son in the United States.
PUBLIC OPINION ON ECONOMIC MOBILITY AND OPPORTUNITY
While these differences in intergenerational economic mobility are significant, both in a substantive and a statistical sense, they do not necessarily imply differences in equality of opportunity.10 Children resemble their parents for all
kinds of reasons, and if the labor market values these characteristics in the same way through time there will be intergenerational correlation in outcomes. At the same time, societies may well differ in their views on the extent to which these parent-child similarities represent inequalities of opportunity.
FIGURE 4 Canadian Sons Born to Fathers in the Bottom Three Deciles are More Likely
to Make it to the Top Half of The Earnings Distribution as Adults Than Are American Sons
United States Canada
50% 40% 30% 20% 10% 5TH 51 50 4TH 49 47 3RD 37 43 2ND 37 39 BOTTOM 30 38
Fathers’ Earnings Decile
P ro b a b il it y T h a t T h e S o n I s In T h e T o p H a lf o f T h e E a rn in gs D is tr ib u ti o n
The existing differences between the United States and Canada could very well be optimal for each country, reflecting underlying values and the social choices that respect them. In other words, societies may legitimately make different choices concerning the extent to which parent-child correlations in outcomes are in accord with a level playing field. Different sets of values will lead to different views on the role for public intervention and differences in the way that
governments provide goods that compensate or substitute for parental and familial investments. Canadians may care more about equality of outcomes than Americans or be less concerned if government intervenes in the lives of families to promote equality of this sort.
As such, policymakers should be cautious in drawing implications from observed differences in economic mobility. Policy recommendations cannot be drawn from these sorts of cross-country comparisons without additional
information on social values that give meaning to “equality of opportunity” and define the legitimate methods to attain it.
For this reason, the analysis includes findings from two public opinion polls that address a host of issues related to economic mobility and equality of
opportunity. The first poll was conducted for the Economic Mobility Project by Greenberg Quinlan Rosner Research and Public Opinion Strategies in late January and early February of 2009; the second poll adapted this questionnaire to Canada and was put into the field in late August and early September of the same year by EKOS Research Associates.11
The following discussion focuses on just three aspects of these polls: (1) a definition of the “American Dream” and its association with economic mobility; (2) a statement of perspectives on the factors that influence economic mobility; and (3) a description of concerns about inequality, equality of opportunity, and the role of public policy.
Canadians describe the dream of a good life in the same way that Americans define the American Dream.
In the United States, respondents were asked to define the American Dream by responding to and rating a series of statements about what the term means to them. In Canada, the following question was asked, with the same options as given in the U.S. survey:
Americans often talk about attaining the American Dream to describe what it means to have a good life in their country. This means different things to different people. Here are some ways some Americans have described what the
accurately each statement describes what you would consider the Canadian Dream to be. One would mean the statement does not describe what it means at all. A ten would mean the statement describes it perfectly.
Canadian and American responses to this question were very similar, indeed, statistically speaking, essentially identical and are presented in Figure 5.12The
figure presents the proportion of the sample answering eight or higher on a ten-point scale (the higher the rating, the more accurately it describes the American or Canadian Dream).
FIGURE 5 Defining the American Dream in the United States and Canada: Percent Responding Eight or Higher on a Ten-Point Scale
10% 20% 30% 40% 50% 60% 70% 80% 90% 100%
74 72
BEING FREE TO ACCOMPLISH ANYTHING WITH HARD WORK
68 73
FREE TO SAY OR DO WHAT YOU WANT
64 57
CHILDREN BEING BETTER OFF FINANCIALLY THAN YOU
61 65
BEING FINANCIALLY SECURE
60 59
SUCCEED REGARDLESS OF BACKGROUND
60 63
OWNING A HOUSE
55 54
GETTING A COLLEGE DEGREE
48 59
ENOUGH INCOME TO AFFORD A FEW LUXURIES
48 43
GETTING MARRIED, HAVING KIDS
40 29
OWNING YOUR OWN BUSINESS
33 31
BECOMING RICH
31 35
BEING MIDDLE CLASS
United States Canada
Americans and Canadians have, for the most part, the very same ranking of these alternatives and indeed, in very much to the same degree. The two options garnering the greatest consensus, in the neighborhood of 70 percent, refer to aspects of individual freedom. Aspects of financial security follow next, with about 60 percent of the samples giving the financial welfare of children, financially security, and homeownership a score of eight or higher out of ten. Canadians differ from Americans in being somewhat more content with being able to afford a few luxuries and less inclined to feel strongly about owning a business. But the general message from this information is that there are no strong underlying differences in what the good life means, and most
importantly, it is associated with individual freedoms.
Americans and Canadians are equally optimistic about their own and their children’s chances for economic mobility, but Americans have higher hopes for their children’s living standards.
Not only did respondents from the two countries define the good life in similar terms, but American and Canadian parents had very similar views about how difficult it was for them, and would be for their children, to achieve that end.
In both countries, parents were more pessimistic than optimistic about prospects for their children to achieve the American Dream or “a good life.” In Canada, 42 percent thought it would be easier for their children than it was for them versus 49 percent who said harder. In the United States, the split was 45/52. In both countries, parents split evenly as to whether it would be easier or harder for their children to “move up the income ladder.”
Where the two countries differ is that Americans are much more likely than Canadians to think that their children will have higher living standards than they have (62 percent vs. 47 percent). The difference lies in the fact that Americans are more optimistic that their children will have higher living standards than they are about their children’s ease of moving up the income ladder, while Canadians make no such distinction. On the other hand, the difference between the share of Americans and the share of Canadians thinking that their children’s living standards will be worse(as opposed to the same or better), is just seven percentage points.
Citizens from the two countries had very similar assessments of how common it is for people to work their way up from the bottom and are equally likely to think their own living standards were higher than those of their
parents. Canadians were a bit more likely than Americans to say it is easier to move up the income ladder than in their parents’ generation (64 percent vs. 56
In both countries, strong majorities believed that their own economic
circumstances would be improved in ten years (72 percent in the United States vs. 67 percent in Canada). Four in five Americans and Canadians believed that it is still possible to improve one’s economic standing despite the recession, but 56 percent of Americans felt strongly about that belief, compared with 47 percent of Canadians.
The difference in economic conditions at the time of polling (January/February in the United States, August/September in Canada) makes it difficult to
compare the American and Canadian orientations toward mobility prospects. The higher unemployment rates in late summer, when the Canadian poll was conducted, could mean that Americans were more optimistic earlier in the year than they were in late summer and that polls conducted at the same time would show Canadians as more optimistic than Americans.13
Americans and Canadians feel strongly that individual characteristics outweigh external factors in determining economic mobility.
Both Americans and Canadians feel strongly that individual characteristics and choices, like hard work, ambition, and human capital accumulation, lead to upward economic mobility. In both countries, factors external to the individual, outside of his or her control, rank much lower.
The survey asked respondents in both countries to consider the extent to which as many as 16 different factors contributed to a person’s economic mobility. The possible responses included: essential to mobility, very important, somewhat important, not very important, and not important at all.
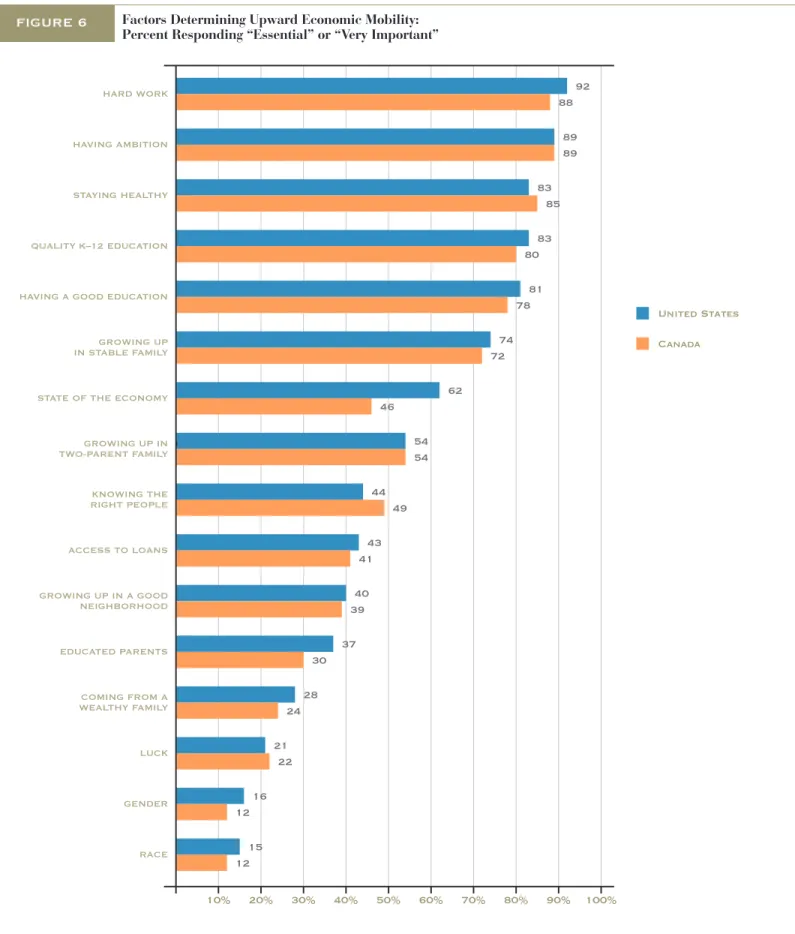
Figure 6 displays the proportion of respondents reporting the factor in question to be essential or very important to upward mobility. Only five of the 16 items garner this level of support from at least three-quarters of respondents in both countries. The ranking is the same in both, and each of the five items refer to individual attributes related to effort or human capital formation: hard work, having ambition, staying healthy, quality education kindergarten to grade 12, and, more generally, having a good education. “Growing up in a stable family” is also highly cited, with over 70 percent of respondents considering it an essential or important factor in determining economic mobility.
Other factors that are, to varying degrees, outside of the individual’s control receive less support, though when these refer to aspects of family background and individual characteristics like race and gender, respondents in the United States are more likely to consider them essential or very important. Having
FIGURE 6 Factors Determining Upward Economic Mobility: Percent Responding “Essential” or “Very Important”
10% 20% 30% 40% 50% 60% 70% 80% 90% 100%
92 88
HARD WORK
89 89
HAVING AMBITION
83 85
STAYING HEALTHY
83 80
QUALITY K–12 EDUCATION
81 78
HAVING A GOOD EDUCATION
74 72
GROWING UP IN STABLE FAMILY
62 46
STATE OF THE ECONOMY
54 54
GROWING UP IN TWO-PARENT FAMILY
44 49
KNOWING THE RIGHT PEOPLE
43 41
ACCESS TO LOANS
40 39
GROWING UP IN A GOOD NEIGHBORHOOD
37 30
EDUCATED PARENTS
28 24
COMING FROM A WEALTHY FAMILY
21 22
LUCK
16 12
GENDER
15 12
RACE
United States Canada
educated parents, coming from a wealthy family, gender, and race all rank among the lowest in the entire list but with more Americans than Canadians citing them.14
In both the United States and Canada, solid majorities of respondents strongly believe that individual factors are more important than outside factors in affecting mobility (65 percent in the United States and 57 percent in Canada). In the United States, 74 percent of respondents said they were “very much” or “somewhat” in control of their personal economic situation, compared with 83 percent in Canada.
In choosing explanations for downward mobility, three stood out in both countries: poor life choices, excessive debt, and low education, each of which reflects an element of individual responsibility. The overall economy and the cost of living were cited by far fewer respondents.
Similarly sized majorities in both countries believe that all of their compatriots have a fair shot at moving up the income ladder (55 to 60 percent). In
additional questions asked in the Canadian survey, more than four in five respondents espoused meritocratic principles, such as the right of hard workers to make more than others, the entitlement of people to their earnings, the
fairness of inequality if there is equal opportunity, and the limited role played by luck in determining economic outcomes.
While Americans and Canadians are both inclined toward individualistic explanations for success or failure, one key difference on this question was apparent. While only 42 percent of Americans believe that chances for financial success are tied to parental income, 57 percent of Canadians do. Three in ten Americans stronglydisagree that financial success is tied to parental income, compared with just 17 percent of Canadians.
Strong majorities in both countries support equality of opportunities over equality of outcomes.
In responding to the question “What do you think is more important for this country: to reduce inequality, or to ensure everyone has a fair chance of
improving their economic standing?” 71 percent of Americans and 68 percent of Canadians cited ensuring a fair chance, while respectively only 21 percent and 26 percent cited reducing inequality.
Respondents were also presented with a series of facts about the degree of economic mobility drawn from the academic literature, including most notably
the facts about the degree of mobility at the top and bottom of the earnings distribution described in Figures 2 and 3. The question was stated as follows:
I am going to read you some facts about economic mobility in this country. After each one I read, please tell me whether you believe this represents a major problem for this country, a minor problem, not much of a problem, or no problem at all:
• About 40 percent of Americans/one-third of Canadians who are born to
parents at the bottom of the income ladder are still there as adults.
• More than 30 percent of children who are born to parents at the top of the
income ladder are still there as adults.
Exactly the same majority of respondents in the two countries—53 percent— suggested that the difficulties in moving upward for those born at the bottom was a major problem, while a much smaller proportion—17 percent in the United States and 12 percent in Canada—suggested that the persistence in status of those born to the top was a major problem.
Americans are more likely than Canadians to see government as hindering rather than helping to promote economic mobility, but this doesn’t mean they are more anti-government.
A notable difference between the two countries concerns the role of government as a means to influence economic mobility. When asked if the government does more to help or more to hurt people trying to move up the economic ladder, respondents in both countries lacked strong proclivities. However, 46 percent of Canadians feel that government does more to help than to hurt, compared to 36 percent of Americans. On the other hand, 46 percent of Americans feel
government does more to hurt versus 39 percent of Canadians.15The difference
in the responses to this question was among the largest of all questions asked.16
Does this mean Americans are more anti-government than Canadians? Both Americans and Canadians have a strong belief that to some significant degree, individuals—through their own energy, talents, and education—determine their chances of success in life and, in particular, their prospects for upward mobility. At first look, it is reasonable to suggest that a strong sense of individual
responsibility, in both defining what it means to get ahead in life and in the way to achieve it, gives limited support for government involvement.
But the conclusion that “Americans’ strong emphasis on individual responsibility in determining economic mobility informs their understanding of government’s role,” which might reasonably be reached by looking solely at the American
polling results, does not entirely capture the full picture.17The comparative
analysis presented here suggests these findings should not simply be interpreted as meaning that a strong sense of the individual implies a diminished role for public policy. Canadians emphasize individual responsibility to the same degree, yet feel the government is more likely to support than to hinder the individual. American attitudes could reflect, and be based upon, actual experience with government programs—their design and implementation and a mismatch between the goals that they are ultimately addressing and those citizens would prefer—rather than an inherent aversion to government involvement.
In other words, the cross-country comparison raises the possibility that the American view of government doing more to hurt than to help economic mobility is less a reflection of a belief as to what government should do, as it is an assessment of what it actually does. After all, the American survey also points out that respondents believe there are effective steps government could
undertake to improve economic mobility. These are illustrated in Figure 7, which shows that Americans are in fact more likely than Canadians to say— across the entire range of options put to them—that a particular intervention would be very effective in promoting economic mobility.18
The two most popular policies in both countries were measures to “keep jobs” in the country and increasing college affordability. Similarly, reducing crime and drugs ranked third in both countries. In the United States, however, reducing health care costs was also in this top tier of policy preferences, while it ranked toward the bottom among Canadians. Promoting marriage and welfare reform were relatively unpopular policies in both countries.
Two of these options—cutting taxes and cutting taxes for middle income
families—imply a smaller presence for government. These options are said to be very effective by a small majority of Americans but by a minority of Canadians. This difference could reflect a greater preference among Americans for smaller government, or it could reflect a greater dissatisfaction with what government is actually doing with the revenues obtained.
At the same time, it also should be noted that tax-cutting ranks lower than many other options, all of which have strong majorities of American respondents saying they would be very effective. Roughly, there is a similar ranking of these options across the two countries, but—with the exception of promoting
marriage—all of them obtain a majority or close to a majority opinion in the United States. In Canada, only eight of 16 policy options receive majority support, with many garnering substantially less support than in the United States.
FIGURE 7 Effectiveness of Steps Government Could Take to Improve Economic Mobility: Percent Responding “Very Effective”
10% 20% 30% 40% 50% 60% 70% 80% 90% 100%
81 75
KEEP JOBS IN THE US/CANADA 75 70 MAKE COLLEGE/UNIVERSITY MORE AFFORDABLE 69 60 REDUCE CRIME/DRUGS IN COMMUNITIES 67 37
REDUCE HEALTH CARE COSTS 61 54 EARLY CHILDHOOD LEARNING 61 53 MAKE RETIREMENT SAVINGS EASIER 60 58 JOB TRAINING/EDUCATION FOR ADULT WORKERS
60 56
FINANCIAL EDUCATION
60 53
HELP SMALL BUSINESS
55 47 INFRASTRUCTURE PROJECTS 53 45
CUT TAXES FOR MIDDLE-INCOME FAMILIES 51 38 CUT TAXES 49 33 PROTECT HOMES FROM FORECLOSURE 48 38
RAISE MINIMUM WAGE
46 25 REFORM WELFARE 33 15 PROMOTE MARRIAGE 26 14
ALLOW PRIVATE PROVISION OF HEALTH CARE REFORM EMPLOYMENT INSURANCE
United States Canada
The most graphic illustration of the differences between the opinions of the citizens of these two countries is in the case of health care. The different
institutional context leads to two-thirds of Americans suggesting that a reduction in health care costs would be very effective, but only about one-third of
Canadians feel the same way. In other words, the differences between the countries may, in some degree, be taken to reflect different perceptions of satisfaction with what their governments are actually doing, rather than just different values toward the underlying legitimacy of intervention.
CONCLUSIONS
In the United States, there is a long tradition recognizing the value of a federal structure in developing effective public policies. Significant variation in public programs across states offers opportunities for learning about what works and what does not and hence, for the refinement of policy goals and improvements in program implementation. This comparative study of intergenerational economic mobility in the United States and Canada is offered in this spirit. By extending the scope of the comparison across countries, it offers another dimension for understanding the nature of social goals.
There are important similarities and differences between these two countries. The starting point for the analysis is the difference in outcomes that has been observed in the empirical economics literature dealing with economic mobility across generations. International comparisons of the average degree of earnings mobility suggest that Canada is more economically mobile than the United States, but a closer look at studies using particularly high-quality data that are directly comparable across these two countries suggests that the difference is even larger than previously implied. On average, Canada is up to three times more mobile than the United States. Furthermore, these differences arise from disparities in the extremes of the earnings distribution: there is notably less mobility at the very top and the very bottom of the American income ladder.
These cross-country variations in outcomes are not a reflection of different societal preferences or interpretations of the meaning of equality of opportunity. In fact, it is valuable to compare these two particular relatively rich countries because they are so much alike. This similarity in public attitudes is confirmed in the answers to comparable public opinion polls. Both countries value the ideal of equality of opportunity, and both define it in terms of individual freedoms and individual responsibilities. Americans, however, are inclined to view government as doing more to hinder than to help this process. Yet, at the same time, the citizens of both countries recognize the need for public policy to
contribute to reaching this ideal, with Americans believing more than Canadians that a whole host of interventions would be effective in improving the prospects for economic mobility. One interpretation of these findings—an interpretation that only becomes evident in a comparative context—is that, in some sense, this need currently may be unmet in the United States.
NOTES
1 The research literature directed to an understanding of these similarities and differences has a long
history with a notable starting point being the work of Seymour Martin Lipset, who studied the much stronger tendency for collective action in Canada and attempted to understand the rise of “agrarian socialism” as offering support for social democratic political parties, parties that were and continue to be absent in the United States (Lipset, 1950). This established political-sociology literature extends through the work of Esping-Andersen (1990), Alesina and Glaeser (2004), and others. But there have also been numerous studies on social and economic outcomes, with perhaps the most comprehensive collected in an edited volume under the title Small Differences that Matter(Card and Freeman 1993).
2 Organisation for Economic Co-operation and Development, GDP per capita figures for 2007, adjusted
for purchasing power parity. http://dx.doi.org/10.1787/540641728538.
3 Organisation for Economic Co-operation and Development (2008), Table 1.A2.2, p. 51.
4 The empirical framework for the measurement of the degree of intergenerational earnings mobility is,
in large part, informed by the following equation: Yi,t= α + βYi,t−1+ εi,t. Yrepresents the outcome of
interest, generally earnings or permanent income measured in natural logarithms, iindexes families, and
tindexes generations. As such, the adult earnings of a child from a particular family, Yi,t, is related to the
average earnings of the members of a similar age cohort, α, plus a deviation from the average that consists of two parts. The first part reflects the fraction of parental advantage inherited by the child, as indicated by βYi,t −1; the second, εi,treflects all other influences not correlated with parental earnings.The
coefficient β is often referred to as the intergenerational earnings elasticity. Ideally, the data to estimate it should come from a longitudinal study of a large, nationally representative sample of individuals and families. These individuals and families must be followed for a period long enough to obtain a credible estimate of the permanent income available to the parents while the child is growing up and long enough to observe the child in adulthood at a roughly similar stage in the life cycle as his parents. In practice, the nature of the data available across countries differs, and therefore, the extent to which measurement errors associated with the calculation of permanent income will also differ, as will the representativeness and size of the available sample.
5 Corak (2006), Table 1, p. 152.
6 Mazumder (2005a; 2005b). Mazumder links the Survey of Income and Program Participation to
Social Security Administration Summary Earnings Data, offering high-quality earnings information on up to 1,600 father and son pairs. Mazumder measured sons’ earnings from 1995 to 1998 when they were 27 to 35 years old and their fathers’ earnings from 1970 to 1985.
7 Mazumder (2005a), Table 7, p. 248.
8 Corak and Heisz (1999), Table 3, p. 513. What is striking is that the sample selection rules used in
these two studies are very close to being the same. Mazumder (2005a; 2005b) examines a young cohort of men ages 15 to 20 in 1983 and who were living with their parents in that year. These young men were at least 27 years old when their earnings were measured from 1995 to 1998. Corak and Heisz (1999) examine a cohort of men ages 16 to 19 in 1982 who filed an income tax return while living at home between 1982 and 1986. These young men were 27 to 32 years old when their earnings were measured between 1993 and 1995.
9 These differences in the intergenerational elasticities are not due to demographic differences
associated, for example, with immigration. It is generally recognized that immigration policies have differed for some time, with the United States more likely to accept low-skilled immigrants and with a significant fraction of illegal immigrants, while Canada is inclined to select high-skilled immigrants. Studies of the intergenerational mobility of immigrants in both countries have found that the father-son earnings elasticities are no different than for the overall population: ranging from 0.4 to 0.6 in the United States and essentially 0.2 in Canada. See Card, DiNardo, and Estes (2000) and Aydemir, Chen, and Corak (2009).
11 The poll of Americans surveyed 2,119 adults older than 18 years between January 27th and February
8th, 2009. This was based on random digit dialing with the use of a cell phone sampling frame for those under 40 years of age and took an average of 22 minutes to complete. The poll of Canadians surveyed 1,035 adults 18 and older between August 20th and September 14th, 2009. This survey was also based upon a stratified random sample including both land line and cell phone households. The questionnaire was the same as that used in the American survey to the extent possible. Some questions were adapted, some added, and everything was also translated to French. It required an average of 29 minutes to complete. See http://www.economicmobility.org/poll2009 for the questionnaire used in the United States and a summary of the major results. The Canadian questionnaire is available from the author upon request.
12 The 95 percent confidence interval for the U.S. survey is +/- 3.4 percentage points at sample
proportions of 50 percent, falling to +/- 2.0 percent at 10 and 90 percent. These bounds are similar in Canada, with the 95 percent interval being +/- 3.0 percent at a proportion of 50 percent. With respect to this particular question, the option “Getting a college degree” was changed in the Canadian version to “Getting a university degree.”
13 Nevertheless, it is difficult to see how differences in the timing of the polls can explain why Americans
were more likely than Canadians to think their children would have higher living standards even as respondents in both countries felt similarly about how difficult it would be for their children to move up the income ladder.
14 The greater impact of the 2008-2009 recession on the American economy and the differences in when
the two surveys were put into the field are revealed in the much higher percentage of Americans seeing the state of the economy as being essential or very important. This said, the survey also found that 79 percent of Americans believed that it was still possible for people to get ahead during the downturn.
15 The remaining 15 to 18 percent either responded both, depends, or neither.
16 Interestingly, even in Canada more people stronglybelieve the government impedes mobility on net
than strongly believe it promotes mobility.
17 The quotation is from the Economic Mobility Project (2009).
18 The exact wording of the question is as follows: “Now I am going to read you some steps the
government could take in improving economic mobility in this country and giving people the
opportunity to improve their chances of moving up the income ladder or the chances of their children. For each one I read, please tell me if you believe this would be very effective, somewhat effective, not very effective, or not effective at all.” The options “Reforming employment insurance” and “Allowing private provision of health care” were asked only in the Canadian survey. “Employment insurance” is the official term referring to the country’s unemployment insurance program.
RESOURCES
Aydemir, Abdurrahman, Wen-Hao Chen, and Miles Corak. 2009. “Intergenerational Earnings Mobility among the Children of Canadian Immigrants.” Review of Economics and Statistics, 91(2), 377-97.
Alesina, Alberto and Edward L. Glaeser. 2004. Fighting Poverty in the US and Europe: A World of Difference. Oxford: Oxford University Press.
Card, David, John DiNardo, and Eugena Estes. 2000. “The More Things Change: Immigrants and the Children of Immigrants in the 1940s, the 1970s, and the 1990s.” In G. Borjas (Ed.), Issues in the Economics of Immigration(pp. 227-269). Chicago: National Bureau of Economic Research and University of Chicago Press.
Card, David and Richard B. Freeman (Eds.). 1993. Small Differences that Matter: Labor Markets and Income Maintenance in Canada and the United States. Chicago: University of Chicago Press and National Bureau of Economic Research.
Corak, Miles. 2006. “Do Poor Children Become Poor Adults? Lessons for Public Policy from a Cross Country Comparison of Generational Earnings Mobility.” In John Creedy and Guyonne Kalb (Eds.), Research on Economic Inequality. Vol 13 Dynamics of Inequality(pp.143-188). The Netherlands: Elsevier Press. Corak, Miles and Andrew Heisz. 1999. “The Intergenerational Earnings and Income Mobility of Canadian Men: Evidence from Longitudinal Income Tax Data.” Journal of Human Resources, 34(3), 504-33.
Economic Mobility Project. 2009. “Findings from a National Survey and Focus Groups on Economic Mobility.” Washington DC: The Pew Charitable Trusts. http://www.economicmobility.org/poll2009.
Esping-Andersen, Gosta. 1990. The Three Worlds of Welfare Capitalism. Princeton: Princeton University Press.
Jencks, Christopher and Laura Tach. 2006. “Would Equal Opportunity Mean More Mobility?” In Stephen L. Morgan, David B. Grusky and Gary S. Fields (Eds.), Mobility and Inequality (pp. 23-58). Stanford: Stanford University Press.
Lipset, Seymour Martin. 1950. Agrarian Socialism: The Cooperative
Commonwealth Federation in Saskatchewan a Study in Political Sociology. Berkeley: University of California Press.
Mazumder, Bhashkar. 2005a. “Fortunate Sons: New Estimates of
Intergenerational Mobility in the United States using Social Security Earnings Data.” Review of Economics and Statistics, 87 (2), 235-55.
Mazumder, Bhashkar. 2005b. “The Apple Falls Even Closer to the Tree than We Thought: New and Revised Estimates of the Intergenerational Inheritance of Earnings.” In Samuel Bowles, Herbert Gintis, and Melissa Osborne Groves (Eds.), Unequal Chances: Family Background and Economic Success(pp. 80-99). Princeton: Princeton University Press and Russell Sage.
Organisation for Economic Co-operation and Development. 2008. Growing Unequal? Income Distribution and Poverty in OECD Countries. Paris: Organisation for Economic Co-operation and Development.
Roemer, John E. 2004. “Equal Opportunity and Intergenerational Mobility: Going Beyond Intergenerational Income Transition Matrices.” In Miles Corak (Ed.), Generational Income Mobility in North America and Europe(pp. 48-57). Cambridge: Cambridge University Press.
Solon, Gary. 1992. “Intergenerational Income Mobility in the United States.”
American Economic Review, 82(3), 393-408.
Zimmerman, David J. 1992. “Regression Toward Mediocrity in Economic Stature.” American Economic Review, 82(3), 409-29.
mobility and the health of the American Dream. It is led by Pew staff and a Principals’ Group of individuals from five leading policy institutes—The American Enterprise Institute, The Brookings Institution, The Heritage Foundation, The New America Foundation, and The Urban Institute. As individuals, each principal may or may not agree with potential policy solutions or prescriptions for action but all believe that economic mobility plays a central role in defining the American experience and that more attention must be paid to understanding the status of U.S. economic mobility today.
P R O J E C T P R I N C I P A L S
Richard Burkhauser, Ph.D., American Enterprise Institute Marvin Kosters, Ph.D., American Enterprise Institute
Ron Haskins, Ph.D., Center on Children and Families, The Brookings Institution Stuart Butler, Ph.D., Domestic and Economic Policy Studies, The Heritage Foundation William Beach, Center for Data Analysis,The Heritage Foundation
Ray Boshara, Domestic Policy Programs,The New America Foundation Harry Holzer, Ph.D., The Urban Institute
Eugene Steuerle, Ph.D., Urban-Brookings Tax Policy Center, The Urban Institute Sheila Zedlewski, Income and Benefits Policy Center,The Urban Institute
P R O J E C T A D V I S O R S
David Ellwood, Ph.D., John F. Kennedy School of Government,Harvard University Christopher Jencks, M. Ed., John F. Kennedy School of Government,Harvard University Susan Mayer, Ph.D., Irving B. Harris School of Public Policy,The University of Chicago Bhashkar Mazumder, Ph.D., Federal Reserve Bank of Chicago
Sara McLanahan, Ph.D., Princeton University
Ronald Mincy, Ph.D., Columbia University School of Social Work Timothy M. Smeeding, Ph.D., University of Wisconsin-Madison Eric Wanner, Ph.D., The Russell Sage Foundation
knowledge to solve today’s most challenging problems. Pew applies a rigorous, analytical approach to improve public policy, inform the public and stimulate civic life. We partner with a diverse range of donors, public and private organizations and concerned citizens who share our commitment to fact-based solutions and goal-driven investments to improve society.