Article ID cogp.1998.0708, available online at http://www.idealibrary.com on
Goals as Reference Points
Chip Heath
Fuqua School of Business, Duke University and
Richard P. Larrick and George Wu Graduate School of Business, University of Chicago
We argue that goals serve as reference points and alter outcomes in a manner consistent with the value function of Prospect Theory (Kahneman & Tversky, 1979; Tversky & Kahneman, 1992). We present new evidence that goals inherit the proper-ties of the value function—not only a reference point, but also loss aversion and diminishing sensitivity. We also use the value function to explain previous empirical results in the goal literature on affect, effort, persistence, and performance. 1999 Academic Press
What makes goals motivating? Why do people strive harder and more diligently when they face a specific, challenging goal, such as completing a paper by the end of the week or losing five pounds by the end of the month? Why do people feel worse when they fail to reach their goals? The relation-ship between cognitive and motivational processes has been a central con-cern in social–cognitive research in recent decades (e.g., Cantor & Kihl-strom, 1987; see Pervin, 1989, for a review). In this paper, we propose that a few basic cognitive and perceptual processes underlie a basic motivational process. Our claim is that goals serve as reference points and systematically alter the value of outcomes as described by the psychological principles in Prospect Theory’s value function (Kahneman & Tversky, 1979). In this pa-per we show that the principles of the value function are sufficient to explain a wide range of empirical findings on how goals affect motivation.
The authors thank Hal Arkes, Robyn Dawes, Rich Gonzalez, Dale Griffin, Joshua Klayman, George Loewenstein, Ann McGill, and John Payne for helpful comments on earlier drafts. The paper also benefitted from comments by participants at workshops at Carnegie Mellon, Duke, Ohio State, Northwestern, and the University of Chicago.
Address reprint requests to Chip Heath at Fuqua School of Business, Duke University, Box 90120, Durham, NC 27708. E-mail: [email protected].
79
0010-0285/99 $30.00 Copyright1999 by Academic Press All rights of reproduction in any form reserved.
This proposal has two implications. First, it implies that the value function can provide a unifying explanation for findings in both the goal literature and the judgment and decision making literature. Second, it suggests that both literatures can learn from the insights of the other. For example, the decision literature has traditionally limited itself to cognitive phenomena like choice and risk, whereas the goal literature has focused on motivational phe-nomena such as effort, persistence, and performance. And, while the decision literature has alluded to reference points other than the status quo, it has explored them less frequently; in contrast, the goal literature has conclusively shown the importance of non-status quo reference points. Thus, in building a bridge between the motivational processes discussed in the goal literature and the cognitive processes discussed in the decision making literature, we hope to identify new implications for each.
In the first section of the paper, we briefly review the history of the goal concept in psychology. Then we review the characteristics of the value func-tion proposed by Kahneman and Tversky (1979) and show that goals serve as reference points and distort outcomes in the manner predicted by the value function. In the second section of the paper we show how the major results of the goal literature can be explained by the value function.
THE GOAL CONCEPT IN PSYCHOLOGY
The goal concept has played an important role in many classic and contem-porary theories of motivation (Atkinson, 1957; Cantor & Zirkel, 1990; Hull, 1931, 1952; Lewin, 1931, 1935; Locke & Latham, 1990; Markus & Ruvolo, 1989; Tolman, 1932, 1959). Although we cannot exhaustively review previ-ous work on goals in this paper (see Pervin, 1989, for a review), we will briefly summarize some aspects of traditional work that highlight the novelty of our approach. In our approach, we attempt to explain motivational phe-nomena like effort, persistence, and performance by focusing not on external rewards but on the psychological effects of ‘‘mere’’ goals. Also, although expectancies are clearly important, we explore how many phenomena we can explain by assuming that goals alter, not expectancies or likelihoods, but the psychological value of outcomes.
Extrinsic Rewards versus Mere Goals
In many situations, goals are associated with a valuable object in the exter-nal environment. For example, Tolman (1959) claimed that hunger makes an organism see a piece of food as a goal. Note that this use of the term ‘‘goal’’ is not particularly psychological: the goal is a discrete, tangible, extrinsic reward that has real consequences for physiological well-being.
More psychologically interesting are what we call ‘‘mere’’ goals, which are specific levels of performance (e.g., finishing a manuscript in 3 days as opposed to 5) that are not accompanied by any discontinuous change in an
external reward. The most influential evidence for mere goals is contained in the literature on goal setting (Locke, 1968; Locke & Latham, 1990). Scores of laboratory and field studies have documented that mere goals in-crease performance (Locke & Latham, 1991; Mento, Steel, & Karren, 1987; Tubbs, 1986; for a complete review of over 200 studies, see Locke & La-tham, 1990). Performance increases have been documented using tasks rang-ing from cognitive, such as solvrang-ing anagrams or thinkrang-ing of creative uses for a common household object, to physical, such as cutting logs and pedaling a bicycle. Two key findings have emerged from this literature. First, studies that have manipulated goal difficulty have found that performance increases as the difficulty of the goal increases, even when goals are extremely high. Second, studies that have compared instructions ‘‘to set a specific, challeng-ing goal’’ with instructions to ‘‘do your best’’ have found that performance is superior for specific, challenging goals.
In this paper, we focus on mere goals because we want to study the cogni-tive relevance of goals without the confounding influence of discrete payoffs. Our definition of mere goals, for example, excludes situations where a sales-person sets a goal to sell 200 units because he or she receives a bonus at 200. Such situations can be analyzed with a straightforward economic calculus, whereas ‘‘mere goals’’ are fundamentally psychological.
Values versus Expectancies in Expectancy–Value Approaches to Motivation
Although our emphasis on mere goals is important, the central feature of our approach is that we explain the effects of goals in terms of values rather than expectancies.
In research on goals, one of the most important developments occurred when researchers shifted from a purely behaviorist approach (Hull, 1931, 1952; Spence, 1956) to a cognitive one (Lewin, 1935, 1951; Tolman, 1959) that assumed that organisms possess mental representations of goals and of their likelihood of achieving them.1The earliest use of goals to explain moti-vation was by researchers in the behaviorist tradition who did not assume that goals invoked any kind of mental process. For example, in Clark Hull’s behaviorist account of learning, goals were reinforcers (like food) that di-rected future behavior through past conditioning. One important aspect of goals that Hull attempted to explain was the ‘‘goal gradient’’ response, a tendency for organisms to become more motivated as they approached a goal (Hull, 1932, 1938; see also Lewin, 1931; Miller, 1944). For example, rats ran faster as they came closer to the goal box. Although behaviorists in the Hull–Spence tradition referred to this motivational increase as a ‘‘fractional anticipatory goal response,’’ rats did not ‘‘anticipate’’ goals; they simply 1For reviews of the cognitive approach of expectancy–value theories see Feather (1959, 1982), and Fischhoff, Goitein, and Shapira (1981). See, also, Siegel (1957).
acted on conditioned responses that linked stimuli near a goal (such as the final turn in a maze) with the goal (food) (Spence, Bergmann, & Lippitt, 1950).
In contrast to Hull’s perspective, Tolman (1932, 1959) and Lewin (1935, 1951; Lewin, Dembo, Festinger, & Sears, 1944) offered motivational theo-ries in which organisms truly anticipated goals and strove to achieve them. Models in this tradition have been labeled ‘‘expectancy–value’’ models be-cause they emphasize expectations in addition to the values of outcomes (e.g., Atkinson, 1957; see Feather, 1982, for a review), and many of these expectancy–value models have focused mainly on expectancies (e.g., see Klein’s 1991 review). Researchers who study expectancy–value models may have overreacted against the behaviorist tradition by focusing solely on the most apparently cognitive aspect of their models: expectancies. In contrast, we will emphasize a cognitive approach to values and will attempt to accom-modate the major findings of goal research, such as ‘‘goal gradients,’’ using values alone. Although expectancies are clearly important, we show that a cognitive approach to value is a sufficient explanation of most goal phe-nomena.
Value Function
The Prospect Theory value function (Kahneman & Tversky, 1979; Tver-sky & Kahneman, 1981, 1991, 1992; see also Markowitz, 1952) is a promis-ing source of psychological principles that explain how values are altered by the presence of a reference point such as a goal. It has been used to explain a variety of behavior in fields ranging from economics (Benartzi & Thaler, 1995; Odean, 1998) to medicine (McNeil, Pauker, & Tversky, 1988) to con-sumer behavior (Thaler, 1985) to social psychology and political science (Kramer, 1989; Quattrone & Tversky, 1988).
The value function, v(x), (see Fig. 1) incorporates three principles. 1. Reference point. The reference point divides the space of outcomes into regions of gain and loss (or success and failure). Thus, the value function assumes that people evaluate outcomes as gains or losses relative to the neu-tral reference point.2
2. Loss aversion. Outcomes that are encoded as losses are more painful than similar sized gains are pleasurable (v(x)⬍|v(⫺x)|, x⬎0). For example, the pain of losing $10 is larger in magnitude than the pleasure of gaining $10, v(10)⬍|v(⫺10)|. In Kahneman and Tversky’s (1979) words, ‘‘losses loom larger than gains.’’
3. Diminishing sensitivity. The value function draws an analogy to psy-chophysical processes and predicts that outcomes have a smaller marginal
2By convention but without loss of generality, the value at the reference point, 0, is assigned a value of 0, i.e., v(0)⫽0.
FIG. 1. A typical value function. Its three key features are a reference point, loss aversion, and diminishing sensitivity.
impact when they are more distant from the reference point. For example, the pleasure of moving from $110 to $120 is less than the pleasure of mov-ing from $10 to $20 (in general, v″(x)⬍0, x⬎0), and the pain of moving from⫺$110 to⫺$120 is less than the pain of moving from⫺$10 to⫺$20 (v″(x) ⬎ 0, x ⬍ 0). Diminishing sensitivity gives the value function its characteristic S-shape—concave above the reference point and convex be-low it.3
WHAT DOES THE VALUE FUNCTION IMPLY ABOUT GOALS?
In this section, we explore whether the effects of mere goals are consistent with the predictions of the value function. First, we show that goals serve as reference points, and second, we show that the valuation of outcomes relative to a goal can be explained by loss aversion and diminishing sensitiv-ity. As shorthand for this two-part proposition, we will say that goals ‘‘in-herit’’ the properties of the value function.
3Many studies show diminishing sensitivity for both gains and losses, in riskless judgments as well as risky choice (e.g., Galanter & Pliner, 1974; Tversky & Kahneman, 1992; Gonzalez & Wu, 1999).
Implications of the Reference Point
One of the most basic aspects of motivation is that people do not see outcomes as neutral, but categorize them as a success or failure and then they experience positive or negative emotion based on their categorization. The reference point of the value function plays a key role in this categoriza-tion because it divides the space of outcomes into a positive and negative region. This is not a unique prediction of the value function; most other theories of goals and aspirations also contain some variant of this principle (e.g., Lewin, Dembo, Festinger, & Sears, 1944). The following problem demonstrates this principle:
Problem 1. [N⫽45] Sally and Trish both follow workout plans that usually involve doing 25 sit-ups.
One day, Sally sets a goal of performing 31 sit-ups. She finds herself very tired after performing 35 sit-ups and stops.
Trish sets a goal of performing 39 sit-ups. She finds herself very tired after per-forming 35 sit-ups and stops.
What emotion is each person experiencing?
One hundred percent (100%) of participants listed a positive emotional reaction for Sally and a negative emotional reaction for Trish (according to independent raters).
Problem 1 demonstrates that goals, like reference points, divide outcomes into regions of good and bad, success and failure. Although the goal literature has recognized this point, it has not always recognized what this implies about how people react to their performance: If goals are reference points, then people who set goals will sometimes feel worse about their performance even when they perform better. Consider the following problem:
Problem 2. Alice typically scores around 80 on weekly 100-point quizzes in one of her classes. One week she sets a goal of scoring 90. She scores 87.
Betty typically scores around 80 on weekly 100-point quizzes in one of her classes. One week she decides to do her best. She scores 83.
Overall, who will be more satisfied with her performance? [N⫽60]
Both Alice and Betty typically perform at the same level on their weekly quizzes, and this week both have exceeded their typical score. Thus if they used their normal performance as their reference point, both should be happy but Alice should be happier. However, because goals operate as reference points, Alice ends up in the domain of losses because she performs three points below her reference point. Although Alice performs above Betty in absolute terms, people agree that she will be less satisfied with her perfor-mance ( p⬍.05 byχ2). Similar results have been documented in laboratory studies in the goal-setting literature. For example, Mossholder (1980) found that subjects in a goal condition evaluated their performance less positively than subjects who had no goal, despite the fact that goal subjects
outper-formed no-goal subjects by about 15% (see also Kernan & Lord, 1989; Meyer, Schact-Cole, & Gellatly, 1988).
In the decision literature, results such as this have been labeled ‘‘framing effects.’’ In many cases, the same outcome can be framed as a loss or a gain depending on which reference point people use to evaluate it, and in turn, framing affects satisfaction. Researchers in the goal-setting literature, how-ever, have not always recognized framing effects. Indeed, a major theoretical debate in the goal-setting literature arose when researchers realized that peo-ple who set goals feel less satisfied with their performance than peopeo-ple who do not set goals. Garland (1984) sparked a debate when he argued that this result contradicted expectancy theory: If high goal subjects are less satisfied with high performance, then why do they work harder to attain high perfor-mance in the first place? This observation sparked an exchange that lasted for a number of years (Locke, Frederick, Lee, & Bobko, 1984; Meyer, et al., 1988; Locke & Latham, 1990; Mento, Locke, & Klein, 1992; Klein, 1991).
If goal setting researchers had borrowed the notion of reference points from the value function approach, they could have explained this theoretical puzzle more easily. If goals act as reference points, then framing effects immediately explain half of Garland’s (1984) question: Why do people with higher goals feel worse? However, framing effects and reference points can-not explain the second half: Why do they perform better? Below, we use other properties of the value function to explain the second half of this question.
Implications of Loss Aversion
In addition to a reference point, value function also assumes loss aversion, the notion that losses will be more painful than gains will be pleasurable (v(x)⬍|v(⫺x)|). If goals act as reference points, then loss aversion implies that people who are below their goal by x units will perceive their current performance as a loss relative to their goal; thus they will work harder to increase their performance by a given increment than people who are above their goal by x units. Empirical work also suggests that, under certain condi-tions, it may be possible to make more specific predictions about the magni-tude of loss aversion. Neither the general nor the specific predictions about loss aversion arise in other theories of goals; they are unique predictions of the value function.
Magnitude and Slope
The simplest loss aversion prediction is this: If people fall short of their goal, they should feel more pain than they would feel pleasure if they sur-passed the goal by an equivalent amount. Consider a modified version of Problem 1 from the last section:
Problem 3. [N⫽48] Sally and Trish both follow workout plans that usually involve doing 25 sit-ups.
One day, Sally sets a goal of performing 31 sit-ups. She finds herself very tired after performing 35 sit-ups and stops.
Trish sets a goal of performing 39 sit-ups. She finds herself very tired after per-forming 35 sit-ups and stops.
Who is experiencing more emotion? Sally (29%) Trish (71%)
As in Problem 1, if we ask participants which emotion Sally and Trish are experiencing, they agree unanimously that Trish is feeling negative emo-tion and Sally is feeling positive emoemo-tion. In addiemo-tion, a majority of partici-pants agree that Trish is feeling stronger emotion than Sally (p⬍ .05 by χ2). These results agree with the prediction of the value function: loss aver-sion implies that v(4)⬍|v(⫺4)|.
The value function also makes predictions about the kinds of effortful performance that have been considered by the goal setting literature.
Problem 4. [N⫽73] Charles and David both follow workout plans that usually involve doing 25 sit-ups.
One day, Charles sets a goal of performing 30 sit-ups. He finds himself very tired after performing 34 sit-ups and, at most, has the energy to perform 1 more.
David sets a goal of performing 40 sit-ups. He finds himself very tired after 34 sit-ups and, at most, has the energy to perform 1 more.
Who will work harder to perform the 35th sit-up? Charles (18%) David (82%) Our subjects reliably predicted that David would exert more effort than Charles ( p⬍.001 byχ2).4 This problem controls for the ability of Charles and David by stressing that both normally perform 25 sit-ups in their work-outs. Charles and David should be willing to exert effort only if the additional benefits of performing 1 more sit-up offset the additional costs. Are the bene-fits received by Charles for doing another sit-up more or less than the benebene-fits received by David? We assume that benefits are determined by the value function, so if bg(x) is the benefit from completing x units of performance
with a goal of g, then this benefit is captured by the value function evaluated relative to the goal, bg(x)⫽v(x⫺g). If b′g(x) is the marginal benefit of an
incremental increase in performance, then we can formally answer the ques-tion about Charles and David by comparing the value funcques-tion at b′30(35) and b′40(35). Loss aversion indicates that b′30(35) ⫽ v′(5) ⬍ v′(⫺5) ⫽
b′40(35) (see Fig. 2).5Thus, the value function predicts David will experience
4In this problem, and in the Charles and David problems below, we replicated this basic pattern of results with a cover story about Nancy and Martha, two computer programmers who were completing program modules.
5Technically, this is only an approximation. More precisely, David benefits more than Charles from an additional sit-up if b30(35)⫺b30(34)⬎b40(35)⫺b40(34), which is equivalent to v(5)⫺v(4) ⬍ v(⫺5)⫺v(⫺6). However, the approximation suffices since b30(35)⫺ b30(34)⬇b′30(35)⫽v′(5) and b40(35)⫺b40(34)⬇b′40(35)⫽v′(⫺5).
FIG. 2. Value functions for two individuals—one with a goal of 30 and one with a goal of 40 The dotted lines highlight performance at 28, 35, and 42, and the dark slopes indicate the level of effort each individual will exert at those points.
higher benefits from an additional sit-up than Charles and thus David will exert more effort.
Value of Slope
Problem 4 illustrates the principle that people are more sensitive to losses than to equivalent gains. But how much more sensitive? Studies of risky choice (Tversky & Kahneman, 1992) and riskless choice (Tversky & Kahne-man, 1991; KahneKahne-man, Knetsch, & Thaler, 1990) have presented converging evidence that losses are weighted approximately two times more than equiva-lent gains (the most common values for this ‘‘coefficient of loss aversion’’ fall between 2 and 4).
If previous measurements of the coefficient of loss aversion ranged from 2 to 4, then we may be able to predict more specifically how sensitive people are to losses and gains relative to a goal. Keeping in mind some potential problems with extrapolating from previous results,6 it seems reasonable to predict that individuals would be willing to work twice as hard when they are approaching their goal than after they have exceeded it. The following problem tests this prediction:
Problem 5a. [N⫽61] Lisa has a goal of making 30 sales this month. Going into the last week of the month, she has completed 30 sales. Although she ordinarily 6There are several measurement issues that arise in making such estimates, including the need for a linear scale to assess tradeoffs. Previous studies have measured the value of losing or gaining an item in terms of money, which is likely to be linear in value for small changes. In our tests, we make the same assumption about time, the measure of cost we used.
doesn’t work overtime, she decides to work 2 hours during the last week to complete 5 unclosed sales.
Elizabeth has a goal of making 35 sales this month. Going into the last week of the month, she has completed 30 sales. Although she ordinarily doesn’t work over-time, she considers doing so during the last week to complete 5 unclosed sales. How many hours of overtime is she likely to work?
Problem 5b. [N⫽57] Elizabeth has a goal of making 35 sales this month. Going into the last week of the month, she has completed 30 sales. Although she ordinarily doesn’t work overtime, she works 8 hours of overtime during the last week to com-plete 5 unclosed sales.
Lisa has a goal of making 30 sales this month. Going into the last week of the month, she has completed 30 sales. Although she ordinarily doesn’t work overtime, she considers doing so during the last week to complete 5 unclosed sales. How many hours of overtime is she likely to work?
In Problem 5a, Elizabeth is deciding how much time to devote to remove a loss of five sales relative to her goal while Lisa is deciding how much time to devote to move five sales above her goal. If losses are two times more painful than gains are good, then Elizabeth should be willing to exert about twice as much effort to remove her loss as Lisa would exert to create an equivalent gain. If the cost of exerting more time is approximately linear in this range, then we would predict that, if Lisa is working 2 h, Elizabeth should work about 4 h. Consistent with the value function approach, the median answer for Elizabeth was 5, implying a coefficient of loss aversion of 2.5 (the 99% confidence interval around the mean coefficient of loss aver-sion was [2.30, 3.85]).
To ensure that the results were reliable, Problem 5b asked a separate group of participants to predict how much overtime Lisa would work if Elizabeth worked 8 h [N⫽57]. Here, the median answer was 4, implying a coefficient of loss aversion of 2 (the 99% confidence interval was [1.37, 2.74]). Despite the very different starting points, the problems provide converging evidence that participants expected others to work about two to four times more hours to eliminate a shortfall from a goal than to exceed a goal by an equivalent amount.7
The results of this problem are consistent with two results from the goal setting literature. An article by Mento et al. (1992) is the only article we have located in the goal literature that provides data that allows us to calculate a coefficient of loss aversion. However, results from two of their studies pro-vide converging epro-vidence that the coefficient of loss aversion for goals is in the 2–4 range. In Study 1, a graph reporting valences for three different goal
7We also replicated the scenario with a description of two managers of an office supply store who were either 400 units ahead or behind of their personal goal for selling units of a particular office product. We asked participants to predict how many dollars of their ad budget the managers would spend to sell an additional 400 units. The results were similar, although the confidence intervals were wider because of high variance in the dollar amounts specified by participants.
levels showed loss aversion coefficients around 2. In Study 8, participants were asked how satisfied they would be if they performed one level above their goal and one level below it. The mean coefficient of loss aversion was 2.4 with a 99% confidence interval of [2.24, 2.66].
Thus some preliminary evidence indicates that the coefficient of loss aver-sion for goals (time and Likert scales) is similar to the coefficient that has been observed for other reference points (monetary values in risky and risk-less choice). The generality of these results is worth further investigation.8
Implications of Diminishing Sensitivity
In this section, we explore the implications of diminishing sensitivity for effort near a goal, for effort far away from a goal (a situation we will label the starting problem) and for risk taking.
Effort Near a Goal
Diminishing sensitivity has a number of implications for goal behavior. Recall that diminishing sensitivity gives the value function itsS-shape: con-cave above the reference point and convex below it. Diminishing sensitivity predicts that goals will affect effort differently depending on whether people are above their goals (in the concave region of ‘‘gains’’) or below (in the convex region of ‘‘losses’’). People should be willing to exert less effort as they move away from their goal, but they should be willing to exert more effort as they approach their goal. The following problems illustrate these principles:
Problems 6 and 7. Charles and David both follow workout plans that usually involve doing 25 sit-ups.
One day, Charles sets a goal of performing 30 sit-ups. He finds himself very tired after performing 42 [28] sit-ups and, at most, has the energy to perform one more. David sets a goal of performing 40 sit-ups. He finds himself very tired after 42 [28] sit-ups and, at most, has the energy to perform one more.
Who will work harder to perform one final sit-up?
Goal⫽30 Goal⫽40 Problem 6. After 42 sit-ups [n⫽76] Charles (31%) David (69%) Problem 7. After 28 sit-ups [n⫽74] Charles (86%) David (14%) We assume that an individual is willing to exert effort to perform one more sit-up if the costs of effort are exceeded by the benefits. According to the value function, the benefits that Charles and David receive from their performance are subject to diminishing sensitivity. Consider Fig. 2, which 8In its pure form, the value function argument just requires that losses loom larger than gains (i.e., a loss aversion coefficient greater than 1). Although empirical evidence thus far suggests coefficients in the 2–4 range, it would indeed be surprising if the coefficient of loss aversion is in this range for all domains.
illustrates the benefit functions for Charles and David, both of which are consistent with the properties of the value function and identical except in how they are displaced by their respective goals.
At 42 sit-ups, the slopes of the two value functions indicate that Charles receives lower benefits from an additional sit-up than David. Note that Charles benefits from another sit-up at the rate b′30(42)⫽v′(12), while David benefits at the rate b′40(42) ⫽ v′(2). By diminishing sensitivity, v′(12) ⬍
v′(2). The results of Problem 6 confirm this prediction. When Charles and David are both above their goals, participants expect David, who is closer to his goal and experiencing smaller effects of diminishing sensitivity, to exert more effort after the 42nd sit-up (p⬍.05 byχ2). However, this predic-tion of the value funcpredic-tion is similar to the predicpredic-tion of the goal setting litera-ture, which has typically assumed that, within a reasonable range, more chal-lenging goals lead to higher effort.
Problem 7 successfully distinguishes the value function approach from the traditional goal-setting approach. When Charles and David are both be-low their goals, the value function in Fig. 2 clearly predicts that Charles will exert more effort than David at 28 sit-ups because he receives higher benefits. Again, this prediction follows from diminishing sensitivity, Charles is closer to his goal and is much more sensitive to movements toward it, b′30(28)⫽
v′(⫺2)⬎v′(⫺12)⫽b′40(28). Consistent with the value function prediction but not goal setting, participants expected Charles to exert more effort after the 28th sit-up (p⬍.001 byχ2).9These results also contradict the predictions of control theory (e.g., Campion & Lord, 1982), which has assumed that people who are further from their goal will work harder to move toward their goal than people who are close.
This result would be worth testing in a laboratory experiment. Because recent goal setting studies have focused on overall behavior, researchers have rarely tested marginal effort at different levels of performance relative to a goal. However, consistent with the prediction of the value function, some early studies indicate that people who have goals are much more likely to intensify their effort toward the end of long work periods (Mace, 1935, cited in Locke & Latham, 1990, p. 88). This prediction of the value function may also help explain earlier research on the ‘‘goal gradient’’—the idea that or-ganisms increase their efforts when a goal is proximal. Indeed, the goal
gradi-9
We found similar results when we asked people, not just about effort (1 additional sit-up), but about persistence (5 additional sit-ups). In a problem that was largely identical to Problems 6 and 7, we told participants that both athletes find themselves ‘‘very tired after performing 42 [23] sit-ups,’’ and we asked them to predict which athlete would be more likely to perform 5 more sit-ups. David, who has a goal of 40, was expected to persist longer after the 42nd sit-up by 74% of participants (p⬍.001 byχ2). However, again consistent with the notion of diminishing sensitivity, this expectation reversed when both athletes were behind their goal. Here, Charles, with a goal of 30, was expected to be more likely to do 5 more sit-ups by 78% of participants ( p⬍.001 byχ2).
ent prediction was confirmed with both animals (Hull, 1932, 1938) and hu-mans (Fajans, 1933, as cited in Lewin, 1951). Note that much of this research may not be directly relevant to our approach because it involves real external rewards and not just mere goals. However, the value function predicts a goal gradient effect even for mere goals, thereby incorporating this central con-cept from the older goal literature.
Effort Far from a Goal: Starting Problem and Subgoals
If the value function describes how people respond to goals, then diminish-ing sensitivity implies that, far away from the goal, people may not feel that they are making much progress toward their goal. In turn, they may find it difficult to motivate themselves to start a task when they face a difficult goal. We call this implication of diminishing sensitivity the ‘‘starting problem’’ and illustrate it with the following problem.
Problem 8. [N⫽47] Jim decides that he would like to donate more time to charity. His schedule won’t permit more than 4 h per week, so he sets a personal goal of working 40 h over the next 10 weeks at a neighborhood soup kitchen. Soon after starting, Jim learns that the soup kitchen will be forced to close in 4 weeks.
Kyle decides that he would like to donate more time to charity. His schedule won’t permit more than 4 h per week, so he sets a personal goal of working 200 h over the next year at a neighborhood soup kitchen. Soon after starting, Kyle learns that the soup kitchen will be forced to close in 4 weeks.
Who will donate more time to the soup kitchen over the next 4 weeks? Please circle one Jim (81%) Kyle (19%)
Note that Jim and Kyle have set goals that require them to work at a similar rate (4 h per week). Also note that neither will reach his goal before the soup kitchen closes. However, according to the value function, Jim feels that he is making more progress than Kyle: b40(16)⫽v(⫺24)⫺v(⫺40)⬎
v(⫺184) ⫺v(⫺200)⫽ b200(16). Consistent with the notion of a ‘‘starting problem,’’ people feel that Kyle will find it more difficult to start working toward his high goal.
Some researchers in the goal literature have speculated about a question that is related to Problem 8: Do proximal or distal goals inspire higher perfor-mance? Would a dieter, for example, lose more weight if he set a goal of losing 12 pounds in 3 months or 1 pound a week? Some researchers have argued that proximal goals may enhance self-efficacy and therefore expecta-tions of future success. For example, ‘‘Attainment of temporally proximal goals (relative to more distal ones) gives an individual a sense of task mastery and bolsters efficacy. This enhanced efficacy, in turn, increases subsequent aspirations as well as perseverance in the face of discrepant feedback’’ (Earley & Lituchy, 1991, p. 83; see also Bandura, 1986). Such arguments emphasize expectations or beliefs, so they cannot account for the results above. In Problem 8, both goals are set so high that neither can be attained;
therefore goal ‘‘attainment’’ cannot enhance self-efficacy or future expecta-tions of success.
The goal setting literature has attempted to explain related results by in-voking the notion of commitment (Locke & Latham, 1990, 1991; Erez & Zidon, 1984). Although they have typically argued that higher goals improve performance, goal researchers have noted that people may refuse to commit to goals that are too high. In Problem 8, Kyle may be less committed to his extraordinarily ambitious goal than Jim is committed to his more moderate goal.
In the short run, this ‘‘commitment’’ explanation conflicts with that of the value function. According to the value function approach, if people did not commit to a goal, their reference point would not move and their values would not change. However, the conflict can be resolved if we assume that the value function causes the commitment problem. Initially, people commit to their goal and the goal alters their values. Later, people become less com-mitted to their goal because their altered values produce the starting problem. To test this notion, we gave a separate set of people the scenario above and added the three questions below.
Problem 9. [N⫽64 for these three questions.] 1. At the start, who is more committed to his goal?
Jim (23%) Equal (53%) Kyle (24%)
2. Who feels that donating 4 h per week for the next 4 weeks will make more progress towards his goal?
Jim (83%) Equal (11%) Kyle (6%) 3. In the end, who’s going to feel more committed to his goal?
Jim (72%) Equal (12%) Kyle (16%)
Note that participants expected Jim and Kyle to be equally committed to their goals at the start. This result contradicts the traditional commitment explanation, which would require that Kyle be less committed to his overly ambitious goal. As the value function predicts, participants expected Jim to feel that he is making more progress toward his goal. And consistent with the integration of commitment and the value function, participants expected Jim to end up more committed to his goal (the proportion of people favoring Jim in the last two problems significantly exceeds 50%, p⬍ .01 byχ2).
Subgoaling. One way to overcome the starting problem is to set subgoals.
People who set subgoals are more sensitive to progress than people who focus only on their ultimate goal. Consider the effect of subgoals in the fol-lowing problem:
Problem 10. [N⫽46] Jill is a high school cross-country runner. One summer she decides to run 1000 miles over the course of the 90-day summer break. Jill thinks of this as running 330 miles a month (30 days). The first day she runs 15 miles and wakes up quite sore.
1000 miles over the course of the 90-day summer break. Tina thinks of this as run-ning 11 miles a day. The first day she runs 15 miles and wakes up quite sore.
Who is more likely to reach her overall goal for the summer? Please circle one: Jill (22%) Tina (78%)
Both runners have the same overall goal for the summer. However, Jill has divided her overall goal into distant subgoals of 330 miles per month, while Tina has divided her overall goal into proximal subgoals of 11 miles per day. People agree that the proximal subgoals are more likely to produce eventual success. The value function suggests that by separating a task into subgoals, people should maximize their sensitivity to small movements toward their overall goal. When Jill wakes up sore after running her first 15 miles for the summer, she may find it difficult to motivate herself to run at all. After all, running any feasible number of miles seems to contribute so little to her distant subgoal of 330 miles per month. By dividing the monthly goal into daily subgoals, Tina is better able to see progress relative to her goal.
Risk
Diminishing sensitivity produces the curvature of the value function, and the curvature of the value function predicts how people will react to risk. In the domain of gains, the concave part of the value function implies that peo-ple will be risk averse (i.e., that they will prefer a sure thing over a gamble of equal expected value). For example, when people choose between $3000 for sure or a .80 chance of $4000, the majority prefers the sure thing (Kahne-man & Tversky, 1979). Since the gamble has a slightly higher expected value ($3200 versus $3000), this choice suggests that people are risk averse.
Although the traditional literature in economics has assumed that risk aversion was the norm, the decision literature has demonstrated that risk attitudes change depending on whether people are above or below a reference point. For example, if the signs are reversed on the gamble above, people prefer a .80 chance of losing $4000 over losing $3000 for sure; i.e., they are risk seeking. For moderate probabilities and values, people tend to be risk averse when outcomes are above their reference point (hence in gains) and risk seeking when outcomes are below their reference point (hence in losses) (Tversky & Kahneman, 1979, 1992; Payne, Laughhunn, & Crum, 1980, 1981; Fishburn & Kochenberger, 1979).
The value function was proposed, in part, to describe risk seeking in the domain of losses (Kahneman & Tversky, 1979), and the convex shape of the value function in the loss domain implies that people will be risk seeking. Thus, if we are correct, and goals serve as reference points that separate losses from gains, then specific goals should make people more risk seeking when they are below their goal. The following problem demonstrates this prediction of the value function.
Problem 11. You are the manager of a large manufacturing unit in a Fortune 100 company. At the present time, you are in the midst of a year-long plan to cut costs in your unit. Your goal for this quarter is to do your best to save money during the current quarter. [Your goal for this quarter is to save $250,000.]
At present, you are considering two plans: Plan M. Plan M will save $120,000.
Plan N. Plan N has an 80% chance of saving $50,000 and a 20% chance of saving $250,000.
Both plans are one-time options. They will not be available later in the year, and you have time to complete only one of them during the current quarter.
Which plan will you choose? [Do your best, N⫽65] Plan N (24%) Which plan will you choose? [Save $250,000, N⫽66] Plan N (47%)
The number of people who choose the more risky Plan N doubles when people have a specific rather than a ‘‘do your best’’ goal ( p⬍ .01 byχ2). Consistent with the predictions of diminishing sensitivity, people are more risk seeking when they are below their goal.
Lay Theories and Behavior
We have explored whether goals serve as reference points by exploring whether goals inherit key features of the value function like loss aversion and diminishing sensitivity. At this point, we have evidence that people’s intuitions about goals agree with the predictions of the value function, but lay theories should also be confirmed with real behavior. In the next section, we review the empirical evidence from the goal setting literature and show that the value function explains the stylized facts from hundreds of studies where goals affect important motivational behaviors like effort and perfor-mance. However, Problems 1–11 contain some novel predictions that would benefit from further study with real behavior.
In other research (Larrick, Heath, & Wu, 1999a), we have confirmed the risk predictions of the value function with real behavior. As in Problem 11, when people make real choices and suffer real consequences, they become more risk seeking when they set high goals. When faced with choices among monetary gambles, people with high goals were more willing to take gambles with lower expected payoffs but higher variance. In a social bargaining task, they took positions that empirically ran a higher risk of making their bar-gaining partner walk away, leaving them with nothing. In an anagram task, they attempted to perform harder problems where they were more likely to fail.
While other predictions of the value function await further behavioral re-search, the section below illustrates that the value function explains some of the key behavioral results in the goal literature.
THE EFFECTS OF GOALS ON MOTIVATION: EFFORT, PERSISTENCE, AND PERFORMANCE
In the introduction, we argued that the value function may help bridge the gap between the decision literature, which has traditionally been concerned
with cognitive phenomena, and the goal literature, which has traditionally been concerned with motivational phenomena. In the previous section, we demonstrated that goals serve as reference points and inherit the properties of the value function. In this section, we use the properties of the value function to explain a large set of empirical results in the goal literature that concern one of the most basic question of motivation: When will people work harder and longer on a task?
Our attempt to link the value function and goal literature may be somewhat controversial. The decision literature has primarily focused on cognitive ex-planations for phenomena like choice , while the goal literature has focused on affect, effort, persistence, and performance—‘‘hot’’ motivational issues. We argue that the value function bridges these two literatures. When people set a goal, their goal acts as a reference point and systematically alters the value of outcomes. When values are altered, people not only choose differ-ently, they become more motivated to exert effort and to persist and as a result they perform better. Below, we briefly review the major empirical results in the goal setting literature and we use the properties of the value function to explain them.
Using the value function to explain these results requires a few steps be-cause the empirical results in the goal setting literature concern the aggregate performance of a collection of individuals. In the section below, we first consider how the value function explains the components of individual per-formance—effort and persistence. We then describe a model that explains how effort and persistence combine to determine an individual’s overall per-formance. Finally, we consider what our model of individual performance predicts when the performance of a collection of individuals is aggregated.
Explaining Individual Effort and Persistence
In this section, we consider how the value function explains the compo-nents of individual performance—effort and persistence. The literature on the motivational effects of goals extends to hundreds of studies, so we will only mention some of the empirical results (see Locke & Latham (1990) for a more comprehensive review).
Effort. On physical tasks, goal subjects exercise at a higher rate, squeeze
a grip harder, lift more weight, and pedal more rapidly on a bicycle. On cognitive tasks, goal subjects react faster, perform more rapidly on well-learned tasks like addition and subtraction, and even on tasks like brainstorm-ing or anagrams (cf. Locke & Latham, 1990, pp. 87–90).
Persistence. On physical tasks, people with high goals compress a hand
dynamometer longer and persist longer in a classic pain tolerance task (im-mersing one’s arm in very cold water). People also persist longer on mental tasks. On anagrams, high goal participants worked longer and rested less. On a prose comprehension task, they spent more time studying than partici-pants with do your best goals. And individuals with high goals are also less
likely to quit when they encounter difficulties. On bargaining tasks, high goal participants bargain longer and hold their positions longer rather than compromising (cf. Locke & Latham, 1990, pp. 90–92).
To explain why people with high goals may exert higher effort and persist longer, we assume that goals serve as reference points and that the value function explains how the value of outcomes is altered by the goal. We also assume that people decide how much effort to exert and how long to persist by weighing the benefits and costs of additional effort or persistence. The following two assumptions are critical for our analysis:
1. The benefits are determined by the Prospect Theory value function and the particular goal (reference point) that people set. If bg(x) is the benefit
derived from completing x units of performance given a goal g, bg(x) ⫽
v(x⫺g).
2. The cost of producing a unit of performance (e.g., an extra sit-up) in-creases (because of fatigue, boredom, and diminishing returns) as the perfor-mance increases. Letting c(x) denote the cost of performing x units, the as-sumption is equivalent to c′(x)⬎ 0.
In our simple model, we assume that people stop exerting effort or per-sisting when marginal costs equal marginal benefits. In essence, we assume that people are myopic—they only look one unit ahead and compare the marginal costs and benefits of performing that unit. We call this the myopic value model of goal setting or, as shorthand, the myopic value model. A formal version of the myopic value model is found in Wu, Heath, and Larrick (1998). Note that the myopic value model ignores the effect of expectancies and places all the explanatory burden on values. However, it will take us a long way toward explaining the empirical results on motivation.
Effort
Our analysis of individual effort parallels our earlier analysis of the Charles and David sit-up problems (Problems 4, 6, and 7). Based on our earlier analysis, it should be clear that the myopic value model predicts that: (i) when both individuals are below a goal, the individual closer to the goal will exert more effort (Problem 7); (ii) when both individuals are above the goal, the individual closer to the goal will exert more effort (Problem 6); (iii) when one individual is below a goal, and the other is above the goal by a similar amount, the individual who is below the goal will exert more effort (Problem 4).
These predictions are illustrated by the value functions depicted in Fig. 2. If the slope of the value function describes the marginal benefit of attaining an additional unit of performance, then people will be willing to exert higher effort (i.e., absorb higher costs) when marginal benefits are higher. This re-sult follows directly from our assumption that individuals equate marginal costs and benefits. Thus, to understand which individual is willing to incur
FIG. 3. Value functions for two individuals in first derivative (marginal) form: one with a goal of 30, b′30(x), and one with a goal of 40, b′40(x). The figure also depicts a sample marginal cost curve, c′(x). The individual with a goal of 30 will stop around 39 units, the individual with a goal of 40 will stop around 45 units.
higher costs and exert higher effort, we simply need to compare the slopes of the value function at a given level of performance.
Persistence
To explain why people with goals persist longer, it helps to think in terms of marginal costs and benefits. Figure 3 depicts the same curves depicted in Fig. 2, but in marginal terms (i.e., the curves in Fig. 3 show the first derivative—i.e., the slope—of the curves in Fig. 2). Figure 3 also depicts a sample marginal cost curve.
To understand persistence, we imagine a person asking herself on a contin-ual basis, ‘‘Should I continue with this task?’’ In answering the question, she weighs the additional costs of an extra unit of performance against the benefits, and she persists at the task until the marginal costs of continuing equal the marginal benefits. Graphically, this occurs where the marginal cost curve intersects the marginal benefit curve. Note that for the person with a goal of 30, the curves intersect at about 39 units, indicating that this person will stop after completing 39 units. For the person with a goal of 40, this occurs at about 45 units, indicating that this person will exceed her goal of 45, but will quit soon after.
In general, to understand intuitively why a higher goal might increase persistence, note that the marginal cost of achieving the nth unit does not depend on the goal whereas the marginal benefit does. People who set modest goals and exceed them soon find themselves in the domain of gains where marginal benefits decrease swiftly because of diminishing sensitivity.
Indi-viduals who set aggressive goals remain longer in the domain of losses where marginal benefits are high (because of loss aversion) and increasing (because of convexity).
Explaining Performance
How far can our simple myopic value model take us in understanding individual performance? When we explained effort and persistence above, it was clear that in many cases, higher goals lead individuals to exert higher effort and to persist longer. However, there were exceptions. How do effort and persistence combine to affect overall individual performance?
Performance is the result of work over time, and work depends on effort and persistence. To guide our analysis of performance, we have constructed a precise mathematical model that describes how the value function would simultaneously affect effort and persistence (Wu et al., 1998). The model predicts that if an individual performs above a specific goal, she would have performed even better if she had increased her goal slightly, but that if she performs below a goal, she would have performed better if she had lowered her goal slightly. The latter result conflicts with the recommendations of the goal setting literature, which has essentially claimed that (commitment held constant) higher goals are always better.
To compare the predictions of our simple myopic value model with the empirical results of the goal setting literature, it is important to note that we model a single individual faced with different goals, whereas the goal setting literature has averaged results over collections of individuals, each of whom has different abilities and therefore different costs of performance. Below, we first review the standard empirical results on collective performance, and then we use our model to explain these results.
Results on Collective Performance
In this section, we review the standard empirical results on collective per-formance. In doing so, we must address a confusing aspect of the literature on goal setting. It has traditionally distinguished two ‘‘kinds’’ of collective performance results even though the value function approach suggests that there is only one basic result.
In the goal setting literature, these two kinds of goal effects have been characterized by two experimental manipulations:
Goal difficulty. When researchers study goal difficulty, they manipulate
the difficulty of goals and measure how well people perform. The prototypi-cal study in this area compares three goals: low (90% objective probability of success), medium (50% success), and high (10% success), where objective probabilities are unknown to participants. Locke & Latham (1991) report that in 192 studies of goal difficulty, 91% have found that higher goals pro-duce higher performance.
Goal specificity. When researchers study goal specificity, they typically
give one group of subjects a specific, challenging goal and tell another group to ‘‘do your best.’’ Locke and Latham (1991) report that in 201 studies of goal specificity, 91% found that specific, challenging goals led to higher performance than vague, do your best goals.
Although the goal setting literature has traditionally distinguished the two kinds of results on goal difficulty and goal specificity, the value function approach suggests that these effects are identical. In the traditional study of goal difficulty, an experimenter assigns a low, medium, and high goal to different groups of subjects. This manipulation is clean and convincing. We argue, however, that the goal specificity manipulation is simply another means of manipulating goal difficulty. In the traditional study of goal speci-ficity, the experimenter gives one group of subjects a specific, challenging goal, and tells another group of subjects to ‘‘do your best.’’ The literature has assumed that this ‘‘do your best’’ instruction is less specific but equally difficult as the ‘‘specific challenging’’ goal (cf. Locke & Latham, 1990). We argue that this manipulation is unlikely to equate challenge because the spe-cific goals in previous studies are extremely challenging, with objective prob-abilities of success of only 15% or so (e.g., Locke, 1968, p ⫽.13; Camp-bell & Ilgen, 1976, p⫽.20; Frost & Mahoney, 1976, p⫽.14; Mossholder, 1980, p⫽.13). Because experimenters and field researchers set such extreme goals in the specific goal condition, it is likely that reference points in this condition are higher, on average, than any reference points people adopt in the ‘‘do your best’’ condition. Thus, the goal ‘‘specificity’’ manipulation is just another way of manipulating goal difficulty.
Our claim is supported by the conventional wisdom about methodology for such studies. Recently, in their book reviewing the field, Locke and La-tham (1990) summarized conventional methodological norms in their list of ‘‘guidelines for conducting successful goal setting studies.’’ They note that in studies that compare do your best with specific goals, a specific ‘‘goal that only 10% of the subjects can reach is usually difficult enough to produce reliable performance differences, but a 50% level of difficulty is not’’ (p. 349). Thus, specificity is not enough—specific goals do not work their magic if they are not also extremely challenging. Thus, we argue that the two performance results, which have been separated for years in the goal setting literature, are really distinguished only by two different experimental procedures for manipulating goal difficulty. Or, as we would say in the value function approach, they are distinguished by two different procedures that produce one reference point that is higher than another.
The question, then, is when collective performance is likely to increase as the reference point increases. In particular to understand the typical result in the literature, we need to be able to understand why collective performance increases when a goal (reference point) shifts from an objective 90% chance of success to a 50% chance and from a 50% chance of success to a 10%
chance. Together, these two shifts describe the explicit conditions of the typical ‘‘goal difficulty’’ study, and the latter shift describes the implicit conditions of the typical ‘‘goal specificity’’ study.10 If the myopic value model can explain why these two shifts increase performance, it can explain the majority of the empirical results in the literature.
Explaining the Collective Performance Results
Recall that the myopic value model predicts that if an individual performs
above a specific goal, she would have performed even better if she had in-creased her goal slightly; but that if she performs below a goal, she would
have performed better if she had lowered her goal slightly. With some rea-sonable assumptions, this model can explain why collective performance increases when a reference point shifts from a 90% level of difficulty to 50% and from 50 to 10%. In general, in applying our simple model to the aggre-gate results from a collection of individuals, the key question is whether the increased performance by individuals who are challenged by the higher goal overcomes the decreased performance by individuals who fall further behind their goal.
When a reference point increases so that objective success drops from 90 to 50%, the typical individual goes from performing above the goal to performing around the goal. According to our model, individuals who were originally performing above their goal should perform better when their goal increases, so 90% of individuals should increase their performance. The model predicts that the 10% who originally fell short of the low goal will perform worse under the higher goal, but this decrease by 10% is unlikely to offset the increase by the other 90%.
When the goal is raised so that success drops from 50 to 10%, the model again predicts that individuals who failed to reach the 50% goal will perform worse, while the individuals who exceeded the 50% goal will perform better. Here, the aggregate predictions of the model are somewhat less obvious be-cause approximately equal numbers of people decrease and increase their performance. Even so, the model predicts that average performance is likely to increase because the size of the performance decreases and increases are not likely to be symmetric.
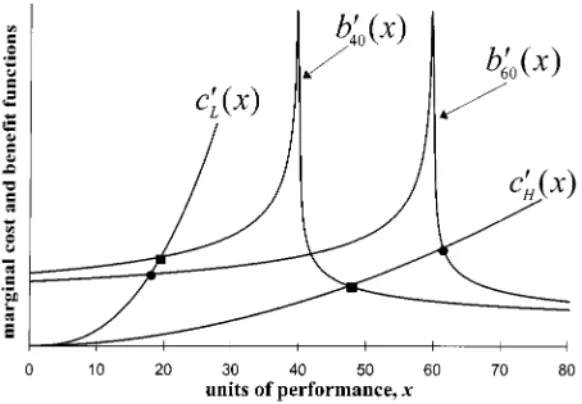
To illustrate the asymmetry between performance decreases and increases, consider Fig. 4, which contains the cost curves of two individuals who have different ability levels (the individual with lower ability has the steeper mar-ginal cost curve, c′L(x)). As predicted by our model, when the goal shifts out,
10Do your best goals may vary across individuals, but the evidence above suggests that individuals who are told to ‘‘do your best’’ on average set goals that correspond to a difficulty level of 50%. Otherwise, experimenters would not have trouble demonstrating performance differences when an experimenter assigns a specific goal with a 50% objective probability of success (Locke & Latham, 1990, p. 349).
FIG. 4. Marginal cost curves for a low ability individual, c′L(x), and a high ability
individ-ual, c′H(x), and marginal value functions for goals of 40 and 60. Note that as the goal shifts
from 40 to 60, the low ability individual performs slightly worse, while the high ability individ-ual performs substantially better; thus, the mean and variance of performance increases as the goal moves from 40 (squares) to 60 (circles).
the low ability individual decreases performance but the high ability individ-ual increases performance. Note, however, that the model predicts that the two effects are not symmetric in size—the low ability individual decreases performance slightly, while the high ability individual increases performance conspicuously. Combining the slight decrease with the conspicuous increase, average performance increases. This example illustrates a general principle. Low ability individuals experience high costs when they exert effort, so they are relatively insensitive to changes in goal-induced benefits. On the other hand, high ability individuals have lower costs when they exert effort, so they more readily adapt their level of effort and persistence to capture the benefits that are available. Note that one prediction of the myopic value model is that the variance of performance should increase as goals increase (e.g., compare the variance of the circles to the variance of the squares). Indeed, many studies in the goal literature have documented this pattern (Locke & Latham, 1990, p. 51).
The discussion above suggests that even the simple myopic value model can explain most of the standard empirical results on goal difficulty and goal specificity. However, there are reasons to believe that the simple model might, in some situations, need to be expanded to include expectancies. To provide an example of a result that may be difficult for the simple model to explain, consider Garland (1985), who asked participants to generate novel uses for a variety of common objects under low ( p⫽93%), moderately high ( p ⫽ 20%), or very high ( p ⫽ 1%) goals. The means in each condition differed significantly with higher goals producing higher performance. The
prediction of the simple model is less plausible here than in the typical study in the literature because when the 20% goal is compared to the 1% goal, an increase in performance by 20% of participants must overcome a decrease in performance by the remaining 80%. However, consistent with our model, the variance of performance under the 1% goal is 75% higher than the variance under the 20% goal ( p⬍.05 by F test). In order to assess the quality of the predictions of our model (and those of other individual models that have been proposed in the literature), future goal setting studies should report aspects of the distribution of performance in addition to the mean. For example, although averages are hard to interpret, the predictions of individual models are easier to confirm or deny with information about median performance.
To summarize, the simple myopic value model parsimoniously explains many of the results in the literature. However, if it needs to be expanded, the logical candidate is to relax the myopia assumption and add expecta-tions—people surely look forward more than one unit when they are weighing the costs and benefits of continuing to perform. Whether research-ers prefer to use the simple myopic value model or some elaboration, our work suggests that the value function is a useful way of modeling how people experience outcomes. When goals serve as reference points, individuals per-ceive outcomes differently in a manner predicted by the value function, and this affects not only the cognitive processes that guide their choices, but also their motivation to work hard, persist, and perform. Thus the value function serves to bridge the gaps between the cognitive literature on decision making and the motivational literature on goals.
GENERAL DISCUSSION
The Prospect Theory value function allows us to understand how basic cognitive processes translate into basic motivational processes like affect, effort, persistence, and performance. The first section of the paper demon-strated that goals inherit the properties of the value function (e.g., they serve as reference points and display loss aversion and diminishing sensitivity). In the second section of the paper, we used the properties of the value func-tion to explain the empirical results of hundreds of studies in the goal setting literature on motivation.
In this section, we consider the advantages and disadvantages of the value function approach as well as some simple extensions of the approach to ad-dress the question of how individuals set goals for themselves. We conclude by proposing that a value function analysis of goals could be extended to a variety of non-status quo reference points.
Further Implications of the Value Function for Goals
The two major advantages of the value function approach are precision and parsimony; it makes clear predictions and the predictions follow from
a small number of assumptions. In contrast, the other major theories of goal setting are not always precise (e.g., many are silent about the majority of our word problems) or parsimonious (i.e., they rely on various combinations of value, expectancy, and commitment).
Precision. The major benefit of precision is that it allows researchers to
make a variety of new behavioral predictions. We illustrate this precision by elaborating on one prediction that we mentioned previously and one that is new.
We have already mentioned the ‘‘starting problem,’’ the idea that high goals might be demotivating because they make it difficult for people to discern progress toward their goals. The starting problem follows directly from diminishing sensitivity away from the goal. The value function allows researchers to make a variety of related predictions about subgoals, a promis-ing area for future goal research. The study of subgoals might get a head start by borrowing from research in ‘‘mental accounting’’ (Thaler, 1985) which has shown that the valuation of transactions depends on whether the transactions or aggregated or segregated.
A second prediction of the value function approach is that performance will cluster around (or ‘‘pile up’’) around difficult but attainable goals (Wu et al., 1999). The intuition for piling up is straightforward. When people are below their goals, they receive high benefits from removing a ‘‘loss,’’ and these high benefits are sufficient to encourage them to exert continued effort. However, once they reach their goal and enter the domain of gains, the mar-ginal benefits of additional performance will be substantially smaller. At that point, they are likely to quit, leading performance to pile up in the near neighborhood of the goal.
Parsimony. The value function approach is not only more precise, it is
also more parsimonious than existing models which frequently invoke, not only values, but also expectancies, commitment and other factors. Of course, behavior is sufficiently complex that any parsimonious model will fail to account for some results. In this paper, we have pushed our analysis as far as possible by considering only values and not expectations. Although it might be possible to account for other findings by incorporating expectations, the costs of extending the model may be high. For example, adding expecta-tions dramatically complicates the possibility of deriving mathematical re-sults like the ones that underlie our discussion of the myopic value model. If the simple model explains the majority of the data, then the additional explanatory power of adding expectations may not be worth the cost.
Dynamic goals. Finally, the value function approach provides some insight
into how people may set goals dynamically to regulate their own motivation. Recall Problem 2: Our participants felt that Alice would be less satisfied than Betty even though she scored four points higher than the exam. Even though Alice is less satisfied, many people might prefer to be her rather than Betty. The current myopic value model can explain why Alice performs
bet-ter yet feels worse, but it does not explain why individuals might prefer to be Alice.
A broader application of the value function would allow people to shift their attention from one reference point to another. By doing so, individuals may solve conflicts like Alice’s between absolute and relative performance. For example, during a task and perhaps immediately after, individuals may pay attention to the reference point specified by their goal, whereas in the long run, they may shift their attention back to their former status quo refer-ence point and attend to absolute performance. Our observation here echoes Lewin et al. (1944) who suggested that individuals may attend to their start-ing point, their previous performance, or others’ performances, in order to overcome their potential sense of failure relative to their aspirations. In gen-eral, we feel that the key theoretical question about goal setting is how people strategically allocate their attention among various reference points and how their attention may change over time as they perform and complete their tasks.
Non-Status Quo Reference Points and Reference Point Selection
The fact that goals serve as reference points and inherit the properties of the value function suggests that other possible comparisons may also serve as reference points and may demonstrate similar effects. Although most re-search has focused on the status quo as a reference point, some has explicitly applied the reference point concept to other types of non-status quo compari-sons (Boles & Messick, 1995; Larrick & Boles, 1995; Loewenstein, Thomp-son, & Bazerman, 1989; Thaler, 1985). Goals are intriguing because they are clearly non-status quo reference points. They change how outcomes are valued despite the fact that they may never be a ‘‘status quo,’’ i.e., ‘‘an existing state or condition’’ (Webster’s New Universal Dictionary, 1994). This suggests that a wide variety of other non-status quo comparisons, all of which involve varying degrees of mental simulation (Kahneman & Miller, 1986; Kahneman & Tversky, 1982; Roese & Olson, 1995), may serve as reference points and alter the value of outcomes according to the value func-tion. For example, researchers have appealed to the value function to explain the effects of aspirations (Payne et al., 1980, 1981), social comparisons (Loewenstein et al., 1989), and foregone alternatives (Boles & Messick, 1995; Larrick & Boles, 1995).
Although the literature provides precedents for applying the value function to non-status quo comparisons, these precedents are the exception rather than the rule. Most research on aspirations, expectations, social comparisons, and foregone alternatives has not specified how these potential reference points alter how people perceive value. All of these areas might benefit from consid-ering the value function more systematically. As an illustration, in our ongo-ing work we have applied the value function to the social comparison litera-ture. The social comparison literature has been concerned with two types of