PROBING STAR FORMATION AT LOW AND
HIGH REDSHIFT WITH ZEUS, A NEW
SUBMILLIMETER GRATING SPECTROMETER
A Dissertation
Presented to the Faculty of the Graduate School of Cornell University
in Partial Fulfillment of the Requirements for the Degree of Doctor of Philosophy
by
Steven Hailey-Dunsheath May 2009
c
2009 Steven Hailey-Dunsheath ALL RIGHTS RESERVED
PROBING STAR FORMATION AT LOW AND HIGH REDSHIFT WITH ZEUS, A NEW SUBMILLIMETER GRATING SPECTROMETER
Steven Hailey-Dunsheath, Ph.D. Cornell University 2009
We have detected emission in the J = 6 → 5 transition (λ = 453µm) of the carbon monoxide isotopologue 13CO from the starburst nucleus of the nearby
galaxy NGC 253. This is the first extragalactic detection of this transition, which traces the warm, dense molecular gas found in regions of massive star forma-tion. An excitation analysis of the CO line strengths measured here and ob-tained from the literature finds that ≈ 35% − 60% of the molecular gas mass (MH2 ≈ 2.9×10⁷ M
⊙) in the nuclear region is both warm (T ∼ 110K) and dense
(nH2 ∼ 104cm−3). We find that the gas is most likely heated either by an elevated
density of cosmic rays, or by the dissipation of supersonic turbulence. As both of these heat sources are the result of stellar feedback within the starburst, our analysis suggests that the starburst may be self-limiting.
We also present the detection of emission in the 2P
3/2 → 2P1/2 transition
(λ = 158 µm) of ionized carbon from MIPS J142824.0+352619, an extremely lu-minous star-forming galaxy atz = 1.325. We combine this measurement with existing observations of the far-infrared continuum and CO emission to esti-mate that the bulk of the molecular gas in this galaxy is dense (nH2 ∼ 104 cm−3),
and is illuminated by an ambient far-ultraviolet radiation field ∼ 1000 times more intense than the mean field measured in our Galaxy. These are similar conditions as experienced by the molecular gas in the starburst nuclei of nearby galaxies, and suggests that this source may be modeled as a scaled-up version
of a starburst nucleus. The large star formation rate and molecular gas reser-voir indicate that MIPS J142824.0+352619 is likely the progenitor of one of the population of massive elliptical galaxies seen in the local Universe.
These observations were made with ZEUS, a new direct-detection grating spectrometer operating at the Caltech Submillimeter Observatory. ZEUS is a broad-band spectrometer providing a resolving power ofλ/∆λ∼1000across the
350µm and450µm telluric windows. It uses a1×32semiconductor bolometer array oriented along the dispersion direction, and is configured to simultane-ously provide a 16 pixel spectrum covering ∆ν ∼ 10 GHz in each of the two windows. The current sensitivity is within a factor of ≈ 1.2 and ≈ 1.3 of the background photon limit at the centers of the350µm and450µm bands, respec-tively, and this superb sensitivity coupled with the large instantaneous band-width make ZEUS an excellent tool for the observation of extragalactic spectral lines. Here we describe the design, construction, characterization, and imple-mentation of this new instrument.
BIOGRAPHICAL SKETCH
Steven James Hailey-Dunsheath was born to John Dunsheath and Ann Hai-ley in Davenport, IA on May 7, 1979. Careful analysis of photographic evidence shows that he was an adorably rotund child, whose appearance suggested to some a likeness to a large chunk of cheese. He has one sibling, an older sis-ter named Megan, who thanklessly looked afsis-ter the well-being of her younger brother throughout his childhood.
After matriculating from Davenport West High School, Steven moved 120 miles west to attend Grinnell College in Grinnell, IA. There, he pursued a lib-eral arts education by taking classes in numerous subjects, but developed a keen interest in physics. A summer working as a researcher for Professor Robert Cad-mus at the school’s Grant O. Gale observatory sparked an interest in astronomy. Hours spent writing code and digging through low signal to noise data, and long nights waiting for the clouds to clear, helped prepare him for the realities of scientific research. While at Grinnell, Steven also worked diligently on his billiards game, played the occasional midfield on the school soccer team, and celebrated the minor victories in life with inexpensive beer. It was during his time at Grinnell that Steven was lucky enough to meet and successfully woo his current and future partner in all things, Lara Ratzlaff. Steven graduated with honors in May of 2001 with a Bachelor of Arts in Physics.
In September of 2001, Steven accepted a position as a technician in the As-tronomy Department at Cornell University in Ithaca, NY. Working in the lab of Gordon Stacey, Steven began designing and building ZEUS, a project he de-cided to see to fruition by joining the department as a graduate student in the fall of 2002. The next six years are mostly remembered by Steven as a blurry melange of coffee, coursework, cursing, and cryogens. But after 7 observing
runs, 5 conferences, 4 apartments, 2 automobiles, and a quick trip to the South Pole, Steven was ready to set off from Ithaca and move on to his next adventure. January 2009 will find him in Munich, Germany, where he will join the Infrared and Submillimeter group at the Max Planck Institute for Extraterrestrial Physics. In his free time he hopes to travel, develop his Maß-curling abilities, and track down the perfect Br ¨otchen.
This dissertation is dedicated to Lara, whose support and encouragement made it possible.
ACKNOWLEDGEMENTS
This work was made possible by the efforts of many individuals, and it is my pleasure to acknowledge their contributions. Firstly I thank my advisor, Gordon Stacey, for entrusting the construction of his newly-funded spectrometer to a youngster with little experience. I have learned a great deal about submillimeter instrumentation and astrophysics from working with Gordon, but perhaps the most important lessons have concerned the fine art of knowing when a project is finished. I will always remember that “the enemy of good is better”, and that if “you can’t see it from a trotting horse, don’t worry about it.” Thomas Nikola has been heavily involved in all aspects of this project, from the early design work to the scientific publication, and without his superhuman efforts the sub-millimeter group would cease to function. Steve Parshley built the instrument mount and the control unit for the3He refrigerator, and has saved the day on
many occasions with last-minute machining jobs. Tom Oberst constructed the data acquisition hardware, and despite having little programming experience, wrote the acquisition and reduction software as well. Carl Ferkinhoff built the stepper motor controller as an undergraduate summer student, and as a grad-uate student was on hand to help guide the instrument through a particularly chaotic, but eventually fruitful, observing run.
I also received a great deal of help from the many knowledgeable people on the 2nd floor of Space Sciences. Terry Herter educated me on the fundamentals
of optical design, and Luke Keller undertook the unenviable task of teaching me Zemax. In addition to providing the instrument with a dewar, George Gull helped me with many aspects of the mechanical design and answered my many AutoCAD questions. I learned everything I know about pumping down a de-war from Chuck Henderson, who also taught me how to work with cryogenic
wiring, and how to find the humor present in any situation.
I also owe thanks to Harvey Moseley, Christine Allen, Dominic Benford, and Johannes Staguhn at NASA Goddard Space Flight Center for providing us with an excellent detector array, and to Johannes for helping us troubleshoot some electrical issues at the telescope. The essential filters were fabricated by Peter Ade and Carole Tucker at Cardiff University. I also thank the CSO staff, and in particular the day crew: Ed, Steve, Pat and Allen, for make the ZEUS imple-mentation a top priority. Lastly I thank my committee members Riccardo Gio-vanelli, Robert Brown, and Eanna Flanagan, for their many helpful comments on an earlier draft of this manuscript.
On the personal side, I also thank Harvey and Karen for the home cooking and good cheer that kept me going while I finished up, and Mom, Dad, and Megan, for their love and support throughout.
I would not have succeeded in this work without the unwavering support of Lara, who stood with me through the many highs and lows of this long journey, displaying a compassionate understanding that still amazes me. I dedicate this dissertation to her.
TABLE OF CONTENTS
Biographical Sketch . . . iii
Dedication . . . v
Acknowledgements . . . vi
Table of Contents . . . viii
List of Tables . . . xi
List of Figures . . . xii
1 Introduction and Overview 1 2 Background and Scientific Motivation 3 2.1 Photodissociation Regions . . . 3
2.1.1 [CI] Observations . . . 7
2.1.2 Mid-J CO Observations . . . 8
2.2 Observing Program . . . 10
2.2.1 Starburst Galaxies . . . 11
2.2.2 Ultraluminous Infrared Galaxies . . . 12
2.2.3 Luminous, Dusty Galaxies at High Redshift . . . 14
2.2.4 First Sources: NGC 253 and MIPS J142824.0+352619 . . . . 18
3 Instrument Overview: Optical and Cryogenic Design 20 3.1 Introduction . . . 20
3.1.1 Coherent vs. Direct-Detection . . . 20
3.1.2 Spatial vs. Spectrally Multiplexing . . . 22
3.2 Grating Design . . . 22
3.3 Optics . . . 26
3.4 Dewar . . . 27
3.5 3He Refrigerator . . . . 29
3.6 Filtration . . . 34
4 Detectors and Electronics 36 4.1 Introduction . . . 36
4.2 Implementation . . . 37
4.3 Electronics and Software . . . 38
4.4 Bolometer Characterization . . . 39
4.4.1 Dark Load Curves . . . 41
4.4.2 Unblanked Load Curves . . . 42
4.5 System Transmission . . . 48
4.6 Noise Contributions . . . 51
4.6.1 Photon Noise . . . 51
4.6.2 Detector Noise . . . 53
4.6.3 Amplifier Noise . . . 54
4.7 Sensitivity Estimate . . . 56
4.7.1 Comparison with the Background Limit . . . 58
4.7.2 Comparison with Heterodyne Receivers . . . 59
5 Beam Coupling and Calibration 61 5.1 Beam Coupling . . . 61
5.1.1 Coupling Terms and Definitions . . . 61
5.1.2 Estimate ofηtel . . . 62
5.1.3 Estimate ofηfss. . . 63
5.1.4 Contributions toηfss . . . 65
5.1.5 Beam Mapping . . . 67
5.2 Calibration . . . 70
5.2.1 Flux Calibration . . . 70
5.2.2 Spectral Calibration . . . 72
5.2.3 Sky Subtraction . . . 73
6 The Warm, Dense Molecular Gas in the Starburst Nucleus of NGC 253 75 6.1 Introduction . . . 75
6.2 Observations . . . 76
6.3 Results: CO Excitation Analysis . . . 77
6.3.1 LVG Model . . . 77
6.3.2 High Excitation Component . . . 80
6.3.3 Low Excitation Component . . . 83
6.3.4 Comparison with Atomic Gas . . . 83
6.4 Discussion: What Heats the Gas? . . . 85
6.4.1 X-Rays . . . 85
6.4.2 Cosmic Rays . . . 86
6.4.3 Shocks . . . 86
7 Photodissociated Molecular Gas in MIPS J142824.0+352619 89 7.1 Introduction . . . 90
7.2 Results . . . 94
7.2.1 [CII], CO, and the FIR Continuum: A Comparison to Star-burst Galaxies . . . 94
7.2.2 PDR Analysis . . . 97
7.2.3 Comparison to M82: MIPS J1428 as a Scaled-Up Starburst Galaxy . . . 103
7.3 Discussion . . . 105
7.3.1 [CII], CO, and the FIR Continuum: A Comparison with ULIRGs . . . 105
7.3.2 [CII] Emission from High-Redshift Quasars . . . 108
7.3.3 An Extended Starburst? . . . 109
7.3.4 Evolution of High-Redshift Galaxies: Connection to Mas-sive Ellipticals . . . 113
7.4 Conclusions . . . 113
A Large Velocity Gradient 115
LIST OF TABLES
2.1 Selected Extragalactic Probes Available to ZEUS . . . 10
2.2 Redshift Coverage for Far-Infrared Fine-Structure Line Observa-tions with ZEUS . . . 16
3.1 ZEUS Resolving Power . . . 26
3.2 Elements in the ZEUS Optical Train . . . 35
4.1 ZEUS Bolometer Parameters . . . 44
4.2 ZEUS/CSO Sensitivity . . . 57
5.1 ZEUS/CSO Beam Parameters . . . 70
6.1 NGC 253 CO Line Intensities . . . 81
LIST OF FIGURES
2.1 PDR Schematic . . . 5
2.2 Star Formation History of the Universe . . . 17
3.1 Submillimeter Atmospheric Transmission . . . 23
3.2 ZEUS Grating Efficiency . . . 25
3.3 ZEUS Optical Layout . . . 28
3.4 ZEUS Cryostat . . . 30
3.5 3He Refrigerator . . . . 32
4.1 ZEUS Electronics Schematic . . . 40
4.2 Dark Load Curves . . . 43
4.3 Unblanked Load Curves . . . 46
4.4 Full System Optical Transmission . . . 49
5.1 ZEUS/CSO Skydips . . . 64
5.2 ZEUS/CSO Beam Map . . . 69
6.1 HCNJ =1→ 0and 6 cm Maps of NGC 253 . . . 78
6.2 NGC 253 CO Spectra . . . 79
6.3 CO Rotational Level Diagram . . . 80
6.4 Results of LVG Analysis . . . 84
7.1 MIPS J142824.0+352619[CII]Spectrum . . . 90
7.2 LFIR/L′COvs. LFIRin Local and High-Redshift Galaxies . . . 93
7.3 Y[CII]vs. YCOin Nearby Galaxies . . . 96
7.4 PDR Ratio Plot: CO(3→2)/CO(2→1) . . . 98
7.5 PDR Ratio Plot: [CII]/FIR continuum . . . 100
7.6 PDR Plot: Absolute[CII]Intensity . . . 101
7.7 Y[CII]vs. YCOfrom ISO . . . 107
CHAPTER 1
INTRODUCTION AND OVERVIEW
In a normal spiral galaxy like our own about 90% of the baryonic mass is contained in stars, and the rest is distributed in the gas and dust that comprise the interstellar medium (ISM). About 1% of the ISM mass is in dust, and the rest in gas distributed in one of a few distinct components. Most of the gas is atomic, divided between the warm neutral medium (WNM) withn ∼ 0.5cm−3
and T ∼ 8000 K, and the cold neutral medium (CNM) with n ∼ 30 cm−3 and T ∼ 80K. These two phases represent the two dynamically stable solutions for gas in pressure equilibrium atP/kB ≈3×103 cm−3K. A small fraction of the gas
is ionized, found in the warm ionized medium (WIM) withn andT similar to the WNM, and in the low density, hot ionized medium (HIM) that fills most of the galactic volume. Ionized gas is also found in the transient HII regions that form near massive stars.
The second most massive reservoir of gas is the molecular component, most of which resides in massive (M ∼ 105 M
⊙) Giant Molecular Clouds (GMCs).
Unlike the atomic clouds, these GMCs are self-gravitating, resulting in internal pressures as high as P/kB ∼ 107 cm−3 K. The large columns of dust mixed with
the gas shield the clouds from UV radiation, allowing the interiors to cool, and it is the cold (T ∼ 10K), dense (n∼106cm−3) cores at the centers of GMCs that
con-dense to form stars. The stellar radiation emerges as infrared dust continuum and gas cooling line emission, and we use observations of this line emission to probe the physical conditions of the gas, and to infer the intensity of the stellar radiation fields.
in the starburst nucleus of the nearby galaxy NGC 253, and in the distant lumi-nous infrared galaxy MIPS J142824.0+352619. This work is made possible by observations conducted with the redshift (z) and Early Universe Spectrometer (ZEUS), a new submillimeter wavelength spectrometer. The design, construc-tion, and implementation of this instrument required a considerable amount of time and effort on the part of myself and the ZEUS team, and occupies a large portion of this dissertation, which is organized as follows. In chapter 2 we pro-vide the scientific background and motivation for this project. In chapter 3 we describe the spectrometer and cryostat, in chapter 4 the detectors and electron-ics, and in chapter 5 the optical coupling to the telescope and sky. In chapter 6 we present our13COJ =6→ 5detection from NGC 253, model the excitation of
the molecular gas, and discuss potential heat sources. In chapter 7 we present our detection of the [CII] 2P
3/2 → 2P1/2 fine-structure line from the z = 1.325
luminous infrared galaxy MIPS J142824.0+352619, obtain estimates of the gas density and the strength of the ambient stellar radiation field, and discuss the implications.
CHAPTER 2
BACKGROUND AND SCIENTIFIC MOTIVATION
We have constructed a submillimeter wavelength spectrometer, ZEUS, to study the gas-phase ISM in star-forming galaxies at low and high redshift. Nearby systems will be observed in the 370 µm [CI] fine-structure transition, and in the mid-J1CO rotational transitions. High-redshift galaxies will be stud-ied through observations of far-infrared fine-structure line emission, particu-larly in the [CII] 158 µm transition. We begin this introductory chapter with a description of photodissociation regions (PDRs), which produce most of the [CII] emission in galaxies, and also emit strongly in the [CI] and CO transitions. We then outline our observing program to study local starburst galaxies, Ultra-luminous Infrared Galaxies, and dusty galaxies at high redshift, and describe how ZEUS observations will be used to address some of the key questions con-cerning these systems.
2.1
Photodissociation Regions
When massive stars are formed near a molecular cloud, their ultraviolet (UV) radiation strongly affects the thermal and chemical properties of the cloud sur-face. The incident far-UV (FUV; 6 eV < hν < 13.6 eV) flux photodissociates the gas in the outer layer, and photoionizes the species such as carbon which have ionization potentials less than 13.6 eV. The gas in this region is heated to high temperatures by photoelectric heating, in which ∼ 1% of the FUV radia-tion absorbed by dust produces energetic electrons which collisionally heat the gas. Somewhat deeper into the cloud the gas becomes molecular, but still has
1In this chapter we use the term ’mid-J’ to describe transitions withJ
a higher temperature than in the FUV-shielded core. The result is that the sur-face of the molecular cloud is transformed into a region of warm atomic and molecular gas that produces bright cooling line emission.
Detailed photo-chemical PDR modeling was first done by [120], who con-sider FUV radiation incident on a uniform density slab. This basic model has been subsequently refined by many groups to account for such effects as clumpy density structure and time-dependent chemistry (for a comparison of the many PDR codes see [97]), but it is sufficient to capture the important physics, and we describe it here. A PDR schematic is presented in Figure 2.1, which shows the gas temperature and the states of hydrogen, carbon, and oxygen as a func-tion of depth into the cloud. The penetrafunc-tion of FUV photons is limited by dust extinction, and the natural unit for describing the position in the PDR is the cor-responding visual extinction,AV, measured from the ionic/atomic transition. At
smallAV the carbon is ionized, and photoelectric heating raises the gas tempera-ture toT ∼100−1000K, depending on the incident FUV flux (parameterized as
FFUV=G0×[1.6×10−3]ergs cm−2s−1) and the gas density (n). AtAV ≈4the FUV
energy density is sufficiently reduced that carbon becomes neutral, and there is a sharp C+/C0/CO transition. Since oxygen is more abundant than carbon in
the ISM, the oxygen not bonded into CO remains atomic untilAV ≈10, where it
forms O2and the PDR formally ends.
At AV . 6the gas is heated by photoelectric heating, in which a fraction of the FUV photons absorbed by dust grains and PAH molecules cause the ejection of an energetic electron, which collisionally heats the gas. The efficiency of this heating process is negatively correlated with the grain charge; at higher grain charges the work function (and the ionization potential of the PAH molecules)
Figure 2.1: Schematic diagram of a photodissociation region from [51]. increases, and a smaller fraction of the FUV energy is transferred to the gas. Higher gas densities increase the electron recombination rate and decrease the net charge of the grain, such that the grain charge is determined by the ratio
G0/n, with higher ratios resulting in lower gas heating efficiencies. At smallAV
the cooling is dominated by emission in the [CII] 158µm and the [OI] 63µm fine-structure lines, so the fraction of the bolometric emission contained in these two lines is equal to the gas heating efficiency, and traces the ratioG0/n. The [OI] 63 µm transition has a higher excitation potential and a higher critical density2than
the [CII] transition, such that theF[OI]/F[CII]ratio increases for hotter (higherG0)
or denser PDRs. Beyond the C+/C0/CO transition the rotational lines of CO
dominate the gas cooling. At the transition the gas temperature is T ∼ 100 K
2Density at which the spontaneous emission rate matches the collisional de-excitation rate.
At densities lower thanncrit each collisional excitation is followed by a radiative decay, such
that the intensity is proportional to the collisional excitation rate, which scales asn2. At densi-ties higher thanncritthe energy levels are populated according to thermal equilibrium, and the
and the mid-J states are populated, resulting in strongJ = 6→5and J = 7→6
emission.
One of the best studied Galactic PDRs is found in the Orion star-forming re-gion, at the interface between the M42 nebula and the background GMC. This region provided the first detections of the [CII] and [OI] fine-structure lines, and was subject to the first detailed PDR modeling [119, and references therein]. FUV emission from the Trapezium stars at a distance of ≈ 0.1−0.2pc in front of the molecular cloud illuminates the neutral gas with a flux characterized by
G0 ∼ 105, heating the gas to a peak temperature of∼ 500 K. The fine-structure
line radiation from the primary coolants is well modeled by a PDR with a gas density ofn∼105cm−3. Mapping of the [CII] emission over the interface region
shows that it correlates well with the CO J = 1 → 0distribution, further sup-porting the conclusion that the [CII] emission arises from the photodissociated surface of the molecular cloud [110].
PDR models are generally successful at modeling the observed emission from star-forming regions, particularly the intensities of the dominant [CII] and [OI] coolants, and their ratio with the far-infrared (FIR) continuum. Averaged over a galaxy, an important fraction of the total ISM is estimated to be traced by the [CII]-emitting regions of PDRs. For nearby spiral galaxies, [109] estimate that these regions account for3%−15%of the total molecular gas mass, while for starburst nuclei this increases to as large as ≈ 40%. In addition to PDRs, [CII] emission may arise from diffuse atomic gas, atomic clouds, compact HII regions, and extended low-density HII regions, but on a galactic scale the PDR component is expected to dominate [15, 109].
2.1.1
[CI] Observations
Neutral carbon in the electronic ground state produces emission in two fine-structure transitions: the3P
2 → 3P1 (λ = 370 µm) transition connects the J = 2
and J = 1excited states, and the3P
1 →3P0 (λ= 609µm) transition connects the J = 1state to the J = 0ground level. Plane-parallel PDR models predict that emission in both lines will arise from a narrow region at the C+/C0/CO
tran-sition, located at a depth of AV ≈ 4into the neutral gas. The first observations
of [CI](1 → 0) in Galactic molecular clouds found emission which was much more widespread than expected, however, suggesting that C0 is well mixed in
molecular cloud interiors [93, 61, 62]. One explanation for this extended [CI] emission is that molecular gas is clumpy, such that UV photons penetrate the cloud to larger mean optical depths than would be predicted for a homoge-neous medium [113]. In some of these systems, such as M17 SW and Orion A, the [CII] emission is similarly extended, supporting this picture of enhanced UV penetration through a clumpy medium [113, 110].
Observations of the Galaxy and nearby galaxies have shown that the to-tal emission in the [CI] lines is comparable to that in the CO transitions, thereby demonstrating the importance of C0 as a global coolant [25, 32]. The
first detections of the [CI](1 → 0) transition in the nearby starburst galax-ies M82 and NGC 253 were used to derive abundance ratios of [C0]/[CO] ∼ 0.5 [101, 125, 45, 58, 44], much larger than the value of ∼ 0.1 measured in Galactic molecular clouds [128]. More recent observations of a larger sample of galaxies have shown that [C0]/[CO]∼ 1 may be a common feature of galactic
nuclei [57]. One possible explanation of this enhanced abundance ratio is that the [CI] and CO emission in galactic nuclei arise in regions which are not as well
shielded from UV radiation as are the dense cores in Galactic molecular clouds, such that a larger fraction of the CO is photodissociated [57]. A second expla-nation is that the emission arises in gas with a high ionization fraction, which may drive the chemistry to equilibrium with a large [C0]/[CO] value [45, and
references therein].
Most observations of neutral carbon utilize the [CI](1→ 0) transition, which is easier to detect with the currently available instrumentation. However, ob-servations of the [CI](2 → 1) transition have shown that the ratio of the two lines is a sensitive probe of the physical conditions of the gas. Both lines have modest critical densities (ncrit ≈ [0.3−1.1]× 103 cm−3), and are therefore often
thermalized in molecular clouds (nH2 & 103 cm−3). They arise from states with
energy levels 24 K and 62 K above ground, such that their ratio is sensitive to the gas temperature ifT .100K. The first observations of [CI](2→ 1) in Galac-tic molecular clouds were combined with previous detections of [CI](1 → 0) to show that both lines are likely optically thin, and that the excitation tempera-tures areTx ≈30−80K [128]. The two lines have been measured simultaneously
in M82 [112], and the large ratio indicatesTkin > 50K andn & 104 cm−3. Aside
from M82, however, [CI](2→1) has been detected in only a few galaxies (in the local Universe) [2, 3], so the excitation of neutral carbon in galaxies has yet to be fully characterized.
2.1.2
Mid-J CO Observations
The J = 6 → 5 and J = 7 → 6 transitions of CO arise from states with energy levels 116 K and 155 K above ground and have critical densitiesncrit ≈ 3× 10⁵
cm−3, and are thus sensitive probes of warm, dense molecular gas. The layer of
warm CO found at the C0/CO transition in dense PDRs is expected to produce
bright mid-J CO emission. This can be seen in observations of COJ =7 → 6in the Orion molecular cloud and interface region, in which theJ =7→6intensity peaks at the interface region and shows a good spatial correspondence with the
J = 1 → 0and [CII] maps. Velocity resolved studies of the interface show that the J = 7 → 6, J = 1 → 0, and [CII] lines also have similar spectral profiles, strongly suggesting a common PDR origin for all 3 tracers [102, 110, 53].
In addition to the FUV-heated gas in PDRs, shock-heated gas may also pro-duce strong mid-J CO emission. Stellar outflows in the massive star forma-tion regions W51 and DR 21 produce luminous, broad-lined CO J = 7 → 6
emission that dominates over the narrow-lined PDR component [59]. The CO
J = 7 → 6 emission from the circumnuclear disk in the Galactic center also arises in dynamically-heated gas, in this case by the dissipative decay of turbu-lence [9].
The FIRAS experiment on the Cosmic Background Explorer (COBE) satellite detected emission in the CO J = 1 → 0 through J = 8 → 7 transitions in the central region of the Galaxy, and found that the brightest line wasJ =4→3[25]. The density and kinetic temperature required to significantly populate a CO rotational level both increase with J (see Fig. 6.3), such that the brightest CO transition in a system is a reflection of the gas excitation. A recent study of the CO cooling curves in a sample of nearby galaxies found that the brightest CO transitions areJ= 4→3and J= 5→4in normal galactic nuclei [3], suggesting similar excitation as in the Galaxy. The ISM in the centers of starburst galaxies is more highly excited, such that theJ= 6→5and J =7→6transitions are the
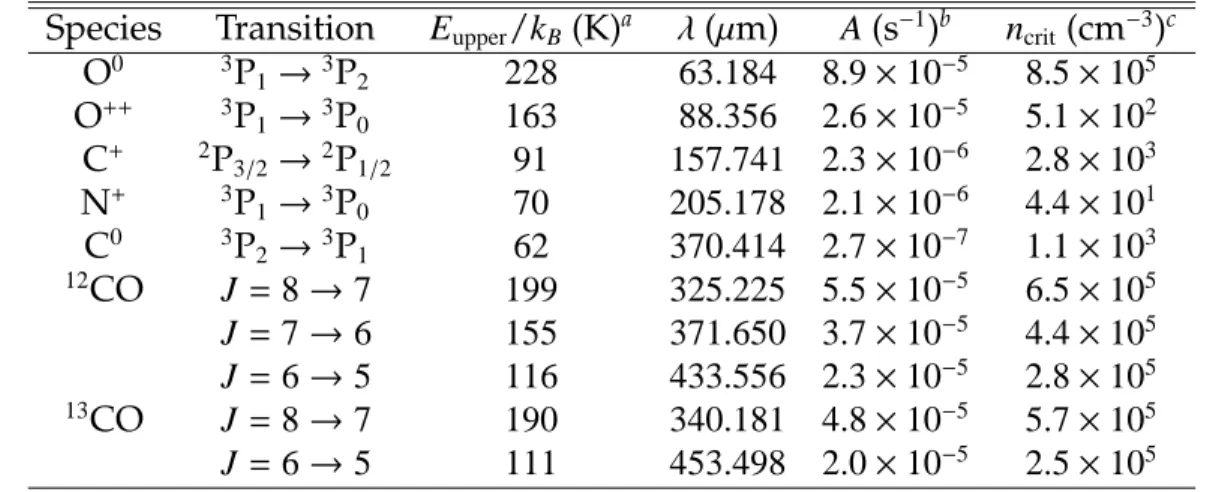
Table 2.1: Selected Extragalactic Probes Available to ZEUS
Species Transition Eupper/kB(K)a λ(µm) A(s−1)b ncrit(cm−3)c
O0 3P
1→3P2 228 63.184 8.9×10⁻⁵ 8.5×10⁵
O++ 3P
1→3P0 163 88.356 2.6×10⁻⁵ 5.1×10²
C+ 2P
3/2→2P1/2 91 157.741 2.3×10⁻⁶ 2.8×10³
N+ 3P
1→3P0 70 205.178 2.1×10⁻⁶ 4.4×101
C0 3P
2→3P1 62 370.414 2.7×10⁻⁷ 1.1×10³ 12CO J
= 8→7 199 325.225 5.5×10⁻⁵ 6.5×10⁵
J= 7→6 155 371.650 3.7×10⁻⁵ 4.4×10⁵ J= 6→5 116 433.556 2.3×10⁻⁵ 2.8×10⁵ 13CO J
= 8→7 190 340.181 4.8×10⁻⁵ 5.7×10⁵
J= 6→5 111 453.498 2.0×10⁻⁵ 2.5×10⁵
aEnergy of the upper level above ground in units of degrees Kelvin. bEinstein spontaneous emission coefficient.
cThe critical densities of the CO transitions are calculated by equating the spontaneous
emis-sion rate with the colliemis-sional de-excitation rate from the upper level to the lower level [111], while for the atomic transitions we include collisional depopulation of the upper level to all other levels [86]. We assume CO and C0are excited by collisions with H
2molecules, C+and O0
by collisions with H atoms, and N+and O++by collisions with electrons.
brightest CO lines in these systems [3].
2.2
Observing Program
The broad wavelength coverage of ZEUS allows us access to important cooling lines emitted by galaxies in the local Universe and at high redshift (Table 2.1). In nearby starburst galaxies and Ultraluminous Infrared Galaxies (ULIRGs) we will observe mid-J CO rotational emission and [CI] fine-structure line emission, and use these observations to model the physical conditions of the warm molec-ular gas and to address these key questions: How does the central starburst in-teract with the natal ISM, and does this inin-teraction help or hinder further star formation? What is the origin of the [CII] deficit in ULIRGs? We will also ob-serve FIR fine-structure line emission from dusty galaxies at high redshift, most
importantly the [CII] transition, which we can use to estimate the intensities of the UV fields powering these systems. Are submillimeter galaxies indeed pow-ered by bursts of star formation, and if so, how intense are these starbursts?
2.2.1
Starburst Galaxies
Star formation in our Galaxy occurs in molecular clouds distributed throughout the∼30 kpc disk. A total gas mass of Mgas ∼1010 M⊙is producing stars at a rate of∼4M⊙yr−1, corresponding to a gas depletion timescale of
∼2×10⁹yr. This is
an appreciable fraction of the∼1010yr age of the Galaxy, and is consistent with
the picture of a steady star formation history.
In the central∼ 0.1−1kpc regions of many nearby galaxies, however, stars are being formed at comparable rates out of much smaller gas reservoirs. This enhanced star formation efficiency results in shorter depletion timescales of
∼ 108 yr, indicating that these are temporary phenomena, which are often re-ferred to as ’starbursts’. This high efficiency is the result of a large central gas concentration, typically created by a merger/interaction with a nearby system, or by the channeling of material to the nucleus with the aid of a stellar bar. Star-burst nuclei are an important component of local stellar production, with an estimated∼ 25%of all high mass star formation within 10 Mpc occuring in just 4 starburst galaxies (M82, NGC 253, M83, and NGC 4945) [46]. It is therefore important to understand these systems to provide a complete census of local star formation.
Nearby starburst nuclei also offer an excellent opportunity to study the physical processes at work in environments of enhanced star formation,
includ-ing an examination of the interaction between the young stars and the surround-ing ISM. As an example, [8] use observations of the CO line intensities to model the excitation of the molecular gas in the starburst nucleus of NGC 253. They find that the bulk of the∼ (2−5)×107 M
⊙ of gas in the central 180 pc is warm
(T ∼ 120K) and dense (nH2 ∼ 104.5 cm−3), and that this is far too much mass to
be heated by UV photons in PDRs. It is more likely that cosmic rays produced by the many supernovae in the nucleus penetrate the cores of molecular clouds and heat the full volume of molecular gas, rather than just the photodissociated cloud surfaces. Studies such as this help us to better understand the starburst phenomenon, and these systems may serve as useful templates for star-forming galaxies at higher luminosity and redshift.
2.2.2
Ultraluminous Infrared Galaxies
One of the most exciting results from the Infrared Astronomy Satellite (IRAS) was the detection of a new class of galaxies that emit the bulk of their radiation at infrared wavelengths. At bolometric luminosities greater than2×1011L
⊙these
infrared galaxies become the dominant population in the local Universe [107]. At the high luminosity end are the Ultraluminous Infrared Galaxies (ULIRGs), formally defined as objects with LIR ≥ 1012 L⊙. Follow-up study has shown that
nearly all ULIRGs are advanced mergers between gas-rich spirals, and contain massive central concentrations of gas and dust [99]. The infrared luminosity is a direct result of the merger, which triggers either an extreme burst of star formation and/or accretion onto a central black hole (an active galactic nucleus [AGN]). While the relative importance of the two energy generation mecha-nisms has been debated since their discovery, most ULIRGs are now thought
to be powered primarily by star formation, although many also contain a lumi-nous AGN [31, 24].
While ULIRGs may be powered by star formation, the physical conditions in these sources are quite different from those in the nuclei of lower luminosity starburst galaxies. One of the surprising results from the Infrared Space Ob-servatory (ISO) mission was the discovery that the ratio of the [CII] line to FIR continuum emission in ULIRGs is ∼ 7 times weaker than in lower luminosity systems [73], in which the [CII] cooling accounts for0.1− 1% of the total FIR luminosity [109]. This [CII] deficit may be understood if the emission is pro-duced in PDRs which are either illuminated by intense FUV fields or have high gas densities, which would reduce the fraction of the FIR luminosity emerg-ing in the gas coolemerg-ing lines and/or shift the coolemerg-ing budget to the [OI] 63 µm transition. An alternative explanation is that the PDRs in ULIRGs and starburst galaxies are similar, but that the continuum emission from ULIRGs is produced in a non-PDR component that dilutes the globalL[CII]/LFIRratio [73].
Observations of [CI] and the mid-J CO lines provide a means of testing these scenarios. If the [CII] deficit is only an apparent affect produced by a domi-nant non-PDR source of FIR continuum, then we would expect to see the line to continuum ratios of CO, [CI], and [CII] reduced by similar amounts. If in fact the [CII] deficit is caused by PDRs with large values ofnorG0, then we would
expect to see these line ratios change accordingly. As an example, [89] recently reported the detection of CO J = 6 → 5emission in the ULIRG Mrk 231, and find that the total CO cooling approaches that of [CII]. This is quite different from the case in most galaxies, where the [CII] cooling dominates [3]. The low
density, which has the effect of moving the C+/C0/CO transition to lower A V,
thereby reducing the C+ column and increasing the surface temperature of the
CO layer [89]. This high density scenario can be tested with observations of the CO J = 7 → 6 and [CI](2 → 1) lines at 371 µm, which have critical densities of 4.4 × 105 cm−3 and 1.1 × 103 cm−3, respectively. The F
CO(7→6)/F[CI](2→1) ratio
is therefore a sensitive density probe, increasing by an order of magnitude in PDRs as the density is increased from 103cm−3 to 105cm−3[60].
2.2.3
Luminous, Dusty Galaxies at High Redshift
While ULIRGs dominate the high end of the local luminosity function, they ac-count for only a small fraction of the infrared energy density [106]. This picture changes at earlier times, however, where a cosmologically significant popula-tion of ultraluminous infrared galaxies has been discovered atz∼ 2.
The existence of infrared-luminous galaxies at high redshift was implied by the COBE satellite’s detection of a Cosmic Infrared Background (CIB), which peaks at ≈ 200 µm and contains an energy density comparable to that in the optical background [26, 18]. Since the discovery of the CIB, many surveys at mid-IR through millimeter wavelengths have been undertaken in an attempt to resolve the underlying galaxy population. Some of the most successful of these surveys have used the SCUBA camera on the James Clerk Maxwell Telescope (JCMT) to identify a large population of dusty, high-redshift galaxies through deep integrations at 850µm. The number counts of these submillimeter galax-ies (SMGs) can directly account for ≈ 60% of the CIB at 850 µm, and with a reasonable extrapolation of the counts below the detection limit, the full CIB is
reproduced [105].
One of the most complete samples of SMGs was assembled by [13], who combined radio interferometry and optical spectroscopy to measure the red-shifts of 73 SMGs. This radio-detected sample has a median redshift of z =
2.2, and a median total IR luminosity (integrated between 8 and 1100 µm) of
LTIR = 8.5 × 10¹² L⊙. As with ULIRGs in the local Universe, the large dust
obscuration in these sources makes it difficult to unambiguously rule out the presence of an energetically dominant AGN. However, the UV/optical spectra of this sample, combined with the X-ray fluxes and size estimates of the general SMG population, imply that less than ≈ 30% of the IR luminosity is powered by AGN activity [13, and references therein]. Converting the remaining lumi-nosities into star formation rates, the star formation rate density (SFRD; activity per unit co-moving volume) of bright SMGs is obtained as a function of red-shift. This is compared with estimates of the SFRD obtained through observa-tions at other wavelengths in Figure 2.2. Although the SFRD of bright SMGs only accounts for the most luminous of the IR galaxy population, it is still com-parable to the SFRD inferred from observations of the rest-frame UV emission of galaxies at z ∼ 2− 3. Extrapolation of the SMG number counts to include fainter sources (small squares and dashed line in Fig. 2.2) suggests that infrared-luminous galaxies may dominate the star formation activity atz∼2, with a peak SFRD more than an order of magnitude larger than in the local Universe.
The large SFRD found atz∼2implies significant evolution of the IR energy density fromz=0→2, and this is confirmed by observations in the mid-IR. For a sample of Spitzer MIPS 24µm sources extracted from a blank field survey, [67] find that the IR energy density increases as(1+z)3.9 out toz ∼ 1. This is caused
Table 2.2: Redshift Coverage for Far-Infrared Fine-Structure Line Observations with ZEUS
Transition Redshift Interval
350µm 450µm 610µm 870µm
[OI] 63µm 4.22−5.01 5.65−6.60 [OIII] 88µm 2.73−3.30 3.75−4.43
[CII] 158µm 1.09−1.41 1.66−2.04 2.63−3.06 4.23−5.09 [NII] 205µm 0.61−0.85 1.05−1.34
Note. – The redshift intervals shown for each transition correspond to the range currently accessed by ZEUS in the 350 and 450µm telluric windows. We also show the intervals which could be accessed in the 610 and 870µm windows for [CII] observations, achieved by operating the grating in 3rdand 2ndorder.
primarily by an increase in the mean luminosity of the IR galaxy population, such that systems with LIR≥ 1011L⊙dominate the emission beyondz& 0.7, and
ULIRGs account for more than 10% of the energy production by z = 1. This is in contrast with the evoluton of the UV luminosity density, which scales only as
(1+z)∼2.5. Thus byz
∼ 1and beyond, ultraluminous infrared galaxies account for a significant fraction of the star formation activity.
While the infrared continuum flux traces the total luminosity, dust mass, and dust temperature, spectroscopy of redshifted FIR fine-structure lines can pro-vide a wealth of information on the physical conditions of the gas, and on the nature of the ambient UV radiation fields. With ZEUS on the CSO, we can detect several of the brightest FIR fine-structure lines from distant galaxies when their redshifted wavelengths fall into the available submillimeter windows, includ-ing the [OI] 63µm, [OIII] 88µm, [CII] 158µm, and [NII] 205µm lines (Table 2.2). Our primary diagnostic for distant galaxies is the 158 µm [CII] transition. This is the brightest line from most star-forming galaxies, where it dominates the cooling of photodissociated gas on the surfaces of molecular clouds. We
[CII] in 350
ȝ
m band
[CII] in 450
ȝ
m band
Figure 2.2: Evolution of the energy density (parametrized by SFRD) in the Uni-verse with epoch from [13, and references therein]. The submillimeter mea-surements from [13] (large squares) are compared with the published estimates from optical/UV surveys and radio/IR tracers of the star formation density. The smaller symbols for the optical estimates indicate dust-corrected estimates. A Gaussian fit is shown for the four submillimeter galaxy points, tracing an evo-lution comparable to luminous radio-selected quasars. For the submillimeter sources, the smaller points show a simple redshift-independent correction to the luminosity density to match the submillimeter extragalactic background down toF850µm =1mJy, below the detection limit used by [13]. The dashed line is the
best fit for a simple parametric model constrained by the counts of sources in the FIR/submillimeter and the spectrum of the extragalactic background. The two partially filled columns show the redshift coverage corresponding to observing the [CII] 158µm line in the 350 and 450µm telluric bands.
can use ZEUS to begin a survey of the [CII] line emission from distant galaxies, which is shifted into our primary 350 and 450µm telluric windows for redshifts of z = 1.09 − 1.41 and z = 1.66− 2.04 (Fig. 3.1). Such a survey is critical to understanding the star formation history of the Universe, as it is within this
z∼1−2range that the star formation rate strongly evolves to its peak (Fig. 2.2). We will use the ratio F[CII]/FFIR of the [CII] line to FIR continuum flux along
with PDR modeling to constrain the strength of the ambient FUV field,G0(see Fig. 7.5), which is a reflection of the concentration of the starburst. Very high
G0 ∼ 105 is associated with highly compact star-forming regions, such as the
region hosting the Orion PDR, in which the gas is∼ 0.1−0.2 pc from the OB cluster. More modest values ofG0 ∼ 103 are representative of starburst nuclei,
while for normal galaxies with star formation distributed throughout the disk,
G0∼ 1−100. For galaxies which are powered by an AGN, the intense FUV fields
are expected to produce a smallF[CII]/FFIRratio.
2.2.4
First Sources: NGC 253 and MIPS J142824.0+352619
In chapter 6 we present the first result from our program to characterize the molecular ISM in starburst galaxies, with a study of the nucleus of NGC 253. This is the nearest starburst galaxy, and is often considered to be an archetype which may be used as a template for more distant and luminous systems. It is the brightest extragalactic source of mid-J CO emission, and in addition to the main 12CO isotopologue, we were able to detect emission in the13CO J
=
6 → 5 transition. The combination of both isotopologues enables a detailed excitation analysis, and facilitates a study of the stellar feedback mechanisms in this starburst.
In chapter 7 we present the first result from our high-redshift program, with a detection of [CII] emission atz = 1.325. MIPS J142824.0+352619 is a hyperlu-minous infrared galaxy (LFIR >1013 L⊙) recently discovered by the MIPS
instru-ment on the Spitzer satellite, and has been shown to be a starburst-dominated system with an apparent star formation rate of∼5500 M⊙yr−1. As such, it is
sim-ilar to the luminous, star-forming submillimeter galaxies found at comparable redshifts. It has been well studied from the optical through the radio, and our observations, combined with the literature data, allow for a detailed modeling of the PDRs powering this galaxy.
CHAPTER 3
INSTRUMENT OVERVIEW: OPTICAL AND CRYOGENIC DESIGN
In the previous chapter we presented the scientific case for an observing program to study far-infrared line emission from high-redshift galaxies, and submillimeter line emission from nearby systems. This project requires the construction of a sensitive submillimeter spectrometer optimized for detecting broad lines from extragalactic sources. In this chapter we justify the choice of a grating spectrometer, and describe the optical and cryogenic design of ZEUS.
3.1
Introduction
3.1.1
Coherent vs. Direct-Detection
Two different detection techniques are used in submillimeter astronomy: het-erodyne systems coherently sample the incoming electromagnetic wave, while direct-detection systems measure the total power of the incident photons. Het-erodyne receivers are routinely used for spectroscopy, and have made several extragalactic detections at high frequencies in recent years [124, 2, 3, 40, 89]. These systems can provide very high spectral resolution, and by retaining the phase information are also ideal for interferometry. However, this detection technique requires the simultaneous measurement of the amplitude and phase of the wave, and limits to the accuracy of this measurement are set by the Heisenberg uncertainty principle. As a consequence, heterodyne receivers pro-duce an unavoidable quantum noise. Expressing this noise as the equivalent temperature of a radiation field which would produce the same noise, one
finds a minimum receiver temperature ofTrx,qn(DSB) = 2hν/kB = 82 → 64 K at λ= 350→450µm. The fundamental limit to the sensitivity of any spectrometer arises from fluctuations in the background photon arrival rate (see section 4.6.1), which corresponds to a noise temperature Tbg = (emissivity × temperature) ∼
150− 200 K at λ = 350− 450 µm. Thus at short submillimeter wavelengths, the quantum noise term makes a significant contribution to the system noise in an otherwise background-limited system.
The backends used in heterodyne systems also suffer from limited width. Spectral line observations are currently limited to instantaneous band-widths of ≈ 1.8 GHz [63, 89], corresponding to velocity widths of ∆v = 630 → 810km s−1 atλ= 350 →450µm. Many submillimeter galaxies have linewidths
as large as ∆v ∼ 800 km s−1 [38], however, requiring a larger velocity
cover-age. Added bandwidth is also helpful for observing lines from distant galaxies whose redshifts may only be approximately known (e.g., from photometric red-shifts, or redshifts from PAH features).
Direct-detection systems do not experience quantum noise and can be con-structed with large bandwidths, and arrays of semiconductor bolometers are now routinely used for background-limited continuum observations [50, 19]. A background-limited spectrometer is more difficult to implement than a broad-band instrument, however, due to the reduced power falling on each detector. The bolometers must be intrinsically low-noise, and care must be taken to filter out any unwanted radiation. Nevertheless, an earlier direct-detection submil-limeter spectrometer, SPIFI, achieved sensitivities within factors of 1.5 − 3 of the background limit [10], and encouraged by this success we choose a direct-detection design for ZEUS.
3.1.2
Spatial vs. Spectrally Multiplexing
For background-limited operation the two spectrometer choices are a Fabry-Perot Interferometer (FPI) and a grating spectrometer. An FPI provides in-stantaneous two-dimensional spatial coverage in one spectral bin, and must be scanned to complete the spectrum. A grating spectrograph provides instan-taneous spectra across a one-dimensional slit projected on the sky, and must spatially scan to produce a two-dimensional image. At the spatial resolution obtainable with the current class of submillimeter telescopes (λ/Dtel≈ 7′′ at 350 µm on the CSO, corresponding to 2.7 kpc atz=0.02and 56 kpc atz=1.2), high-redshift galaxies and even local ULIRGs are expected to be unresolved. Imaging capabilities are not required, and by choosing a spectrally multiplexed grating monochromator we simultaneously observe in several spectral bins, achieving large instantaneous bandwidth.
3.2
Grating Design
We begin our selection of the grating parameters by considering the spectral re-gions available in the short submillimeter wavelength regime. In Figure 3.1 we show the atmospheric transmission on Mauna Kea, which identifies our two pri-mary telluric bands centered at 350 and 450µm. As discussed in chapter 2, these windows transmit the important CO(6→5), CO(7→6), CO(8→7), and [CI](2→1) lines, which are dominant coolants of the warm, dense molecular gas in local ULIRGs, and are thus of prime interest to our work (see Table 2.1). These win-dows also correspond to redshift bins of z ≈ 1.09−1.41 andz ≈ 1.66−2.04for [CII] observations, and access to these redshift bins allows us to study the
evo-Figure 3.1: Submillimeter atmospheric transmission for a precipitable water va-por level of 700 µm, a good night on Mauna Kea. ZEUS currently operates in the 350 and 450µm telluric windows, and has access to the indicated ranges. lution of the star formation history of the Universe from its peak atz∼2.2to the current epoch (Fig. 2.2).
The resonance condition of a diffraction grating is described by the grating equation:
nλ
d = (cosγ)(sinα+sinβ), (3.1)
wherenis the diffraction order,dis the groove spacing,αandβare the angles of incidence and diffraction with respect to the grating normal, andγis the angle of the incident beam out of the dispersion plane. Thus a grating tuned to resonate at 355µm in 5th order will also resonate at 444µm in 4th order, giving us access
to both the 350 and 450 µm telluric bands. Such combinations of resonances are also found in higher orders, but by remaining in low order the free spectral
range (δλ=λ/n) is≈20% at 350µm and≈ 25%at 450µm, large enough to cover the≈15% wide telluric windows. With this design, the 610 and 870µm windows can also be accessed by operating the grating in 3rdand 2ndorder, respectively. A
compact and efficient grating mounting configuration is Littrow mode, in which the incident and diffracted beams are cospatial (i.e.,α=β,γ = 0). We choose an R2 echelle (blazed atα = tan−1(2) = 63.4◦), which then determines d = 992 µm from equation 3.1. By rotating the grating overα=57◦−74◦the full 350 and 450
µm telluric bands can be covered.
For the background-limited observation of a spectral line of width δv, the detection sensitivity is maximized by selecting a resolving power of R ≈ c/δv. We estimate a representative velocity width is δv = 300 km s−1 for our target
sources, and choose R = 1000. The slit-limited resolving power of a grating spectrometer operated in Littrow mode is
R= 2(tanα)Gproj
θslitDtel
, (3.2)
whereGproj is the diameter of the collimated beam incident on the grating,θslitis
the angular size of the slit projected onto the sky, Dtelis the telescope diameter,
and the above equation holds in the limit of θslit > λ/Dtel. For
background-limited observations of a point source, the sensitivity is maximized by selecting
θslit = 1.2λ/Dtel. As a compromise between satisfying this condition for our two
primary windows we initially chose θslit = 8.7′′, corresponding to 1.2λ/Dtel at λ = 364µm. To attain R ≈ 1000we illuminate the grating with aGproj = 10cm beam, givingR=1000atλ= 361µm andλ=451µm (see Table 3.1). After it was discovered that the system was not fully background-limited we opened the slit to 10.8′′to increase our sensitivity, which decreased the resolving power by 25%.
We note that the 10.8′′ slit corresponds toλ/D
tel atλ = 545 µm, so equation 3.2
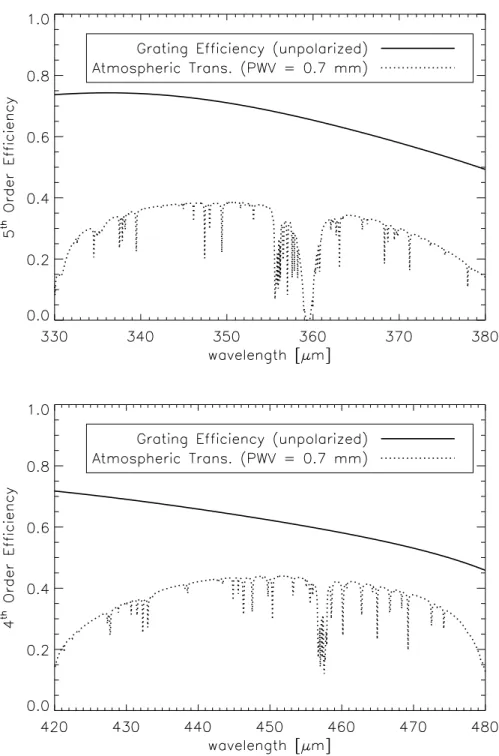
Figure 3.2: Grating efficiency superposed on the zenith atmospheric transmis-sion in the350and450µm telluric windows. The plotted range shows the extent of our spectral coverage, limited by the range of incidence anglesα= 57◦−74◦.
Table 3.1: ZEUS Resolving Power
α λ(5thorder) λ(4th order) Ra Rb
[degrees] [µm] [µm]
57 333 416 706 565
59 340 425 763 610
62 350 438 862 690
65 360 450 983 786
68 368 460 1134 908
71 375 469 1331 1065
74 381 477 1598 1279
Note. – Slit-limited resolving power of a grating spectrometer in which the grating is operated in Littrow mode, has a groove spacing ofd= 992µm, and is illuminated by a collimated beam with diameterGproj = Dtel/104.
aθ
slit=8.7′′, used for initial observing runs in 2006.
bθ
slit=10.8′′, used for subsequent observing runs in 2007, 2008, and 2009.
We model the blaze efficiency of the grating using the program PC Grate-1E [37]. Figure 3.2 shows the predicted efficiency of the grating in Littrow mode in 5th order (350µm) and 4th order (450µm) for unpolarized light, which ranges
from≈45−75%over the two bands. To accomodate a 10 cm beam at the steepest useful angle of α = 73◦ requires the grating to be at least 100 mm wide and 342 mm long. The 126 mm×350 mm gold-coated, diamond-turned aluminum grating was manufactured by Zumtobel Staff GmbH (Austria).
3.3
Optics
The ZEUS detector array uses 1 mm×1 mm square pixels (see chapter 4), and the optics are designed to match this pixel size to a diffraction-limited beam on the sky. This is approximately achieved in the 350 and 450µm bands by imag-ing onto the focal plane at f/2.75, correspondimag-ing to a plate scale of 7.2′′/pixel,
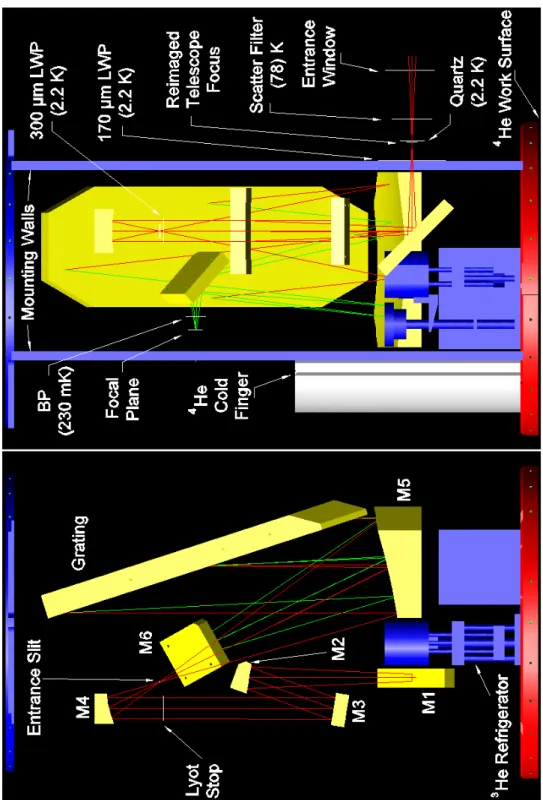
orλ/Dtelat 364µm. The optical layout inside the cryostat is shown in Figure 3.3.
The telescope delivers an f/12 beam to the Nasmyth platform, and an ellipti-cal/flat pair of foreoptics reimages the telescope focus to a location inside the entrance window, conserving the focal ratio. The beam is then passed through an f-converter stage consisting of two fold mirrors (M1 and M3) and two off-axis paraboloids (M2 and M4) in Czerny-Turner configuration, which reimages at f/2.75 onto the entrance slit of the echelle stage. The telescope secondary is imaged to a plane between M3 and M4, and baffles are placed here to form a Lyot stop.
The echelle is mounted in an Ebert-Fastie configuration, with a single off-axis paraboloid (M5) serving as both collimator and camera. The center of M5 is offset from the plane of theM1−M4section, such that the 10 cm collimated beam is incident on the grating with a small angle out of the dispersion plane, and the diffracted beam returns to M5 offset in the cross-dispersion direction. This quasi-Littrow mode of operation separates the image from the entrance slit, and allows the introduction of a flat pickoff mirror (M6) to direct the beam onto the detector. The Zemax ray-trace program was used to assist the optical design, and shows diffraction-limited spot sizes over the 1 mm× 32 mm focal plane. All mirrors are gold-plated, diamond-turned aluminum with a protective SiO coating.
3.4
Dewar
The dewar was originally constructed for the KEGS instrument [48] by Precision Cryogenics, Inc. (Indianapolis, IN), and was modified to be reused for ZEUS.
Figure 3.3: ZEUS Optical Layout. Left: Front view of the optical layout, with the rays traced from the entrance window to the grating (red) and from the grat-ing to the focal plane (green). Right: Side view, which additionally shows the filters,4He cold finger, and the optics mounting walls. Not shown are the pair
of baffling boxes which form light-tight enclosures leading from the first optics mounting wall to the Lyot stop, and from the Lyot stop to the entrance slit.
The cylindrical vacuum shell is 92.7 cm tall and 41.3 cm in diameter, and con-tains nitrogen and helium cryostats suspended from the top plate by a pair of 0.5 mm thick G-10 fiberglass rings (Fig. 3.4). The helium work surface supports a pair of mounting walls which are connected by a strut and a bottom plate to form a rigid structure to which the detector, grating, and 5 of the 6 mirrors are mounted. This structure is made light-tight with additional pieces of thin alu-minum, and to ensure that the full spectrometer section is cooled to the helium bath temperature we also add an outer helium-cooled radiation shield. An ex-ternal stepper motor is connected through the top plate of the vacuum shell to the internal grating drive train by a ferrofluidic feedthrough.
To reduce the conductive heat load on the cryostats both necks are stainless steel, and aside from the G-10 rings the rest of the dewar is aluminum. The nitrogen tank contains 3.4 liters of liquid, which holds for 18 hours. The main helium reservoir holds 5.7 liters, and we added a cold finger that extends down one of the walls and increases this volume to 6.7 liters. After the helium bath is pumped down to 2.2 K the hold time is about 15 hours, and both the nitrogen and helium tanks are filled twice daily.
3.5
3He Refrigerator
To obtain the requisite sensitivity we cool the detector package to 230 mK using a dual-stage 3He refrigerator (Chase Research Cryogenics Ltd., Sheffield, UK),
shown schematically in Figure 3.5. Each stage is a closed-cycle system consist-ing of a cold head, a charcoal adsorption pump with attached heatconsist-ing element, and a gas-gap heat switch linking the pump to the4He bath. The cycle begins
Figure 3.4: Mechanical drawing of the ZEUS cryostat. For clarity, the cold finger, the optics mounting walls, and the 3He refrigerator are shown rotated by 90◦
by isolating the pump and heating it to above 50 K to drive the3He gas into the
pipe leading to the cold head. A segment of the pipe directly above the cold head is thermally linked to the pumped 2.2 K4He bath, and here the 3He
con-denses out and drips into the head. The two pumps are heated in series for an hour to allow the3He to condense and cool the otherwise isolated cold heads,
as well as the attached detector package. The heat switches are then closed to cool the charcoal, which then adsorbs the evaporated3He and lowers the vapor
pressure over the liquid, allowing it to cool to 300 mK and below.
The intermediate stage uses a heat exchanger to extract enthalpy from the cold gas and cool the pipes leading to the cold head, thereby reducing the heat load conducted from the4He bath. The residual heat load limits the operating
temperature of the intermediate cold head to 300 mK. The heat exchanger and intermediate head are coupled to the gas pipe leading to the ultracold head, absorbing the conductive load and allowing the ultracold head to cool to 225 mK. The detector package is suspended from one of the 4He mounting walls
by a thermally-isolating system of Kevlar cord. The suspension system con-sists of 12 segments of 0.25 mm diameter and 18 mm long cord, giving a total cross-section to length ratio of 0.033 mm. The integrated thermal conductivity of Kevlar from 2.2 K down to 230 mK is 10µW mm−1 [122], giving a total heat
load of 0.33µW. The detector package is coupled to the ultracold head by an 18 cm long copper heat strap, and the power conducted through the Kevlar mount raises the detector package temperature to 230 mK.
The ultracold head, the detector housing, and the cold section of the Kevlar suspension mount contribute about 350 grams of copper which must be cooled from 2.2 K to 225/230 mK. The specific heat of copper at low temperatures is
Figure 3.5: Simplified sketch of the (unfolded) 3He refrigerator, also showing
C(T )= 11(T/K)+1.0(T/K)3mJ kg−1K−1, and integrating from 2.2 K down to 225
mK requires 32 mJ kg−1, or 11 mJ total. This will evaporate about 0.00027 moles
of3He, much less than the 0.13 moles contained in the ultracold stage. The
de-tector reaches 260 mK about 2 hours after the start of the cycle, and approaches the 230 mK operating temperature over the next2−3hours.
The system hold time is limited by the capacity of the intermediate stage, which absorbs the power conducted from the 4He bath. Manufacturer testing
indicates that ≈ 67% of the 0.54 moles of 3He contained in the intermediate
stage is liquified and cooled to 300 mK in a successful cycle. For a latent heat of evaportation of 27 Joules per mole, this corresponds to a cooling capacity of 9.6 Joules. When run from an unpumped 4.2 K4He bath, the parasitic heat load
conducted through the gas pipes to the intermediate head is ≈50 µW. We also run 78 manganin signal and thermometry wires to the detector which are sunk to both the heat exchanger and the intermediate head, and which add a small additional heat load to the intermediate head. The diameters of these wires range from 0.102−0.127 mm and the distance from the heat exchanger to the intermediate head is 35 mm, giving a total cross-section to length ratio of 0.019 mm. The integrated thermal conductivity of manganin from the 1.3 K temper-ature of the heat exchanger to the 0.3 K tempertemper-ature of the intermediate head is 0.062 W m−1, so the total additional heat load conducted through the wires is
only 1.2µW. Under a 50µW total heat load the 9.6 Joule cooling capacity should provide a 52 hour run time, somewhat longer than the 36 hours we achieve. While additional heat sources cannot be ruled out, it is more likely that our rou-tine for cycling the refrigerator condenses and cools only≈50% of the total3He
When operating from a pumped 2.2 K4He bath, the conductive load on the
intermediate head is reduced and the hold time increases to more than 60 hours. Under normal operation at the telescope the4He bath is continuously pumped
to 2.2 K and the3He refrigerator is cycled every 2 days.
3.6
Filtration
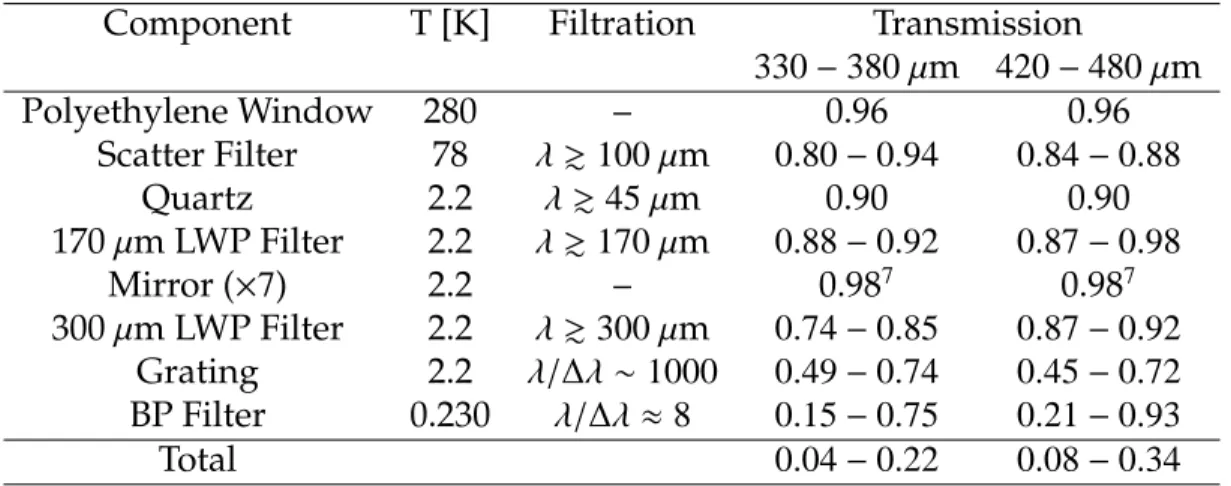
As bolometers are sensitive to all wavelengths of light, it is important to re-ject stray and out of band radiation, particularly the short wavelength radiation (λ . 100 µm) emitted by sources at 78− 300 K. We describe the filtration and baffling working inward from the entrance window (see Fig. 3.3). A snout on the nitrogen-cooled radiation shield blocks light incident from large angles, and a 78 K scatter filter placed over the shield aperture scatters short wavelength ra-diation (λ.100µm) out of the beam. The light must then pass through a quartz filter mounted on the outer helium radiation shield near the reimaged telescope focus, which reflects or absorbs radiation between 5µm < λ <45 µm. Behind the quartz a long wavelength pass (LWP) (λ&170µm) filter blocks the aperture in the optics mounting wall. Light passing through this filter enters a light-tight baffling box which allows radiation to escape only through the Lyot stop, where there is a second LWP (λ ≥ 300µm) filter. A second baffling box then connects the Lyot stop to the entrance slit. A bandpass (BP) filter with a fractional width ofλ/∆λ ≈ 8 is mounted directly in front of the bolometers on the 230 mK de-tector package, and selects the grating diffraction order. Both our LWP and BP filters were constructed by P. A. R. Ade and C. E. Tucker at Cardiff University, Cardiff, UK. The elements in the ZEUS optical train are listed in Table 3.2.
Table 3.2: Elements in the ZEUS Optical Train
Component T [K] Filtration Transmission
330−380µm 420−480µm
Polyethylene Window 280 – 0.96 0.96
Scatter Filter 78 λ&100µm 0.80−0.94 0.84−0.88
Quartz 2.2 λ& 45µm 0.90 0.90
170µm LWP Filter 2.2 λ&170µm 0.88−0.92 0.87−0.98
Mirror (×7) 2.2 – 0.987 0.987
300µm LWP Filter 2.2 λ&300µm 0.74−0.85 0.87−0.92
Grating 2.2 λ/∆λ∼1000 0.49−0.74 0.45−0.72
BP Filter 0.230 λ/∆λ≈ 8 0.15−0.75 0.21−0.93
Total 0.04−0.22 0.08−0.34
Note. – At the centers of the 350 and 450µm bands the peak system transmis-sion is 0.22 and 0.34, respectively. This drops at the edges of the windows due to a decreased transmission of the BP filters.
In the current configuration, two bandpass filters are placed adjacently over the array, such that the system simultaneously obtains spectra in both the 350 and 450 µm telluric windows. The grating and filters ensure that the detector array sees spectrally pure radiation from the astronomical source, and unavoid-able background radiation from the sky and telescope. This background power amounts to∼1pW, which is∼ 130times less power than emitted by a cm2
black-body at 2.2 K, and this illustrates the challenge in baffling/filtering unwanted radiation from the detectors. With the final BP filter tied to the 230 mK detector package we minimize the radiative load generated by the 2.2 K pumped 4He
![Figure 2.1: Schematic diagram of a photodissociation region from [51].](https://thumb-us.123doks.com/thumbv2/123dok_us/8579547.2324769/19.918.194.779.120.519/figure-schematic-diagram-photodissociation-region.webp)
![Figure 2.2: Evolution of the energy density (parametrized by SFRD) in the Uni- Uni-verse with epoch from [13, and references therein]](https://thumb-us.123doks.com/thumbv2/123dok_us/8579547.2324769/31.918.204.797.168.697/figure-evolution-energy-density-parametrized-sfrd-verse-references.webp)

![Table 3.1: ZEUS Resolving Power α λ (5 th order) λ (4 th order) R a R b [degrees] [µm] [µm] 57 333 416 706 565 59 340 425 763 610 62 350 438 862 690 65 360 450 983 786 68 368 460 1134 908 71 375 469 1331 1065 74 381 477 1598 1279](https://thumb-us.123doks.com/thumbv2/123dok_us/8579547.2324769/40.918.284.689.143.355/table-zeus-resolving-power-order-order-degrees-µm.webp)