Abstr sector gener can es system power electr than Under power the ho found uncom Keyw 1. I Recen increa dynam gener drive to be et al, where house 21 PM On th the p electr secto emiss *Corre DOI: h Print I Copyr Schoo The
User
ract. Energy r
r. With enab ration, distribu
stablish a res m behaves as r shortage in ricity usage by its demand. M rstanding the r blackout. In ousehold tena d that the use
mfortable situa
ords: User be
ntroduction ntly, the ased signi mically. Th ration effici s minimum e generated a , 2010). In m
e the majo ehold, the pe M.
he other han eak load occ ricity consu r. In additio sion reducti
esponding autho
http://dx.doi.org ISSN: 1978-695 right@2013. Pu l of Business an
e Asian Journa
Behavior
Toy
resilience is o bling new tec uted storage, silience energy
a customer an the peak hou y changing lif Most of the user behavio this research ant in using el ers behavior ation. ehavior, Game n demand ificantly an his fluctuat iency and t requirement and transmit most develo r user of e eak load occ
nd, in develo curs at dayti umption of on, the urgen
on issue ha
or. Email: nurb
g/10.12695/ajtm 56; Online ISSN ublished by Unit nd Managemen
al of Technolo
r Assessm
Nur yohashi Univ
one of the fam chnologies in
and intelligen gy production, nd producer a urs, reduce C fe style.In de demand com or toward elec h, we propose
lectricity espe is greatly af
e theory, Smar
of electric nd fluctua tion decrea the peak lo ts of electric tted (Molder oping countr electricity is curs at 18 PM
oped countr me due to h the indust nt need of C ave led to
m.2013.6.2.1 N: 2089-791X.
t Research and nt-Institut Tekno
ogy Managem
ment of Ho
r Budi Mulyo versity of Te
mous issues am n power engi
nt information , distribution, at the same tim CO2 pollution
eveloping cou es from the ctricity usage a methodolog cially the use ffected by the
rt grid, Heatin
city ated ases oad city rink ies, s a M – ies, high trial CO2 the dev Or ele ele dis Th lar In ele ha of ma Sm gen wa con gri ac.id Knowledge ologi Bandung.
ment Vol. 6 No
ousehold
ono*
echnology, Ja
mong researc ineering for n and managem
and consump me. This cond n using renew untries, the am household th is important gy - using gam e of cooling an e cost they a
ng and cooling
velopment riginally, the ectricity syste ectricity stribution, an
he grid carri rge capacity the early ectricity grid d been estab electricity anagement mart grid tech
nerate and d ay, and respo nditions that id.
.
o. 2 (2013): 65
Electric U
apan
chers and pra smart grid s ment, each ho ption. A hous dition enabled wable electric mount of elect hat has peak to minimize p me theory- to m
nd heating app are willing to
g appliances,
of new g e grid termin em that invo generation, nd control (F
ies electricit central gene of 21th ce d (commonly blished using
and integr in a distr hnologies ha distribute pow ond effective
t may occur 5-71
Usage
actitioners in e such as distr ousehold comm sehold in smar d them to redu ity, and minim tricity supply
load on nigh peak load and
model a beha ppliances tena o pay for av
Energy resilie
rid technol nology refers olves activitie
transmi ang et al, 20
ty power fr erator to the entury, a sm
The introduction of electric generation based on renewable resources like sun, water, and wind, is one of the major parts of smart grid. However, the amount of electricity generated from renewable sources (called micro grid) is fluctuating and uncontrollable (Molderink et al, 2010). In this situation, additional production of electricity power is necessary to reduce demand fluctuation, supply uncertainty, and avoid power shortage for some users.
Each of the users in smart grid can become a producer of electricity by installing renewable electricity source. We can call this user as the active user. They have an ability to manage their appliance load, generate a small amount of electricity from renewable sources, and keep their own energy in term of electricity and heat. Active users in decentralized power system have two obvious advantages over passive user in centralized ones, such as improve energy usage and contribute to emission reduction (Gu et al, 2014). Active users can both buy and sell electricity to the other active users or to the electric company.
Besides increasing the production capacity of the renewable energy in house, the household tenants have to be able to manage their electricity usage trough changing their behavior. Understanding the behavior of the user in using electricity is important in this situation. By adjusting their behavior, they can maximize utilization of renewable energy sources, minimize usage of electricity, and help the other user in needs. Similar with lateral transshipment of inventory system in disaster recovery (Mulyono and Ishida, 2014), each active user can mutually help the other active users having electric shortage.
We proposed a methodology to understand the behavior of the active users in using electricity. We utilize game theory to model the behavior and interaction between active users on their way to maximize their benefit over electricity consumption and production. The active users are players in a game that defined by a common goal with different constraints and conflicting objectives. We use game against nature to predict the
behavior of electricity consumption of active users. We are focusing on the cooling and heating appliances since those appliances are major contributor of electricity consumption.
The remaining of this paper is structured as follows. The following section provides an overview of several related work on smart grid. Section three introduces a model of user interaction to minimize the electricity consumption and support the other active users. Section four describes an implementation of the model trough simulation process. We conclude this paper with a discussion of the result.
2. Related Work
Development of smart power grid, that augments traditional power grid system, is one of the greatest inventions in the last decade. In contrast with traditional power grid system, that carries electricity power from a few central generators to a large number of users, smart grid uses two-way flows of electricity and information to create and distribute electricity. Smart grid includes the entire spectrum of the energy system from the points of generation to the points of consumption. Smart grid is decentralized electricity power system that uses two ways information and computational intelligence in an integrated fashion toward electricity generation, transmission, substations, distribution, and consumption to achieve electricity system that is safe, clean, secure, reliable, efficient, resilient, and sustainable (Gharavi and Ghafurian, 2011).
Mulyono, User Behavior Assessment of Household Electric Usage
major systems such as smart infrastructure system, smart management system, and smart protection system (Fang et al, 2013).
Smart infrastructure system is the energy, information, and communication infrastructure underlying the smart grid. This infrastructure supports two-way flow of electricity and information. Smart management system provides advanced management and control services and functionalities. Smart protection system provides advanced grid reliability analysis, failure protection, security, and privacy system.
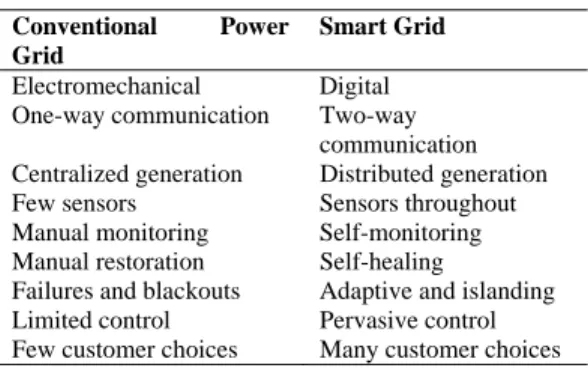
Table 1. Comparison between conventional grid and smart grid (Farhangi, 2010)
Conventional Power Grid
Smart Grid
Electromechanical Digital One-way communication Two-way
communication Centralized generation Distributed generation Few sensors Sensors throughout Manual monitoring Self-monitoring Manual restoration Self-healing
Failures and blackouts Adaptive and islanding Limited control Pervasive control Few customer choices Many customer choices
In the beginning of smart grid development, many research focused on distributed generation management, energy storage and demand side management. Stability of the grid is studied intensively by (Azmy and Erlich, 2005) having a conclusion that electric generators are key to grid stability. In energy storage field, one of the hot topics is level out the electricity demand fluctuation by combining electricity storage with renewable resource such as windmill (Costa et al, 2008). Most literature in demand side load management used the agent-based solution having a hierarchical structure ensures the scalability of the solution (Molderink et al, 2010). Interaction of the electricity user also modeled using agent-based solution. Each of the smart grid users is an active user having the ability to consume, produce, and share electricity between them.
Game theory is the best tool to model the interaction of a user to maximize their payoff. Game theory related to the actions of
decision makers who are conscious about their actions and its effect. A game consists of a principal and a finite set of players, each of which selects a strategy with the objective of maximizing his utility (Charilas and Panagopoulos, 2010). The utility function represents each player’s sensitivity to others actions.
3. Behavior of Electricity Consumption
In every household, there are many electric appliances commonly used such as refrigerator, heater, air conditioner, microwave oven, television, water pump, and dehumidifier. Each of them consumes different range of electricity like refrigerator (725 watt), heater (750-1500 watt), air conditioner (900-1500 watt). Among all of them, the appliances for cooling and heating take the highest electric consumption level. It takes about 8-34% of the overall energy consumption and about 12-38% of the overall energy consumption in summer and winter, respectively (Takuma et al, 2006).
Furthermore, the consumption level of those appliances is sensitive to the environmental temperature and lifestyle of the users. For that reason, we propose a game theory model against nature to understand the behavior of the users in using the cooling and heating appliances. Thermal comfort of the human depends on air temperature, radiant temperature, air velocity, and humidity (Health and Safety Executive, 2013). Comfortable air temperature is from 21oC to 23 oC during winter, and from 23.5 o
C to 25.5 oC during summer. In this research, we focus on one adjustable variable, which is air temperature.
on th user f some the e there econo point Tab User Based user l low, m theor situat certai have coolin econo comf betwe condi Varia each as fol AT = possi applia ST = ET = CT = NT = EC = PC = he cooling feels more c e point the co expense incr
are there omic point, t.
Figure 1.
ble 2. User stra
Strategy Not use cooling/heatin Use cooling/heatin economically Use cooling/heatin comfortably
d on the tem lived, we ma medium, and ry, nature
tions. Each t in probabilit three strat ng/heating, omically, a fortably. Ta
een user s ition.
able P (P1 to strategy. We llow: = maximum
ble to achie ance
the temperat the econom = the comfort = the current = electricity c suffer cost
or heating omfortable; omfort level i reases. Based
important p comfort po
Expenses vs. c
ategy vs. temper
Te Low ng P1 ng y P4 ng P7 mperature le ade three con d high tempe
represents temperature ty of occurre tegies such
using and using
able 2 sho strategy an
P9) represen e consider se
m or minimu eve by cool
ture set by th ic temperatu t temperature temperature cost appliances, nevertheless is decreasing d on Figure points such oint, and wa
comfort
rature condition
emperature Medium Hig
P2 P
P5 P
P8 P
evel where nditions such erature. In ga those th condition ha ence. The us as not us cooling/heat cooling/heat ows a mat nd temperat
nts a payoff everal variab
um temperat ling or heat
he user ure e the s, at g as e 1, as aste n gh P3 P6 P9 the h as ame hree as a sers sing ting ting trix ture for bles ture ting Su ple tem to fro am sho If t dev cur ch eco wi the dev equ pay Ap W po pay of for tem 4. In app du use con he ho sho sea an res Ta low 15 is for 25 pay
uffer cost i easure that v mperature lev
the user. B om the amo mount of com
ows basic pa
the user choo vice, the set rrent temper ooses to onomically, ith the econ e user choo
vice comfor ual with the yoff formul ppendix A.
e can calcula ssible temp yoff formula
low, medium rmula 2 sh mperature co
Numerical A
this sectio plied to the ual bus system
er behav nsumption. ating and usehold as g ow temperat ason. If the d high tem spectively, th able 4. Furth w, medium,
, and 10, res given at Tab r low, medi , 20, and 1 yoff is given
s the expe varied accord vel. This cos Basic payoff unt of savin mfort sacrific
ayoff calcula
oses not usin temperature rature. Furthe use coolin
the set tem omic tempe oses to use rtably, the s
comfortable las (P1- P9
ate the expec perature by
a with occur m, and high ow expecte ondition.
Analysis and
on, the pro household c m. First of a vior tow We pick up cooling ap given at Tab ture situation
suffer cost mperature is he expected hermore, if t and high te spectively, th ble 5. Lastly ium, and hig
5, respectiv n at Table 6.
enses to ge ding to the c st varies acco f formula d ng electricity
ed. The form tion.
ng cooling/he e is equal wi
ermore, if th g/heating d mperature is erature. Fina
e cooling/he set temperatu e temperature
9) are show
cted payoff f multiplying rrence proba temperature ed payoff fo
d Discussion
oposed mod community h all, we analy
ard elec p tentative d ppliance of ble 3. These n during the w
for low, me s 10, 5, an
payoff is giv the suffer co
emperature he expected p
, If the suffe gh temperatu vely, the exp
Mulyono, User Behavior Assessment of Household Electric Usage
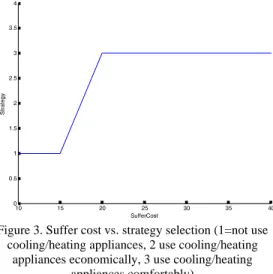
Those three tables imply that expected payoff is sensitive toward suffer cost. If average suffer cost is above the electricity cost, the user prefers to use cooling and heating appliances in a comfortable setting. On the other hand, the user does not prefer to use cooling and heating appliances if the average suffer cost is below the electricity cost. Figure 2 and 3 illustrate the trend of the suffer cost to the payoff and trend of the suffer cost to selected strategy, respectively. This figure clearly show that there is a trade off between suffer cost and payoff and the active user tend to use cooling/heating appliance comfortably as the suffer cost increases.
Table 3. Heating and cooling appliance data for one household
No Description Value
1 AT (maximum or minimum temperature possible to achieve by cooling or heating appliance)
Max: 30o
C, Min: 18o
C
2 ST (the temperature set by the tenant)
23o
C
3 ET (the economic temperature)
20o
C
4 CT (the comfort temperature)
25 o
C
5 EC (electricity cost) JPY20/Kwh 6 PC (suffer cost) JPY10/Kwh
7 Temperature probability Low: 0.3, Medium: 0.4, High: 0.3
8 Temperature range Low: <5 o
C, Medium: 5 o
C - 10
o
C, High: 10 o
C-15
o
C
Table 4. Payoff for each user strategy with suffer cost 10, 5, 3
Temperature
Expected
Low Medium High
User
Not use cooling/ heating
10.0 15.0 17.0 14.1
Use cooling/ heating economically
5.1 7.3 11.1 7.8
Use cooling/ heating comfortably
3.7 4.3 6.3 4.7
Table 5. Payoff for each user strategy with suffer cost 20, 15, 10
Temperature Expected
Low Medium High
User
Not use cooling/ heating
0.0 5.0 10.0 5.0
Use cooling/ heating economically
2.9 4.5 8.0 5.1
Use cooling/ heating comfortably
3.7 4.3 6.3 4.7
5. Conclusion
This paper successfully built deterministic model in power engineering based on game theory. The result shows unique behavior of the active users toward electricity usage especially in using heating and cooling appliances. The user strategy is highly affected by the suffer cost. This suffer cost is related with the physical condition of the user, their financial condition, and their life style.
Table 6. Payoff for each user strategy with suffer cost 25, 20, 15
Temperature Expected
Low Medium High
User
Not use cooling/ heating
-5.0 0.0 5.0 0.0
Use cooling/ heating economically
1.7 3.1 5.7 3.5
Use cooling/ heating comfortably
3.7 4.3 6.3 4.7
Figure 3. Suffer cost vs. strategy selection (1=not use cooling/heating appliances, 2 use cooling/heating
appliances economically, 3 use cooling/heating appliances comfortably)
This model is practically applicable to be used in smart grid with dual bus system. Future development of this research can be directed to the development of probabilistic model of mutual support system in electricity generation and distribution.
Reference
Molderink A., Bakker V., Bosman M.G.C., Hurink J.L., and Smit, G.J.M. (2010). Management and control of domestic smart grid technology, IEEE Transaction on Smart Grid 1 (2).
Fang, X., Misra, S., Xue, G., and Yang, D. (2012). Smart grid – the new and improved power grid: A survey, IEEE
Communications Surveys & Tutorials 14 (4):
944-980.
Gu, W., Wu, Z., Bo, R., Liu, W., Zhou, G., Chen, W., and Wu, Z. (2014). Modeling, planning and optimal energy management of combined cooling, heating and power microgrid: A review, Electrical Power and
Energy System 54: 26-37.
Mulyono, N. B., and Ishida, Y. (2014). Humanitarian Logistics and Inventory Based
on Probabilistic Cellular Automata,
International Journal of Innovative
Computing, Information, and Control 10 (1).
Gharavi, H., and Ghafurian, R. (2011). Smart grid: The electric energy system of the future, Proceedings of the IEEE 99 (6): 917-921.
International Energy Agency (2002).
Distributed generation in liberalized
electricity markets.
Farhangi, H. (2010). The path of the smart grid, IEEE Power and Energy Magazine 8 (1): 18-28.
Azmy, A., and Erlich, I. (2005). Impact of distributed generation on the stability of electrical power system, Power Engineering
Society General Meeting 2:1056-1063.
Costa, L., Bourry, F., Juban, J., and Kariniotakis, G. (2008). Management of energy storage coordinated with wind power under electricity market condition,
Proceedings of the 10th International
Conference on Probabilistic Methods
Applied to Power System, 1-8.
Charilas, D. E., and Panagopoulos, A.D. (2010). A survey on game theory applications in wireless networks, Computer
Networks 54: 3421-3430.
Takuma, Y., Inoue, H., Nagano, F., Ozaki, A., Takaguchi, H., and Watanabe T. (2006). Detail research for energy consumption of residences in Northern Kyushu, Japan.
Energy and Building 38: 1349-1355.
Health and Safety Executive, Thermal
comfort,
http://www.hse.gov.uk/temperature/thermal/i
A
Mulyono, User
APPENDIX A
r Behavior Asse
A