VOLUME 16 ISSUE 3 (2018) Page 69 – 82
DEVELOPING A 3-D GIS MODEL FOR URBAN PLANNING. CASE STUDY: AMPANG JAYA, MALAYSIA
Mimi Zaleha Abdul Ghani1, Yazid Sarkom2 & Zalina Samadi3
1,2,3
Faculty of Architecture, Planning and Surveying
UNIVERSITI TEKNOLOGI MARA, MALAYSIA
Abstract
This paper aims to explore the rich potential of interactive visualisation environment integrating GIS for modelling urban growth and spatio-temporal transformation of Malaysian cities. As a case study example, authors consider a 3-D GIS model of Ampang Jaya, Selangor to investigate the techniques of data acquisition, data reconstruction from physical to digital, urban analysis and visualisation in constructing a digital model ranging from low to high geometric content including 2-D digital maps, digital orthographic and full volumetric parametric modelling. The key aspect of this virtual model is how it would assist in understanding the urban planning and design of Ampang Jaya by translating complex spatial information that are currently used by the authorities for planning activities such as maps, plans and written information into responsive, easily understandable spatial information. It could serve as a new platform to disseminate information about Ampang Jaya, bridge gaps among professionals involved in planning processes, improve communications among decision makers, stakeholders and the public as well as support decision making about the spatial growth of Ampang Jaya. Demonstrations of Ampang Jaya will also provide a clearer picture of the importance of ownership and control of 3-D models by local councils in empowering them in decision making, for example, in improving transparency, and avoiding misuse by project developers (Shiffer 1993; Sunesson et al., 2008). Such environment will improve the subsequent digital models and research in the area of urban design and planning in Malaysia where visual communication is pivotal.
INTRODUCTION
The general aim of Virtual Ampang Jaya is to assist planning activities in Malaysia and promoting the advantage of a ready visualisation of complex 3-D information. It will suggest how complex city information could be held within a 3-D environment which can be visually seen and made interactive by means of stronger coupling; embedding the 3-D model within the functions of GIS system as a more advanced version of weaker coupling (Batty, 2012). The planning issues and challenges of the urban context would be considered before designing the strategies of developing a case study involving the processes of modelling, data acquisition, data reconstruction, and finally the 3-D visualisation that is effective in serving a sense of understanding of a larger context of the building and its surroundings (Herbet & Xuwei, 2015).
In addressing the spatio-temporal transformation of Malaysian cities and towns, the government through its multimedia agency MDec is called upon to respond to the pressing need to develop expertise in the application of digital media in the Malaysian urban planning (Lee & Ahmad, 2000). Currently, there is a lack of study integrating 2-D GIS and 3-D models in the context of Malaysian planning practices, which are distinctive in terms of their policy, social and cultural context and administration (Abdullah, Abdullah, & Ibrahim, 2009; Rafi & Rani 2008). Set as an experimental test pad in the uptake of digital and multimedia in Malaysia, Virtual Ampang Jaya will explore the GIS analytical and querying capabilities with interactive visualisation environment while demonstrating the usefulness of 3-D visualisation and GIS in planning.
MOTIVATIONS
The development of 3-D GIS is large scale and complex multi-dimensional involving many aspects and involving theories and technologies (Rong et al., 2017). Planning information can be easily understood and disseminated to residents as the virtual model translates complex city information that is usually tailored to a specific group of professionals into responsive spatial information that will be more easily understood by layman amongst stakeholders who are not taught to read coded information such as plans and maps. Highly realistic model is a successful method in communicating with the public and have been used in the Malaysian context in advertising new large cities. While visualisation is amongst the most powerful tool for promoting urban changes, city officials, urban planners and the general public must be able to visualise urban plans along with all the infrastructure that already exists (Lopes & Lindström 2012). However, although studies on planning support system using 3-D visualisation and GIS are abundant, their role in the practice of urban planning since their emergence in the 1990s, and despite the long term use of 3-D visualisation tools in planning, is questionable. This could relate a wider range of problems including issues of developer and operator of the models, and whether the models enable new kinds of processes and new levels of engagement amongst users (Lopes & Lindström, 2012), as well as many studies in planning support system are not integrating real-world practice as they mainly involve stand-alone projects (Brail & Klosterman, 2001). Therefore, this study will involve real projects and the local planning authorities to help to demonstrate the true process and challenges of developing a 3-D visualisation and GIS model to enhance methods of current planning and consultation processes by decision makers and communicate with the various stakeholders including the public (Pietsch, 2000).
THE PROPOSED VIRTUAL AMPANG JAYA
As a planning support tool, 3-D modelling and visualisation can offer new ways in addressing thes issues affecting Ampang Jaya. Various scenarios can also be generated to study the urban impact with different sets of design parameters. As analytical tool to study the growth and spatio-temporal transformation of Ampang Jaya in 50 years since 1900, it will demonstrate and evaluate attributes of Ampang Jaya by adopting the Community Taxonomy (Florida House Institute, n.d.), according to four layers: social, economic, natural and the built environment. The interactive visualisation viewer in ArcGlobe® will offer a more meaningful understanding of Ampang Jaya, highlighting its urban layers that would otherwise be limited to the form of 2-D abstract data.
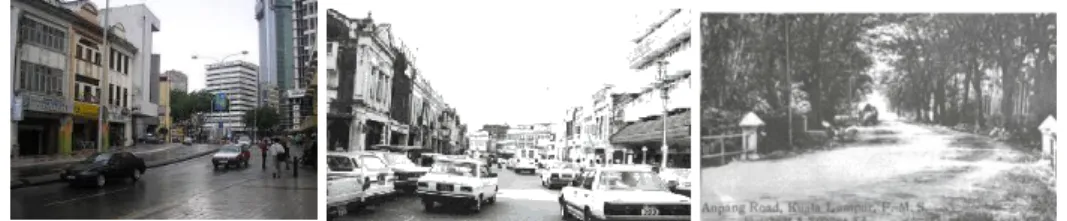
landscaping and site planning. This will enable people to visualise the future urban patterns and forecast the future direction of Ampang Jaya. As a predictive modelling tool, it will offer a new way to look at the past, present and future of Ampang Jaya than what is currently only available from photographs and written text (Figure 1).
Figure 1: The development of Ampang Jaya. (Left) In the early 1900’s. (Middle) In the 1960’s. (Right) In the 2000’s
The process of conducting the studies will provide a better understanding for local authorities in planning practices. The empirical knowledge of developing a 3-D GIS model from the studies in Malaysia will reflect on the existing challenges, mainly involving the local authorities including available data, resources and mindset. This will perhaps suggest a more practical use of the powerful 3-D GIS programmes equipped with large automated functions for subsequent digital models of towns and cities in Malaysia, facilitating research in the area of urban design and planning.
Data Acquisition, Reconstruction and GIS
orthophoto will generate the contour and Digital Terrain Model (DTM) that will provide the base map with real topographic structure and heights.
3-D Modelling
Traditional geometric constructions used by architects are generally based on CAD packages such as AutoCAD®, 3-D Max® which can offer highly precise geometries. The development from physical form to digital data for Ampang Jaya using GIS database and software is contrary to the traditional methods of geometric constructions used in city modelling. 3-D CAD models are often loaded with geometrical details, are heavy, require good operating skills and are time consuming to create. They also do not necessarily guarantee a high level of realism, defined as the mimicry of the physical environment in a virtual setting, as compared to accuracy, defined as correctness of the information utilised, modelled and depicted (Pietsch 2000). On the other hand, modelling methods such as texture mapping are inexpensive and can add realism to the virtual models displaying details in colour, texture and material. Rapid modelling usually utilise texture mapping, from oblique aerial, terrestrial images and panoramic image capturing.
Visualisation
The visualisation model will incorporate a movie of growing Ampang Jaya, displaying qualitatively and quantitatively responsive spatial data information on a time-line. While modelling software such as Sketch-Up® have enhanced their functions to incorporate geospatial and interactive visualisation, GIS software are becoming more actively engaged in virtual cities. The visualisation can be recorded and played in Windows Media Player® or Quick Time®, or further extended into VRML player such as Canoma®. Visualisation with GIS provides a new approach to urban design and planning in dealing with the problems of site location, large settlement design and community planning, public participation and a myriad of possibilities for offering solutions. Visualisation growth of Ampang Jaya will attempt to animate data layers through spatio-temporal; space and time animation and simulation in ArcMap, ArcScene and ArcGlobe to understand how they change with space and time. However, the data availability is a huge challenge in Malaysia, compared to the experience of other cities like Kyoto in Japan which had old topographic maps (Yano et al., 2006).
Data Layers
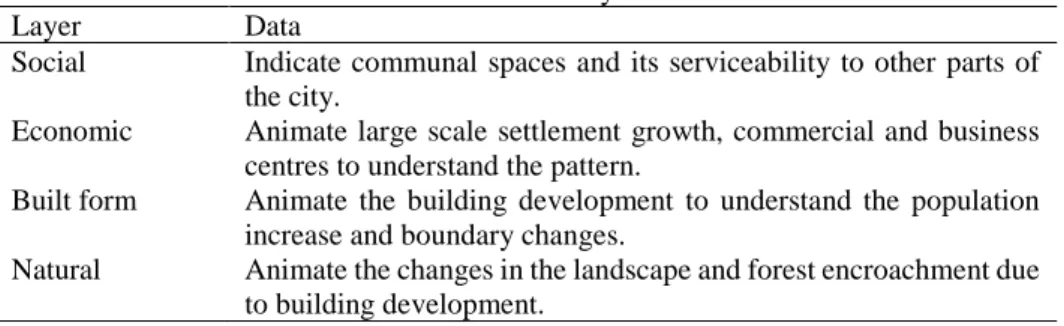
Data layers (Table 1) will be animated in ArcScene and ArcGlobe incorporating real time, where simulation scenes will be viewed by users from different angle and height, while users will be allowed to select or hide layers as they navigate through the scene (Figure 2). 2-D map tracking can be viewed simultaneously in ArcMap® to keep users on track.
Table 1: Data layers Layer Data
Social Indicate communal spaces and its serviceability to other parts of the city.
Economic Animate large scale settlement growth, commercial and business centres to understand the pattern.
Built form Animate the building development to understand the population increase and boundary changes.
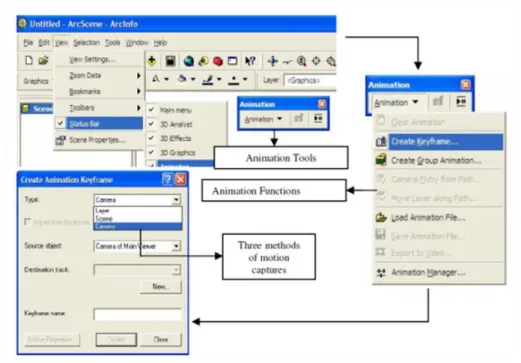
Figure 2: Example of animation development in ArcScene®
Source: Salleh (2008)
CASE STUDY: AMPANG JAYA
Urbanism
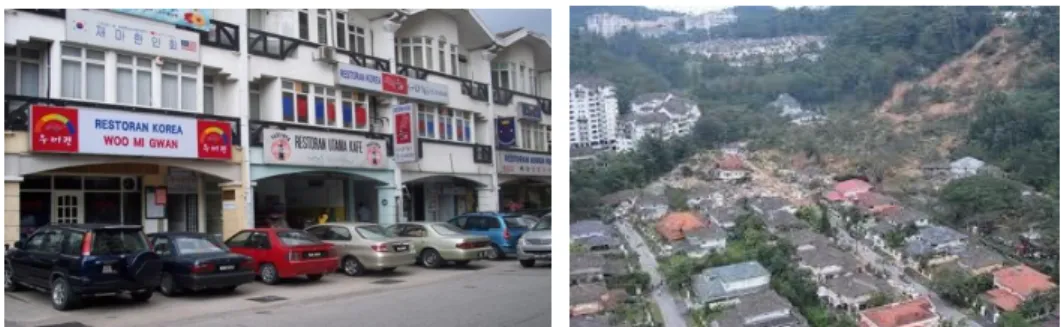
Figure 3: (Left) Little Korea. (Right) Hillside development in Ampang Jaya
While the authorities seek for a more comprehensive and meaningful information concerning Ampang Jaya in preparing them in dealing with the current issues and challenges (Ampang Jaya Municipal Council, 1998), the public are demanding more transparency in the planning processes. Apart from public pressure and the urge to gain public confidence, the local council is setting out to reorganise its planning and have a better control of Ampang Jaya.
The one-way traffic road system with ticket kiosks in the business district of Ampang Jaya was designed to replace the two-way system, aimed at reorganising the business areas while resolving the problems involving the sprawling stalls of petty traders. However, this new system results in winding traffic routes as it forces traffic to circle the business hubs and encourage business activities. Massive traffic congestion occurs when long queue of vehicles form along the parking booths as people are trying to pay for their parking tickets and obstruct the traffic flow. After just two years into installation, the authority has found the system ineffective and cannot cope with the increasing volume of traffic within the area. To resolve this, the authority has installed payment machines along the parking spaces to replace the parking booths. However, the one-way traffic route has not been revised to accommodate the new payment system. To make matters worse, illegal businesses soon made their way to fill the vacant booths, adding to the already chaotic traffic condition.
Data Acquisition, Processing and Reconstruction
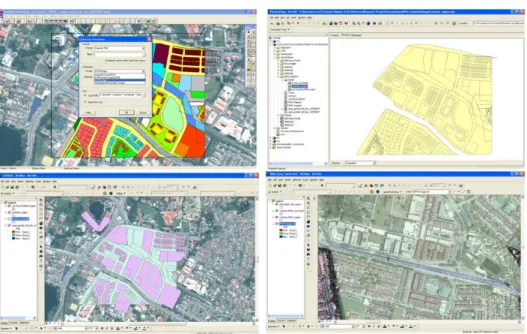
Like the majority of the local planning authorities in Malaysia which use GIS’s MapInfo program, authors were provided the GIS dataset in MapInfo data format (.TAB) that contains restricted data on land use and building lot parameter that covers approximately an area of 20 kilometre wide under the jurisdiction of the Ampang Jaya Municipal Council. The satellite images provided by the local council is considerably poor in resolution compared to those from the Malaysian Survey and Mapping Department (JUPEM). Although detailed current topographic maps, cadastral maps, road system and other information of the city are readily available from the local council, other data layers from relevant departments are insufficient. Past information from the local council’s archive is scarce as the local council is a reasonably new municipal. Additional information such as the draft of the amended local plan and other planning documents provide authors with support materials for model development. Authors also carried out photographing the building blocks and the immediate surroundings of a selected commercial area of Ampang Jaya for the purpose of texture detailing. As illustrated in Figure 5, the project utilises ArcGIS desktop software version 9.3, including its components: ArcCatalog, ArcMap and its visualisation tool; ArcScene. SketchUp® is the preferred modelling software for its integrated functionality and compatibility with ArcGIS although its rendering and detailing capability is slightly compromised when compared with several other powerful CAD software.
Figure 5: Data conversion from MapInfo to ArcGIS
Figure 6: Development of 3-D GIS model.
Analysis and Outcome
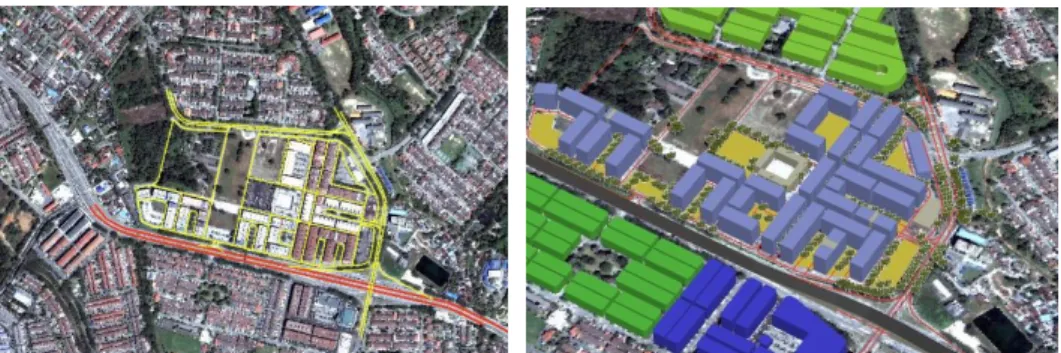
consider the various urban fabrics of Ampang Jaya. GIS visualisation enables the traffic engineers to predict the pattern of traffic flows in context of the current surrounding buildings (Figure 7), as well as the planned future buildings using 2-D ArcMap. Using its 3-2-D component in ArcScene, the traffic information is further translated into easily understood form as it merges with spatial 3-D visualisation. As a common tool, it provides the spatial platform to merge building information from the Building Department of the local council with the road and traffic information from the Engineering Department of the council to be further discussed among relevant agencies such as the Road and Works Department, the Traffic Department, the Police Force and the stakeholders that include the shop owners and the affected public.
Figure 7: The 2D view of traffic route marked in red and yellow lines in ArcMap. The 3D view of traffic and parking system in ArcScene
The outcome of the study is expected to support planning decisions and facilitate consultation processes between councils and stakeholders and improve the dissemination and management of spatial information about urban environments. Reframed in a virtual setting, the interactive model has the potential to attract public participation and to develop better understanding among the public about their city. As the web is becoming a common platform for the wider audience, it can provide the interface for Virtual Ampang to disseminate up-to-date planning information as well as to communicate current issues and future plans while generating feedback from the general public.
CONCLUSION
by translating easily understandable spatial information enabling a more comprehensive understanding of Ampang Jaya and helping bridge the gap between different professionals for better planning outcomes. Adopting 3-D modelling and visualisation also correlates with the call for electronic government (e-govt), a flagship application of the Multimedia Super Corridor (MSC) project that aims to redesign the system of the government to bring about fundamental changes from the society level (Lee & Ahmad, 2000), as well as meeting global information technology expectations and future challenges. While it may provide as a guideline for the use of computing in planning for the authorities in Malaysia, the model can be further developed into a prototype that may incorporate GeoImmersive videos into GIS environments. Its use for modelling different scales of urban development can also suggest the appropriate hardware and integration of software that are deem suitable.
While Virtual Ampang Jaya attempts to explore the GIS analytical and querying capabilities with interactive visualisation environment, the case study is an infant project in testing the model for analysis that integrates CAD with limited application of GIS software with the available data commonly maintained by planning authorities in Malaysia. Its effectiveness for urban and planning analysis is heavily challenged by many factors, primarily data availability and accuracy that includes lack of data layers and substandard satellite image. As a result of these, several automated tools designed to facilitate the process cannot be explored, for example, the extrusion technique in ArcScene. Lack of resolution in the satellite image has made it ineffective to conduct 3-D analysis of the buildings in context of its surroundings as the pixelated ground image from perspective views hardly represents a virtually realistic environment.
ACKNOWLEDGEMENT
We would like to thank the staff from the Planning and Building Departments of the Ampang Jaya Municipal Council for the contribution of information and data used in this research.
REFERENCES
Abdullah, M. F., Abdullah, A., & Ibrahim, M. (2009). Institutionalisation of spatial planning and decision support system for planning and governance in Malaysia. In A. Abdullah & D. Geneletti (Eds.), Spatial decision support for urban and environmental planning: A collection of case studies (pp. 153-166). Shah Alam, Malaysia: Arah Publications.
Ampang Jaya Municipal Council (1998). Ampang Jaya Structure Plan 1995-2020. Selangor: Author.
Arribas-Bel, D., Kourtit, K., Nijkamp, P., & Steenbruggen, J. (2015). Cyber Cities: Social media as a tool for understanding cities. Applied Spatial Analysis and Policy, 8(3) 231-247.
Batty, M. (2012). Smart cities of the future. The European Physical Journal Special Topics, 214(1), 481-518.
Brail, R. K., & Klosterman, R. E. (2001). Planning support systems: Integrating geographic information systems, models and visualization tools. California: ESRI Press.
Florida House Institute (n.d.). A framework for vision-based planning: A taxonomy for communities. Florida: Author.
Fragkias, M., & Seto, K. C. (2007). Modeling urban growth in data-sparse environments: A new approach. Environmental and Planning B: Planning and Design, 34, 858-883.
Herbet, G., & Xuwei, C. (2015). A comparison of usefulness of 2D and 3D representations of urban planning. Cartography and Geographic Information Science, 42(1), 22-32.
Federal Department of Town & Country Planning Peninsular Malaysia [FDTCP] (2006). National urbanisation policy. Malaysia: Author.
Lee, L. M., & Ahmad, M. J. (2000, March). Local authority networked development system. Planning Digital Conference. March 28-29, 2000, Penang, Malaysia. Lopes, C. V., & Lindström, C. (2012). Virtual cities in urban planning: The Uppsala case
study. Journal of Theoretical and Applied Electronic Commerce Research, 7(3), 88-100.
Pietsch, S. M. (2000, September). The pursuit of realism in urban visualisation models.
Habitus 2000. September 5-9, 2000, Perth, Australia.
Rafi, A., & Rani, R. M. (2008, May). Visual Impact Assessment (VIA): A discussion on computer-based methodologies used for urban streetscapes. International
Conference on Environment Research and Technology (ICERT 2008). May
28-30, 2008, Penang, Malaysia.
Salleh, S. A. (2008). The integration of 3D GIS and virtual technology in the design and development of GIS-based residential property marketing information system
(Master thesis). Universiti Teknologi MARA, Shah Alam, Selangor, Malaysia. Shamsuddin, S., & Ujang, N. (2008). Making places: The role of attachment in creating
the sense of place for traditional streets in Malaysia. Habitat International, 32(3), 399-409.
Shiffer, M. J. (1993, October). Augmenting geographic information with collaborative multimedia technologies. 11th International Symposium on Computer-Assisted
Cartography (Auto-Carto). October 30- November 1, 1993. Minneapolis,
Minnesota, USA.
Sunesson, K., Allwood, C. M., Paulin, D., Heldal, I., Roupé, M., Johansson, M., & Westerdahl, B. (2008). Virtual reality as a new tool in the city planning process.
Tsinghua Science and Technology, 13(S1), 255-260.
Thuzar, M. (2012). Urbanization in Southeast Asia: Developing smart cities for the future? In M. J. Montesano & Lee P. O. (Eds.), Regional Outlook: Southeast Asia 2011-2012 (pp. 96-100). Singapore: ISEAS Publishing.
Yano, K., Nakaya, T., Isoda, Y., Takase, Y., Kawasumi, T., & Matsuoka, K. (2006, August). Kyoto Virtual Time-Space. Annual ESRI International User Conference. August 7-11, 2006, San Diego, California, USA.