Predicting Temperature after Rotating Heat Exchanger
Rotating heat exchangers (RHEs) arecommonly used in power plant installations to transfer energy from a hot exhaust gas stream to an incoming fresh combustion air stream. The process used to transfer the thermal energy is to heat up a solid using the hot gas stream and then rotate that hot solid into the cooler air stream where it releases its thermal energy. By pre-heating the cooler air prior to combustion, the overall efficiency of the plant is improved.
Airflow Sciences Corporation recently developed an efficient method for including the effects of a RHE in a Computational Fluid Dynamics (CFD) model. Figure 1 details a typical duct geometry that could be modeled using this new method. Note this model begins at the boiler outlet where the hot flue gas passes down through the rotating heat exchanger (shown in green) and then
continues on to the electrostatic precipitators. Using this new capability, the expected temperature stratification due to the rotating heat exchanger is predicted by the CFD model, as shown in Figure 2. By including the temperature effects of the RHE, the model can predict the propagation of this
stratification in the downstream ductwork as well as any significant temperature
variations at the precipitator inlet. Temperature stratification is an important consideration in sorbent injection models, as the efficiency of Activated Carbon Injection (ACI) for mercury capture is impacted by the gas temperature profile at the point of adsorption. ESP performance can also be impaired by
highly stratified
temperatures – at typical cold-side ESP operating temperatures, flyash resistivity increases with temperature, which could
lead to reduced collection efficiency in regions where the gas temperature is
significantly higher than the mean. Modeling of RHE temperature stratification gives ASC another tool to ensure that design of sorbent injection systems and ESP flow control devices is optimized for performance.
A I R F L O W S C I E N C E S C O R P O R A T I O N
T
he
A
ir
fl
ow
U
pd
at
e
T
he
A
ir
fl
ow
U
pd
at
e
Winter 2015
Edited by Julie Pierce A I R F L O W S C I E N C E S C O R P O R A T I O NT
he
A
ir
fl
ow
U
pd
at
e
T
he
A
ir
fl
ow
U
pd
at
e
A I R F L O W S C I E N C E S C O R P O R A T I O N Celebrating 40 Years Staff NewsThe staff has expanded in several functional areas: engineers Hunter Layson and former intern Andy Senita, administrative assistant Rachel Trombley, lab technician Tony Giacinto, and CAD designer Doug Grosjean. 2014 summer interns were Tyler Smith, William Puerner, and Bridget Cook.
Kanthan Rajendran's studying paid off; he earned his Professional Engineer certification in March. Congratulations!
Some important deliveries occurred in April. Jeff Everett and wife Betsy welcomed their third daughter, Tessa. Tiffany Lee and husband Edgar welcomed their fourth child, Nathanael.
Kirsten and Matt Gentry were married in August. Best wishes together!
Figure 1: Flue Gas Ductwork from Boiler through Rotating Heat Exchanger to Precipitator
Figure 2: Flue Gas Temperature Distribution Downstream of Rotating Heat Exchanger
Hot Flow Physical Model Study of Flyash
Re-entrainment at Gulf Power Plant Crist
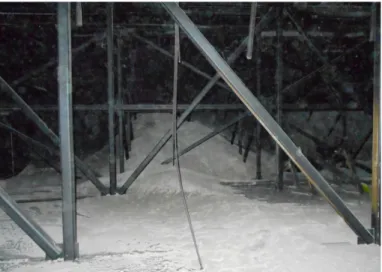
Flyash deposition and build-up is a common problemat coal-fired power plants which can lead to significant performance and maintenance issues. Figure 1 shows a typical accumulation of flyash in a duct. These deposits can grow over time and lead to major performance issues and maintenance costs. The root cause of the flyash build-up is generally a localized low-velocity zone or dead flow region. The problem is exacerbated when the plant operates at lower output and thus the overall flow rate and velocities are reduced.
Flow modeling is a standard engineering approach to understand and resolve these flyash accumulation problems. A typical flow model study can utilize Computational Fluid Dynamics (CFD) and/or laboratory physical modeling techniques to evaluate and minimize the potential for excessive ash accumulation in the
ductwork. CFD provides an effective means of identifying low-velocity regions where build-up may occur and evaluating potential design modifications quickly and efficiently. Scale physical models are also used to assess velocity patterns in these ductwork systems. The physical model “dust tests” are then conducted using a model dust that simulates the drop-out and re-entrainment behavior of the plant ash. These laboratory tests tend to give a better assessment of the expected patterns of build-up than can be predicted by the CFD model, as well as provide a visual representation of the drop-out and re-entrainment
behavior.
Traditionally, physical model dust tests have been performed using a laboratory dust (sand, cork, salt, etc.) that simulates the flyash behavior. It is often left to the
modeler to determine the best method of mimicking the actual flyash aerodynamic behavior using the laboratory dust. Over the past decade, Airflow Sciences Corporation (ASC) has refined its procedure of using a wind tunnel to determine these aerodynamic characteristics. Wind tunnel testing of both the actual plant flyash and the laboratory dust is performed, and the aerodynamic properties are appropriately scaled when performing the model dust testing. Both the wind tunnel testing and the model dust tests are performed at ambient laboratory conditions, roughly 70 ºF [21 ºC], which is why this type of modeling is referred to as “cold flow” physical modeling. Figure 2 shows a typical example of a physical model during dust testing.
Physical model testing using this methodology has shown acceptable correlation to the full scale for many actual plants. There are some cases, however, where the model results do not correlate as well as desired with the full scale. Two of the major factors that appear to cause correlation issues are a) flyash type/composition and b) operating temperature. The two are inter-related, because it is the “stickier” ashes, such as Powder River Basin (PRB), that tend to exhibit different behavior in an operating plant compared to a lab environment. For instance, PRB ash will form piles on horizontal surfaces with an angle of repose of 60º or larger; PRB will also cling to vertical surfaces. In a laboratory environment, neither PRB nor model dusts display this behavior. Both PRB and other ashes will bridge across small gaps (such as catalyst openings or heat exchanger tubes) in an operating plant, but will not bridge similar gaps in an ambient temperature laboratory environment.
A I R F L O W S C I E N C E S C
Figure 2: Dust testing in a cold flow physical model Figure 1: Typical accumulation of flyash in a coal-fired power
plant duct
Winter 2015 Newsletter, page 2 of 6
New Corporate Affiliation
Airflow Sciences Corporation is proud to be a member of the American Lightweight Materials Manufacturing Innovation Institute (ALMMII), a public-private partnership that will develop and deploy advanced lightweight materials manufacturing technologies, and implement education and training programs to prepare the workforce.
ALMMII was selected through a competitive process led by the US Department of Defense under the Lightweight and Modern Metals Manufacturing Innovation (LM3I) solicitation issued by the U.S. Navy’s Office of Naval Research.
Hot Flow Physical Model Study of Flyash
Re-entrainment at Gulf Power Plant Crist (cont)
To develop more accurate correlations between actualflyash behavior and scale model dust testing, ASC has been conducting research with its “Hot Wind Tunnel”. This system is capable of achieving a highly-controlled flow velocity with temperatures up to 650 ºF. The Hot Wind Tunnel runs on heated air and features a particle injection system that can preheat the particulate as well. Although the Hot Wind Tunnel does not yet simulate actual flue gas chemical composition or moisture content, it is ASC's experience that the temperature seems to play a primary role in the flyash aerodynamic behavior.
Using the Hot Wind Tunnel, ASC can more closely simulate actual plant operating conditions (velocity, density, viscosity) and provide a more accurate prediction of the aerodynamic behavior of the flyash. ASC research using this tunnel has involved both horizontal and vertical flow situations.
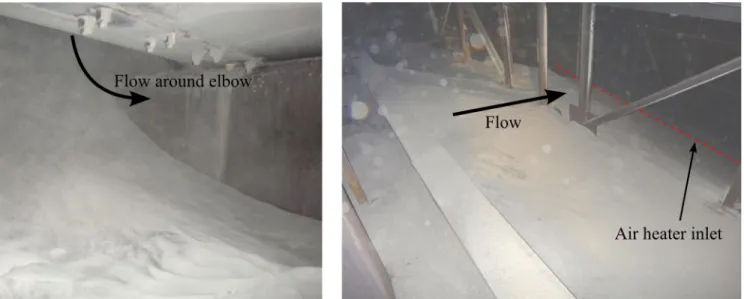
Recently, Gulf Power was experiencing a flyash accumulation issue that was affecting operational performance of Unit 6 at the Crist Generating Station. Plant Crist Unit 6 is a 370 megawatt coal-fired power boiler located in Pensacola, Florida. The plant was having an air heater pluggage issue as shown in Figure 3.
Observations inside the plant ductwork showed significant ash buildup in the SCR outlet duct and on the floor of the air heater inlet duct (Figure 4). The ash was building up in the outside corner of a duct elbow, and although this type of localized deposit often causes no operational issues, in this case the elbow happened to be the final turn before the flow entered a horizontal air heater. Over time, the deposition in the corner would
grow, especially under lower load plant operation when flow velocity in the duct was low. The ash pile would thus grow toward the air heater, eventually causing a
significant pluggage issue due to blinding of the air heater flow passages. Over time, the system pressure drop would increase due to the plugged air heater, and the unit output had to be curtailed since the fans could not accommodate the pressure losses. Gulf Power would clean the air heater and duct each maintenance outage, but then would observe the air heater pressure drop gradually increase over time. Eventually unit load had to be derated until the next available outage for cleaning.
Winter 2015 Newsletter, page 3 of 6
Figure 4: Plant Crist photos indicate that ash buildup in the ductwork upstream of the air heater was causing a significant pluggage issue.
Figure 3: Gulf Power Company's Plant Crist geometry and location of ash accumulation upstream of air heater (AH).
Celebrating 40 Years
Bob Gielow and Jim Paul started Airflow Sciences in 1975. They applied the knowledge they had gained in the aerospace industry to solve flow problems for a variety of industrial clients. Today we have almost 40 employees, and have provided engineering services and equipment on over 3000 projects to clients in over 30 countries.
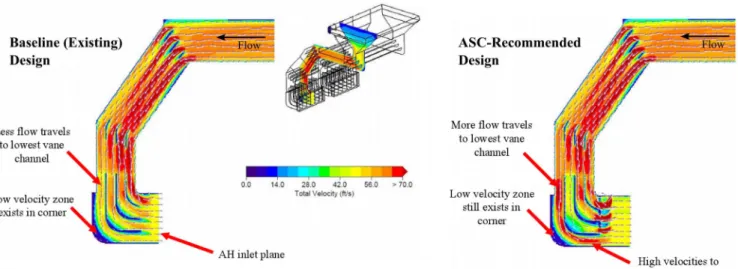
ASC started working with personnel from Gulf Power and its parent Southern Company to solve this flow problem and develop low-cost design recommendations that could be implemented during an upcoming outage. ASC conducted CFD flow simulations of the upstream ductwork, identifying low velocity regions and flow recirculation zones. The modeling simulated several unit operating conditions, with a focus on low load for ash accumulation and full load for pressure drop and velocity
patterns at the air heater. The model was used to
investigate a variety of modifications including alterations to the existing turning vanes and localized changes in cross sectional area. Several potential design
modifications were identified to increase the gas velocity along the duct floor where the most significant ash build-up was observed. CFD results from the baseline and recommended design solution are shown for low load (Figure 5) and high load (Figure 6) operations.
Figure 6: CFD results at full unit load from the SCR to air heater duct show the deficit in flow near the floor for the baseline design (left). When the design recommendations were incorporated (right), velocities in the lowest vane channel were increased, resulting in improved re-entrainment of any flyash deposits on the floor during high load operation. Figure 5: CFD results at low unit load from the SCR to air heater duct (baseline – left, recommended design – right). Results show an increase in velocity along the floor, resulting in a reduction in ash drop-out during low load operation.
Conferences/Exhibits (complete list on website) Come visit our booth, or hear a presentation. EnergyGen Bismark, ND January 27-29 Reinhold NOx Combustion RoundTable Richmond, VA February 23-24 EPRI CEMS Richmond, VA June 3-5
Reinhold APC RoundTable & Expo Atlanta, GA July 13-14 Process Expo Chicago, IL September 15-18
ASM Heat Treat Show Detroit, MI
October 21-22 Your Office
Host a seminar on modeling, fluid flows, or heat transfer. We make house calls!
Hot Flow Physical Model Study of Flyash
Re-entrainment at Gulf Power Plant Crist (cont)
To verify the CFD solution to the air heater pluggageissue at Plant Crist, a physical model representing the Unit 6 ductwork from the SCR outlet to the air heater inlet was constructed. Because of the sticky nature of the flyash and the unique, time-dependent behavior of the flyash
deposition, it was decided to do more than just the “standard” cold flow physical modeling. So a “Hot Flow” physical model was devised, and ASC's Hot Wind Tunnel was converted to match the complex geometry of the actual plant ductwork. This includes the duct routing, the internal turning vanes, and the air heater. In order to fit within the dimensions of the existing Hot Wind Tunnel components, the model was built at 1/30 scale, using stainless steel ductwork with clear windows for viewing (Figure 7). Instead of using a simulated laboratory dust, actual flyash from Plant Crist was used.
Figure 7: Physical model with clear windows for viewing ash flow during Hot Wind Tunnel operation.
Winter 2015 Newsletter, page 5 of 6
New Field Test Equipment
Water-cooled 3D probe for velocity measurements
in hot environments, such as HRSG or simple-cycle turbine. (left)
ISO 9931 with Automated Probe Actuation TM for improved
primary air and pulverized fuel flow measurement. (below)
Multiple Automated Probe (MAPTM) System for stack flow measurements
according to EPA Method 1, 2, 2G, 2H. (above)
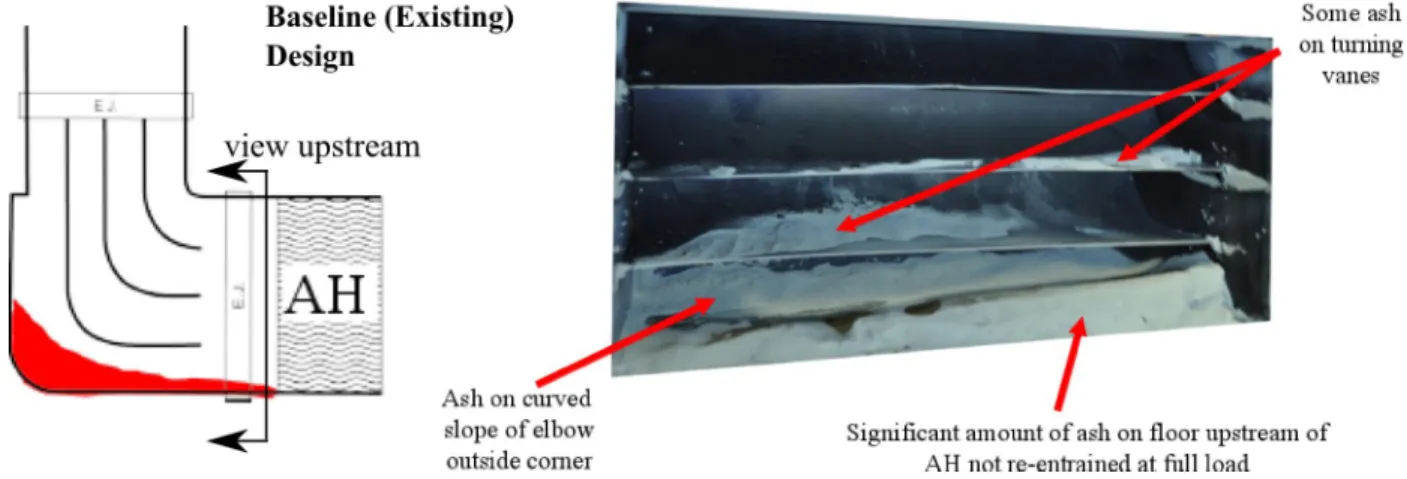
With the Hot Flow physical model, dust tests were conducted for both the baseline and CFD-recommended design configurations. Baseline test results indicated patterns of accumulation similar to plant observations (Figure 8). When the CFD design recommendations were implemented, there was a significant reduction in the amount of ash accumulation on the duct floor at low load, as anticipated. At full load, the quantity of ash remaining on the duct floor and turning vanes was significantly reduced (Figure 9).
Based on ASC's recommendations and the strong correlation between the CFD model and the Hot Flow
physical model, Gulf Power incorporated the design modifications to Unit 6 during the outage. Over
subsequent periods of operation, it was observed that the air heater pressure drop increased only slightly over time. This was considered to be due to normal fouling, and no significant pluggage occurred. During a later plant inspection during an outage, it was reported that dust accumulation in the ductwork was minimal, matching the Hot Flow physical model results. Overall, Plant Crist personnel are very pleased with the outcome of the modeling study, and air heater pluggage is no longer an issue.
Figure 8: Baseline physical model results showed similar dust accumulation to what was identified at the plant.
Figure 9: Ash accumulation can be viewed during operation (left) of the physical model. With the recommended flow control devices, ash accumulation (right) was reduced.
Contacting ASC
www.airflowsciences.com [email protected] Western Region Office P.O. Box 22637 Carmel, CA 93922-0637 phone: (831) 624-8700 Headquarters 12190 Hubbard Street Livonia, MI 48150-1737 phone: (734) 525-0300 Southeastern Region Office 1906 Arrowhead Dr NE St. Petersburg, FL 33703-1904 phone: (727) 526-9805