Digital
Distribution
Report
THE PERFORMANCE
OF DOCUMENTARIES
ON DIGITAL SERVICES
IN CANADA
Digital Distribution Report
THE PERFORMANCE OF DOCUMENTARIES
ON DIGITAL SERVICES IN CANADA
E xEC UTIVE SU M MARy . . . . 5
I NTRO D U CTIO N . . . . 7
D IG ITAL CANADA . . . . 11
B ROAD CASTER D IG ITAL SERVI C ES . . . . 17
NFB PL ATFO R M S . . . . 25
ROG ERS O N D EMAN D O NLI N E . . . . 35
ITU N ES . . . . 39
TR EN DS I N D OC U M ENTARy D ISTR I B UTIO N . . . . 4 5 N E xT STEPS . . . . 51
List of Acronyms
BDU
Broadcasting distribution undertaking CBC
Canadian Broadcasting Corporation CMF
Canada Media Fund, formerly the Canadian Television Fund CMPA
Canadian Media Production Association,
formerly the Canadian Film and Television Production Association CRTC
Canadian Radio-television and Telecommunications Commission DOC
Documentary Organization of Canada MBPS
Megabits per second NFB National Film Board
RODO
Rogers On Demand Online SRC
Société Radio Canada SVOD Subscription video-on-demand TVO TV Ontario VOD Video-on-demand
5 T H E PE R FO R M A N C E O F D O C U M E NTA R I ES O N D I G ITAL S E RV I C ES I N CA NADA
Executive Summary
More Canadians are using digital platforms to access professionally produced video content. Over the course of the last 5 years:
• Reported usage of video-on-demand among the French market rose from 7% to reach 17%, whereas reported usage in the English market increased by 6% to reach 15%.
• Reported usage of Internet video in the French market jumped from 26% to 29%, and reported usage in the English market also rose substantially, from 30% to 51%. • Reported usage of mobile video in the English market increased from 2% to 9%,
while reported usage in the French market climbed from 1% to 4%.
As part of an expansive audiovisual offer, documentaries are available on a wide range of services with differing results.
Between 2009 and 2011, documentary viewership rose on these services. Services with large accessible libraries are the most popular, namely the NFB and broadcaster portals. Less-accessible services yielded fewer total requested views such as Rogers on Demand Online (RODO).
• Over the course of one year, documentaries on History Television’s portal had 1.5 million total requested views.
• Over the course of one year, NFB.ca had 2.5 million total requested documentary views worldwide, and 150,000 total requested documentary views on its mobile applications (iPhone, and iPad).
• On RODO, total documentary viewership exceeded 28,000 total requested views over a 10-month period.
Tracking viewership for the most popular titles over the course of a year indicates that individual titles do not reach high viewership.
• In Canada, the average viewership of a popular feature documentary on a broadcaster portal is 8,000 views over the course of a year.
• The top-viewed episode of a documentary series garners almost 60,000 views over the course of a year.
• The average viewership of the most popular English documentary titles on NFB.ca is 64,702 views (worldwide) over the course of a year and 37,226 views for French (worldwide).
• The average viewership of the top 5 English titles on the NFB’s mobile applications is 12,556 views a year (worldwide) and 4,372 French (worldwide).
6 D I G ITAL D I ST R I B UTI O N R E P O RT Because of difficulty in obtaining trackable data, it is impossible to provide the number of
downloads of Canadian documentaries on iTunes. However, tracking the ranking of Canadian documentaries in the top 200 rankings allows for an assessment of their popularity. The frequent appearance of Canadian documentaries in the top 200 titles indicates that a limited library can attract viewers.
• On iTunes, Canadian documentary features occupied 10% of the spots in the top 200 documentary purchase rankings per week, during a 6-month period.
• On iTunes, at least one Canadian documentary television series appears in the top 200 television series purchase rankings per week, during a 6-month period.
Digital technology allows Canadians to watch professional content whenever and wherever they want, but the increased convenience has yet to yield the same viewership as television. The most popular documentaries on television garner a 900,000 “Average Minute Audience” in the English market, whereas television documentaries in the French market receive Average Minute Audiences of above 1 million.
There is much excitement and hype about digital distribution and the inherent possibilities it offers to connect audiences and content. Popular wisdom would have us believe that Canadian audiences expect content to be available on every channel and platform. The adage is “content anytime, anywhere”. However, the numbers show that audiences are still primarily turning to television in large numbers. What the numbers fail to show on the digital distribution side is that the business case to make content available has yet to emerge. And digital piracy further erodes the digital revenue streams.
Irrespective of the absent business case, producers, broadcasters and distributors are expected to enter this uncertain market. At this time, Internet service providers benefit from more traffic; technology companies increase their sales of digital media devices; and Canadians have greater access to content. On the other hand, content creators question whether digital distribution will yield anything more than greater exposure.
7 T H E PE R FO R M A N C E O F D O C U M E NTA R I ES O N D I G ITAL S E RV I C ES I N CA NADA
Introduction
What does Canada’s ongoing digital revolution mean for its documentary sector? On the one hand, it presents many opportunities to filmmakers and viewers: ubiquitous access, instant international market reach, self-distribution, and a growing number of new platforms. On the other, it creates new challenges to broadcasters and distributors: piracy, tracking viewership, increased concentration of ownership, and audience fragmentation.
Canada’s documentary sector wants to exploit digital distribution to reach new audiences by distributing its content across the nation and the world. Canada is a receptive digital market. It is one of the most digitally connected countries in the world, and our consumers are rapidly adopting digital video services. There is also government support: the Canada Media Fund’s (CMF) mandate is to promote innovation and reach audiences. It appears that now is the time to dive right in.
Currently, there are no benchmarks or measures of success against which the documentary industry can judge its performance in the digital market. Without intelligence, the entire
industry is blindly venturing into a radically different commercial setting. In order for producers, distributors, policymakers, and funders to achieve each of their respective ends, they need a basis of comparison.
The Digital Distribution of Documentaries Report is an environmental scan of Canada’s documentary digital distribution services. It provides statistics regarding the performance of documentaries on some of Canada’s most popular documentary platforms. An argument is advanced for the creation of benchmarks and indices that would allow the industry to experiment, embrace, and exploit the digital market in Canada.
Overview
The report is divided into six chapters: Digital Canada, Broadcaster Digital Services, National Film Board (NFB) Platforms, Rogers On Demand Online (RODO), iTunes and Trends in
Documentary Distribution, followed by a conclusion. The Digital Canada section sets the stage by providing a brief introduction about our digital present: how many Canadians are connected, and how they consume content. A list of the digital business models and strategies is provided followed by a synopsis of the current communications environment, which examines the major players in Canada’s digital video market.
The Digital Canada section sets the stage by providing a brief introduction about our digital present: how many Canadians are connected, and how they consume content. A list of the digital business models and strategies is provided, followed by a synopsis of the current communications environment, which examines the major players in Canada’s digital video market.
The Broadcaster Digital Services section investigates how documentaries perform on online video portals and their mobile applications. This section examines the size of documentary libraries on each service, documentary viewership on the platforms by origin (Canadian vs. non-Canadian) and format, and the top five titles on each service.
8 D I G ITAL D I ST R I B UTI O N R E P O RT NFB Platforms explores the performance of documentaries by Canada’s most robust
documentary distributor. The section probes the composition of its library and the popularity of different titles by segmenting data by device, format, language, and origin of viewers and viewership habits.
Rogers On Demand Online spotlights documentaries on TVeverywhere services through an examination of RODO. This section scans documentary viewership, the number of titles in the RODO library and top-performing titles and services on RODO.
The iTunes Store is the focus of the next section. Distilling insights from a 26-week log of iTunes’ top 200 rankings, this section analyses the popularity and performance of feature films and television documentaries on this highly successful digital download service.
In Trends in Documentary Distribution, the report summarizes key insights garnered from the previous sections and presents an evaluation of the performance of documentaries in Canada. The final section, Next Steps, outlines recommendations for further research and discusses the future of documentaries on digital platforms.
A list of definitions of commonly used terms in this report is compiled on pages 54 and 55.
Methodology
Unlike the television and theatrical market, the digital distribution sector lacks any standardized measurement agencies or standards. As a result, there is no centralized agency where one can collect data related to all of the digital distribution services. Instead, the Documentary Organization of Canada (DOC) requested data from individual services. Depending on the policy of the service, data may be easily obtained and segmented with ease (participating broadcasters and the NFB), or it may be placed under lock and key, never to be shared (iTunes). Total requested views were chosen as a baseline for viewership because they indicate intention on the part of the user to watch the video. The number of documentary titles in the library was used to indicate how much selection was available to the user.
When data flowed less openly, as was the case with iTunes, the top 200 rankings were used as the primary data source for evaluating the performance of documentaries, because they indicate which content was purchased most frequently. For 26 weeks, DOC logged the top 200 rankings for documentary feature film purchases and the top 200 rankings for television series and episodes. For the first 15 weeks, DOC tracked the top 200 rankings for documentary feature film rentals until iTunes discontinued the publication of this information on their store.1
Because the disclosure of data is determined by the service, only the services that responded to requests and whose data fulfilled the report’s specifications have been included.
The implications for our study are:
• It is not as exhaustive as planned; many services are not included (VOD, other broadcasters).
• It is not as rigorous as desired: some data is not comparable across services; and
9 T H E PE R FO R M A N C E O F D O C U M E NTA R I ES O N D I G ITAL S E RV I C ES I N CA NADA
• It lacks strong conclusions about digital downloads: the success of some services (particularly iTunes) are speculated upon in the absence of hard data.
Methodological issues by section
B ROAD CASTER D IG ITAL SERVI C ES
At the outset of the project, DOC contacted all Canadian broadcasters who broadcast documentaries on their channels and appeared to stream them online. DOC requested data from 11 broadcasters/corporate groups/broadcaster services but only four returned data that could be used in the report. Four broadcasters agreed to to provide the requested data while others who didn’t have any documentary content on their portals could not fulfill the data request.
Each participating broadcaster was requested to deliver the total requested views of documentaries on their platforms by origin (Canadian vs. non-Canadian), the number of documentaries in their libraries by origin for the 2009–10 and 2010–11 (as much as possible) broadcast-years, and the top five documentary titles of a single year. Given the absence of participating French-language portals, the data request did not contain segmentation by language.
As for mobile applications, most broadcasters had yet to launch, or their mobile applications did not have any documentaries in their libraries. Thus, no data was collected related to mobile applications.
NFB APPLI CATIO NS AN D OTH ER D OC U M ENTARy PO RTALS
The NFB provided ample data on the performance of documentaries on their platforms. DOC asked for total requested views, total documentary titles on their various platform libraries, and the top five rankings for both mobile and online platforms. Total requested views were segmented by format, language, origin of viewer, and platform. Total documentary titles were segmented by format, language, and platform. Top five rankings were segmented by origin of viewer (Canadian, non-Canadian, and total), format, and device (mobile and online).
Due to the unavailability of data from other sources, the documentary portals section focused solely on the NFB’s range of services.
ROG ERS O N D EMAN D O NLI N E
Rogers provided viewership statistics, top-performing titles, and the total number of
documentaries in the library. It gave a ranked list of the top performing documentary services and top performing documentaries on its service but was unable to provide corresponding total requested views.
ITU N ES
Apple Canada refused to share any data on the iTunes Store. As a result, we compiled our own findings as outlined in the methodology above.
10 D I G ITAL D I ST R I B UTI O N R E P O RT VO D
VOD services are a partnership between pay-TV, specialty services, and broadcasting distribution undertakings (BDUs). In the original scope of the report, VOD services were to appear in their own section. Unfortunately, due to methodological issues and lack of data available from players in the VOD market, there was insufficient data to analyze the performance of documentaries on these services.
As a result of these methodological issues, the report focuses on services that are able to provide sufficient data, namely English-Canadian digital distribution services.
Measurement issues
There are still many measurements regarding the digital distribution of documentaries that were not collected in this report, for instance:
• total downloads of documentaries on digital download services. • total revenue derived from documentaries on digital services;
• total ad revenue derived from documentaries on ad-supported services; • total viewership of ad-supported services in French language markets; • the number of documentaries on VOD services (transactional, ad-supported,
and subscription);
• the total requested views of documentaries on VOD services; and • the total viewership of documentaries on Netflix.
It is at the discretion of services to disclose this information; a large portion of it is proprietary. However, if the services shared data more openly, researchers could create more rigorous and standardized research about digital distribution. The resulting intelligence would greatly benefit all players of the sector.
Currently, there is no agency like BBM-Nielsen that captures the viewership of all of Canada’s digital media properties. ComScore measures traffic on broadcaster video sites, but its categorizations of content are not conducive to analyzing traffic by genre. Nielsen has yet to move its online video measurement to Canada.
The CMF and the Canadian Radio-television and Telecommunications Commission (CRTC) are working on reporting mechanisms for Canadian digital media assets associated with broadcasters, but the reports will not include the foreign-owned services. These indices will serve as a foundation to start measuring the performance of documentaries on digital services. Without comprehensive, uniform, and accessible data about Canada’s digital services, any report on digital distribution will be unable to present conclusive remarks about the performance of the market.
11 T H E PE R FO R M A N C E O F D O C U M E NTA R I ES O N D I G ITAL S E RV I C ES I N CA NADA
Digital Canada
Canadians: new adopters and digitally connected
This section provides a brief introduction on our digital present: how many Canadians are connected, and how they consume content. A list of the digital business models and strategies is provided followed by a synopsis of the current communications environment, which examines the major players in Canada’s digital video market.
Despite this country’s vast territory, almost all Canadians have access to the infrastructure necessary to consume content on digital platforms. Almost 98% of Canadians are located within a 1.5 Mbps broadband footprint; 97% of Canadians are located in a 1.5 Mbps mobile broadband footprint.2
Canadians are quick adopters of new services and technology: 70% of Canadians subscribe to broadband with speeds of 1.5 Mbps, and 52% with speeds of 5 Mbps3; 20% of Canadians own
a smartphone4, and 6% of all Canadians own a tablet5; 69% of all Canadians are digital cable
subscribers.6
In general, Anglophones spend more time online weekly than Francophones. In 2010,
Anglophones spent 17.1 hours a week online on average, while Francophones spent only 12.7 hours online weekly.7
Over the last 5 years, Anglophones and Francophones have been consuming video on digital platforms more prevalently (figure 1.1). According to a survey of 12,000 Canadians aged 18-plus performed by Mediastats, Canadians report increased past monthly usage of VOD, Internet video, and mobile video. Anglophones consume Internet and mobile video more than Francophones, while Francophones reported more use of video-on-demand.
2 CRTC, 2011 Communications Monitoring Report, July 2011, p.i. 3 Ibid.
4 CBC News online, June 2, 2011, “One in five Canadians owns a smartphone: report.”
<http://www.cbc.ca/news/business/story/2011/06/02/technology-comscore-smartphone.html>.
5 Pulp and Paper Canada Online, “Tablet computers, eReaders have equal market share in Canada, for now,” <http://www.pulpandpapercanada.com/issues/story.aspx?aid=1000434427>.
6 CRTC, 2011 Communications Monitoring Report, July 2011, p.93. 7 Ibid., p.100.
12 D I G ITAL D I ST R I B UTI O N R E P O RT The reported consumption of online video has also increased over the past four years. In 2007,
English viewers spent 2.1 hours per week watching online video and French viewers spent 1.3 hours. In 2010, English viewers watched 0.5 more hours and French viewers watched 0.2 more hours than in 2007.
In addition to watching online video, there is an increasing number of Canadians purchasing and watching television online. Since 2008, the purchase of professional video and online viewership has increased. In 2010, 9% of Anglophones reported purchasing a television episode on a digital download service in the past month, up from 2% in 2008. Meanwhile, 3% of Francophones reported using a digital download service, an increase of 2% since 2008.8
As for watching an entire 30- to 60-minute television program online, in 2010 47% of Anglophones reported watching television programs online in the last month, up from 38% in 2008. In 2010, 53% of Francophones reported performing this activity in the last month, a massive increase from 27% in 2008.9
Francophone online viewership and purchase of television content have almost doubled. Anglophones are adopting pay-to-download services more rapidly than Francophones.
As for mobile video viewership, 27% of all smartphone users watch live TV or video online using their devices.10 Tablet users watch video more frequently and in different forms. According to
a survey performed by Mediastats, 56% of all tablet users reported watching video in the last month, and watched video in other formats to differing degrees (see figure 1.2).
8 CRTC, 2011 Communications Monitoring Report, July 2011, p.102, MTM 2010–2011 (Respondents: All 18+) 9 Ibid.
10 The Canadian Wireless Telecommunications Association, 2011 Cell Phone Consumer Attitudes Study, p. 27. 6% 15% 7% 17% 30% 51% 26% 49% 2% 9% 1% 4% 0% 10% 20% 30% 40% 50% 60% 2006 2007 2008 2009 2010 Past-Month Usage
Figure 1.1 Adoption of digital platforms by language
Source: CRTC, 2011 Communications Monitoring Report, p. 103, MTM 2010-2011 (Respondents: All 18+) VOD English
VOD French Internet video English
13 T H E PE R FO R M A N C E O F D O C U M E NTA R I ES O N D I G ITAL S E RV I C ES I N CA NADA
Clearly, the infrastructure is in place for Canadians to access the services; they are adopting new digital technologies and they increasingly consume content on these services. Canada is hooked up and actively embracing digital content distribution services. These favourable market conditions create opportunities for the documentary sector to distribute its content to all Canadians.
Digital distribution business models/strategies
B USI N ES S M O D ELS
The digital marketplace is in the process of inventing itself. Generating revenue is difficult. Many strategies are being undertaken in this nascent stage of economic growth.
Ad-supported
Similar to traditional broadcast media, services deliver content to consumers for free in exchange for the viewership of advertisements. This business model is employed by broadcasters, content aggregators such as Yahoo and MSN, and online video portals such as Hulu.
Digital DownloaD
More akin to the DVD distribution market, consumers pay a fee to download the content as a rental or a purchase. Amazon, the iTunes Store, Zune Marketplace, Cineplex, transactional cable VOD services, console-based VOD services, and other online content portals use this model.
SubScription
Other services require users to pay a monthly fee to access their content libraries. Netflix, Hulu Plus, and cable-based subscription VOD services employ this business model.
56% 48% 38% 16% 0% 10% 20% 30% 40% 50% 60%
Total video Amateur video TV Netflix
Last-Month Usage
Figure 1.2 Tablet video viewership: % of users by kinds of video
14 D I G ITAL D I ST R I B UTI O N R E P O RT
Freemium
The “freemium” model provides some assets of the service for free and charges consumers for other more exclusive content. Many mobile video applications employ this business model, as well as online video portals, such as SnagFilms. NFB.ca allows users to access 1,400 videos for free, but many other assets are set up on a download-to-own basis. The NFB also offers purchasable DVDs.
STR ATEG I ES
At first, digital distribution services approached content through a walled-garden model; they made content available only on their service and tried to direct as much traffic as possible to their portals. For example, TVO’s content is not distributed outside of its services or the websites of the production.
More recently, services have opted to syndicate their content to other exclusive online
properties that fit their target audiences. It is easier to bring content to where users congregate than attempt to direct all traffic to their portals through licencing agreements. For instance:
• NFB distributes its content on YouTube, SnagFilms, and RODO in addition to its website;
• SnagFilms lets users embed the video contents on their websites, which includes links to purchase the content; and
• CBC has its content on Rogers On Demand Online, Hulu, and Netflix.
The syndicated content strategy is gaining popularity amongst broadcasters and distributors, but it has not entirely replaced the walled-garden strategy.
Changing landscape
Over the past 10 years, the consolidation of the Canadian media landscape has concentrated the majority of its broadcasting, cable, satellite, magazine, Internet, wireless and wireline phone assets into the hands of four companies: Rogers, Bell, Shaw, and Quebecor. All of these companies distribute (or plan to distribute) their content across mobile, online, and television platforms. These companies argue that their vertically integrated corporate structures are required to compete with the unregulated foreign digital distribution entrants such as Apple and Netflix.
Canada’s robust digital infrastructure, and its consumer reputation as early adopters and as one of the largest consumers of media in the world have enticed foreign companies to bring their services to Canada.
First launched in 2004, Apple’s iTunes Store Canada expanded its services in 2008 to include the distribution of film and television content. It is the most popular digital download service in the U.S. and Canada. Released in September 2010, Apple TV is a set-top box that enables consumers to access their iTunes library and Netflix and rent HD movies.
15 T H E PE R FO R M A N C E O F D O C U M E NTA R I ES O N D I G ITAL S E RV I C ES I N CA NADA
Netflix launched in Canada in October 2010. After 10 months, it had almost 1 million subscribers.11 According to a recent report on Netflix and North American bandwidth
consumption, Netflix’s share of Canadian bandwidth is 13.5% of all evening Internet downstream traffic.12
Although Apple and Netflix are the major brands, there are many more foreign services that are vying for Canadian attention. Over the last 3 years, Microsoft’s Zune Marketplace, the PlayStation Store, and Wii channels have sold digital downloads of films to Canadians. Sony’s Qriocity and Best Buy’s CinemaNow will launch in 2011. Unlike digital services affiliated with Canadian companies, none of these foreign players are regulated to contribute to the Canadian-content production environment.
The increased number of digital distribution services creates great opportunities for documentary media to expand the scope of its market. Assessing the performance of documentaries on digital platforms in Canada is of key importance.
Two major questions must be addressed. First, what can documentary producers expect from the digital marketplace? Second, how can Canadian documentary producers exploit the market given Canadian audiences’ preference for foreign content, and the growing dominance of foreign digital distribution services in Canada?
11 Netflix: 2nd Quarter Letter to Investors, <http://files.shareholder.com/downloads/NFLX/1346033219x0x485532/0 67c1c07-f779-40f8-a1fb-20096eeb9bbc/July%20Investor%20Letter%201130am.pdf>.
17 T H E PE R FO R M A N C E O F D O C U M E NTA R I ES O N D I G ITAL S E RV I C ES I N CA NADA
Broadcaster Digital Services
Canadian broadcasters use different channels to distribute documentaries digitally: subscription online video-on-demand services, online video portals, and mobile applications. This section provides an overview of the performance of documentaries on online video portals by
comparing the number of documentaries in the content libraries, viewership statistics, and top five viewed documentaries. The mobile applications launched by broadcasters are also outlined.
Online portals
D OC U M ENTARy LI B R ARy
Despite the absence of Canadian content regulations for online video portals, the majority of documentary content on these video portals is from Canada because broadcasters acquire the streaming rights when they commission programs from documentary producers.
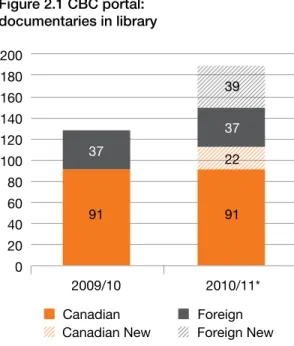
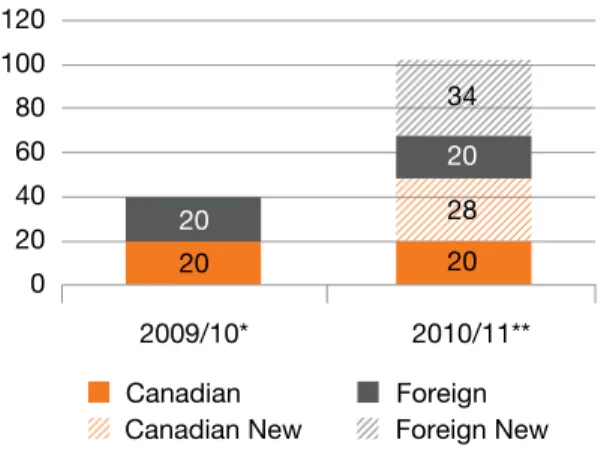
The number of non-Canadian documentary titles on broadcaster portals is increasing (see figures 2.1 to 2.4). In most cases, more non-Canadian documentary titles are added than Canadian. The number of non-Canadian documentary titles now outnumbers Canadian ones on some services (TVO and Knowledge Network).
2
20 20 28 20 20 34 0 20 40 60 80 100 120 2009/10* 2010/11**Figure 2.3 Knowledge Network portal: documentaries in library
*January 2010 to August 2010 **September 2010 to February 28, 2011
Source: Knowledge Network data request, March 2011 Canadian
Canadian New ForeignForeign New CanadianCanadian New Foreign NewForeign
Canadian
Canadian New ForeignForeign New CanadianCanadian New Foreign NewForeign
91 91 22 37 37 39 0 20 40 60 80 100 120 140 160 180 200 2009/10 2010/11* Figure 2.1 CBC portal: documentaries in library
*Partial: September 2010–February 28, 2011 Source: CBC data request, March 2011
196 196 38 119 119 33 0 50 100 150 200 250 300 350 400 450 2009/10 2010/11*
Figure 2.2 History Television portal: documentaries in library
*Partial: September- 2010–February 28, 2011 Source: History Television data request, March 2011
23 23 20 25 25 55 0 20 40 60 80 100 120 140 2009/10* 2010/11**
Figure 2.4 TVO portal: documentaries in library
*Partial: August 2009 to March 2010 **April 2010 to February 2011
18 D I G ITAL D I ST R I B UTI O N R E P O RT The libraries of these portals differ based on the programming of their affiliated broadcaster. The
libraries of CBC, TVO, and Knowledge Network contain mainly one-offs and mini-series. History Television’s library is mainly documentary series, but it does contain some features.
VI E wERS H I P
The Canadian broadcaster with the most popular online video portal is CTV. In 2010–11, its library received on average 11 million views a month.13 In the 2009–10 broadcasting year, CTV
announced 138.7 million views.14 Many of those views were attributable to 2010 Olympic Games
viewership. Previous research indicates that its documentary assets received about 900,000 views between September 2009 and June 2010,15 which averages out to 90,000 views per
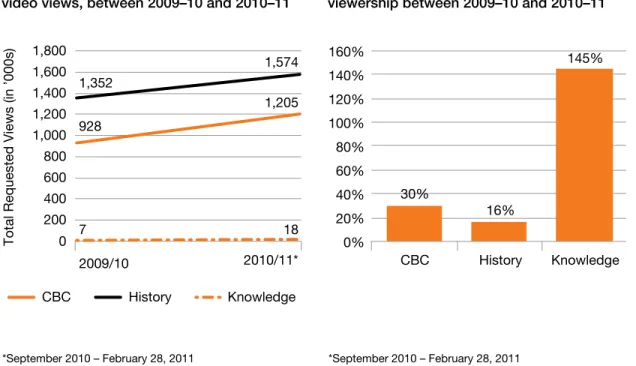
month. Thus, documentary viewership would make up 1% of CTV’s total viewership. Data from the participating broadcasters indicates that documentary viewership is growing. Even though the broadcast year has yet to finish, the 2010–11 viewership of documentaries has surpassed those of 2009–10 (see figure 2.5). Annual documentary viewership on broadcaster online portals ranges from 18,000 to almost 1.6 million total requested views (see figure 2.5). Despite its relatively low total requested views number, documentary viewership is growing fastest on Knowledge Network (see figure 2.6).
13 Genius Marketing, January 3, 2011, “CTV Reports Record Online Video Usage,” <http://www.geniusmarketinginc.com/?p=581>.
14 CTV News, June 10, 2010, “Canadian Digital Report Card: CTV.ca ends 2009/10 Broadcasting Season as Canada’s #1 TV Portal”, <http://www.ctv.ca/servlet/ArticleNews/corp/CTVShows/20100601/ctv_20100601/ undefined>.
15 DOC, Getting Real 4: An Economic Profile of the Canadian Documentary Production Industry, March 2011, p.98. This represents the most recent data available on this subject
20 20 28 20 20 34 0 20 40 60 80 100 120 2009/10* 2010/11**
Figure 2.3 Knowledge Network portal: documentaries in library
*January 2010 to August 2010 **September 2010 to February 28, 2011
Source: Knowledge Network data request, March 2011 Canadian
Canadian New ForeignForeign New Canadian NewCanadian Foreign NewForeign
Canadian
Canadian New ForeignForeign New CanadianCanadian New Foreign NewForeign
91 91 22 37 37 39 0 20 40 60 80 100 120 140 160 180 200 2009/10 2010/11* Figure 2.1 CBC portal: documentaries in library
*Partial: September 2010–February 28, 2011 Source: CBC data request, March 2011
196 196 38 119 119 33 0 50 100 150 200 250 300 350 400 450 2009/10 2010/11*
Figure 2.2 History Television portal: documentaries in library
*Partial: September- 2010–February 28, 2011 Source: History Television data request, March 2011
23 23 20 25 25 55 0 20 40 60 80 100 120 140 2009/10* 2010/11**
Figure 2.4 TVO portal: documentaries in library
*Partial: August 2009 to March 2010 **April 2010 to February 2011
19 T H E PE R FO R M A N C E O F D O C U M E NTA R I ES O N D I G ITAL S E RV I C ES I N CA NADA
The nature of the service of each associated broadcaster affects its viewership. CBC is mandated to be accessible to all Canadians. History Television is a specialty channel only available to cable subscribers. Knowledge Network and TVO are provincial educational broadcasters that are carried nationally by select satellite carriers, but not nationally through cable. The penetration levels of CBC and History are closer to each other, while TVO and Knowledge Network are limited to provincial coverage. Because of licence agreements with producers, all Canadian broadcasters block traffic from outside Canada, which substantially decreases traffic. Knowledge Network even restricts viewers outside of B.C. from viewing some content through geo-blocking.
ViewerShip of canaDian VS. non-canaDian content
Like Canadian television, the most popular content on broadcaster video portals is American. Only two of the top 10 titles of CTV’s web portal in 2010–11 are Canadian: Flashpoint and Degrassi: The Next Generation.16
As for the participating broadcasters, overall, Canadians watched more Canadian documentaries than non-Canadian ones. Yet, the viewership of non-Canadian content is growing faster than Canadian (see table 2.1). Alongside the increase of viewership of non-Canadian titles is a growing library of non-non-Canadian documentary titles.
16 Genius Marketing, January 3, 2011, “CTV Reports Record Online Video Usage,” <http://www.geniusmarketinginc.com/?p=581>. 30% 16% 145% 0% 20% 40% 60% 80% 100% 120% 140% 160% CBC History Knowledge *September 2010 – February 28, 2011
Source: CBC, History, Knowledge data request, March 2011. TVO’s data is not included in this table.
928 1,205 1,352 1,574 7 18 2009/10 200 400 600 800 1,000 1,200 1,400 1,600 1,800 0 2010/11*
Total Requested Views (in ’000s)
CBC History Knowledge
*September 2010 – February 28, 2011
Source: CBC, History, Knowledge data request, March 2011. TVO’s data is not included in this table.
Figure 2.5 Total requested documentary
20 D I G ITAL D I ST R I B UTI O N R E P O RT Table 2.1: Viewership of documentary titles on broadcaster video portals:
Canadian Vs. Non-Canadian
hiStory KnowleDge networK tVo
2009-10 2010-11* growth 2009-10** 2010-11* growth 2009-10*** 2010-11**** growth
Canadian titles, total requested views (in ’000s)
1047.2 981.8 -6% 4.6 9.6 107% 15.7 24.0 53%
Canadian titles 196 234 19% 20 48 140% 23 43 87%
Non-Canadian titles, total requested views (in ’000s)
305 592 94% 2.8 8.6 209% 4.2 21.9 419%
Non-Canadian titles 119 152 28% 20 54 170% 25 80 220%
Source: History, Knowledge, TVO data request, March 2011. CBC could not break down data by origin and thus, its data is absent from this table.
* Partial: September 2010 to February 2011 ** January 2010 to August 2010
*** Partial: August 2009 to March 2010 **** April 2010 to February 2011 TO P 5 D OC U M ENTAR I ES
In general, documentary series outperform documentary features and miniseries. History Television’s library primarily comprises documentary series, and its total viewership is higher than CBC, Knowledge Network, and TVO combined.
series
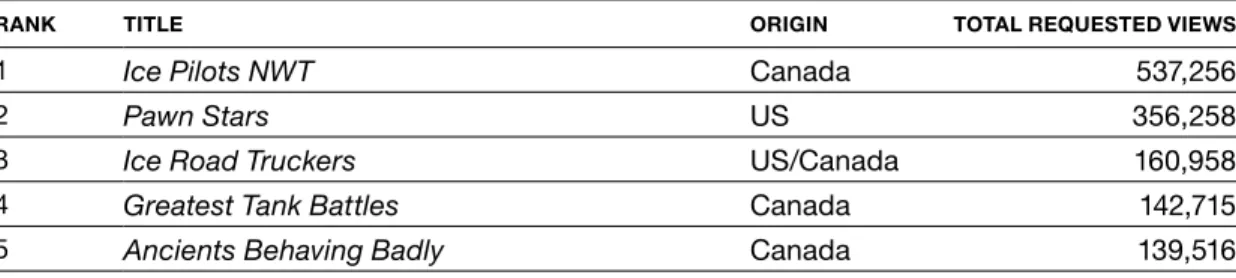
The majority of History Television’s top-performing documentary series programs is Canadian (see table 2.2). Ice Pilots NWT is the highest-viewed documentary asset on History Television, which is not surprising given that the show is also History’s top-performing television series. Thirty-three percent of all viewership in History’s video portal watched Ice Pilots NWT. Table 2.2 History Television series and feature-docs, Canadian and foreign
(Jan. 2010 to Jan. 2011), total series views
ranK title origin total requeSteD ViewS
1 Ice Pilots NWT Canada 537,256
2 Pawn Stars US 356,258
3 Ice Road Truckers US/Canada 160,958
4 Greatest Tank Battles Canada 142,715
5 Ancients Behaving Badly Canada 139,516
Source: Data request, History Television, August 2011
As for the top five episodes on History Television, they are Ice Pilots NWT episodes. Its highest-viewed episode had 59,457 views, and its lowest had 42,451.
21 T H E PE R FO R M A N C E O F D O C U M E NTA R I ES O N D I G ITAL S E RV I C ES I N CA NADA
one-offS/featureS anD Mini-SerieS
Every broadcaster has mini-series and one-offs/features in their libraries, which allows
comparisons across the four services. The top five ranking titles in each format provide a more nuanced view of the performance of documentaries on online portals. If success is evaluated by the number of total requested views, documentaries on CBC’s portal perform the best. The 1st and 5th-ranking titles surpass those of its competitors and the average viewership of its top five is also the highest (see figure 2.7).
Successful documentaries have a range of between 21,000 and 29,000 views. On average across the platforms, it appears that a documentary is successful if it is viewed 8,000 times in a year—hardly a strong figure.
As for the subject matter of the most popular documentaries in this category, it depends on the nature of service of the portal. The top five of History features are Remembrance Day specials as that is the most popular viewing period for the channel. As for more generalist services, such as the CBC, popular social issue documentaries dominate their top five. TVO’s top five was populated primarily by mini-series and social issue docs. Many of these mini-series have strong companion sites that link to the videos on the broadcaster site. Knowledge Network’s top five comprised local music and social issue documentaries.
29,209 17,751 21,249 8,835 6,948 7,938 2,093 1,108 1,469 1,151 576 829 0 5,000 10,000 15,000 20,000 25,000 30,000 35,000 #1 Documentary #5 Documentary Top 5 Average
CBC History TVO Knowledge
Source: CBC: 2009-10 broadcast year; History: Jan. 2010 to Jan. 2011; Knowledge: Jan. 2010 to Jan. 2011; TVO: April 2010 to Feb. 2011
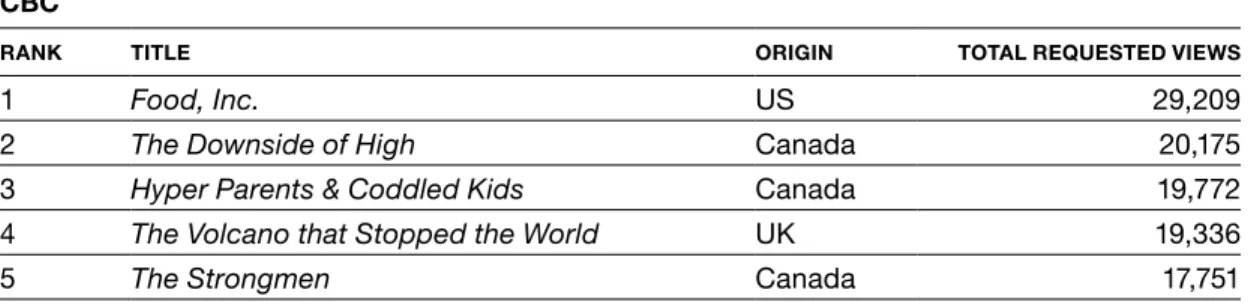
22 D I G ITAL D I ST R I B UTI O N R E P O RT Table 2.3 Top 5 feature documentaries on broadcaster portals
CBC
ranK title origin total requeSteD ViewS
1 Food, Inc. US 29,209
2 The Downside of High Canada 20,175
3 Hyper Parents & Coddled Kids Canada 19,772
4 The Volcano that Stopped the World UK 19,336
5 The Strongmen Canada 17,751
Source: CBC: 2009–10 broadcast-year
hiStory teleViSion
ranK title origin total requeSteD ViewS
1 1917: The Missing* Canada 8,835
2 Digging Up the Trenches, parts 1 and 2* Canada 8,416
3 Passchendaele: The Underground War,
parts 1 and 2* Canada 8,382
4 Battle of the Somme: The True Story* Canada 7,109
5 The Lost Book of Nostrodamus US 6,948
* Part of History Television’s “Days of Remembrance” programming Source: History Television, Jan. 2010 to Jan. 2011
KnowleDge networK
ranK title origin total requeSteD ViewS
1 Bloodied But Unbowed Canada 1,151
2 Victorian Farm UK 972
3 Journey to the Edge of the World UK 808
4 Our First Voices Canada 639
5 Autism: The Road Back Canada 576
Source: Knowledge Network, Jan. 2010 to Jan. 2011
tVo
ranK title origin total requeSteD ViewS
1 The Magic of Reading (Episode 1 of 4) Canada 2,093
2 Inside Disaster Haiti (Part 1: Emergency) Canada 1,587
3 Paris 1919 Canada 1,329
4 Water on the Table Canada 1,227
5 Inside Disaster Haiti (Part 2: Response) Canada 1,108
23 T H E PE R FO R M A N C E O F D O C U M E NTA R I ES O N D I G ITAL S E RV I C ES I N CA NADA
The majority of content in the rankings is Canadian. There are some non-Canadian
documentaries in the top five titles on Knowledge Network, History, and CBC. The most popular documentary on the CBC’s web portal is an American documentary feature: Food, Inc.
Mobile
Almost every vertically integrated communications company has a mobile content strategy. Most wireless providers offer a service allowing mobile customers to purchase hours of live or on demand television. Only Videotron’s service offers channels that broadcast documentary content.
Broadcasters have also launched mobile applications for Canadians to view content on their smartphones and tablet computers. CBC, CityTV, Global, Knowledge Network, and Tou.tv have launched iPad applications.
Canadians are very receptive to these applications. CityTV, CBC, and Global’s applications have reached the top position of the top 200 rankings of free iPad applications. The Global TV iPad application has been particularly successful. Since its launch, it has been downloaded over 350,000 times and over one million shows have been viewed. Its users access the service almost twice daily. The users spend 47 minutes per session on average.17
Despite the rapid adoption of TV viewership on the iPad, there are very few applications that offer documentary content. Only Tou.tv’s and Knowledge Network’s applications have documentaries in their libraries.
Conclusion
The majority of the library is Canadian content, and thus, Canadian content is viewed more. As long as Canadian titles outnumber non-Canadian titles, their viewership will be higher. Given the growing library of non-Canadian titles on broadcaster portals, the dominance of Canadian documentary viewership may decline. The top five rankings indicate that popular non-Canadian documentaries are viewed as frequently as Canadian ones, and sometimes more.
The most successful documentary asset on a broadcaster portal has 540,000 requested views (when all of its episodes are totalled). Its highest rated episode has almost 60,000 total requested views. As for features, on average, they receive 8,000 views. The most successful receives about 30,000 total requested views.
17 Mediacaster, May 2, 2011, “Shaw Sees Online Video Viewership Grow with New Apps, Exclusive Content,” <http://www.mediacastermagazine.com/news/shaw-sees-online-video-viewership-grow-with-new-apps-exclusive-content/1000409330/>.
25 T H E PE R FO R M A N C E O F D O C U M E NTA R I ES O N D I G ITAL S E RV I C ES I N CA NADA
National Film Board Platforms
The NFB is the largest distributor of documentaries on digital platforms in Canada. An assessment of the performance of documentaries on their properties provides insights regarding how documentaries can perform when they are placed centre stage on a platform. This section focuses on their online web portal and their applications by comparing the number of titles in the library, viewership by platform, and top five ranking statistics. It also gives a quick overview of its digital download service.
Library
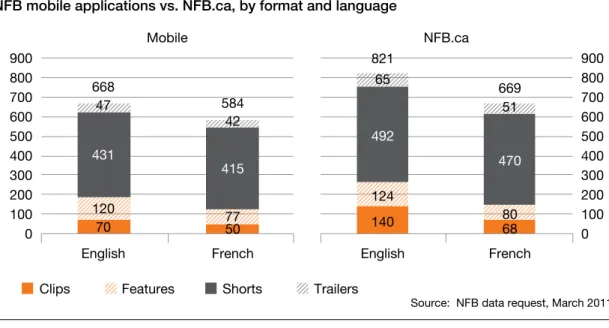
The NFB’s library contains auteur animation, dramas, and documentaries. Its content is created in-house or as co-productions with Canadian producers. It distributes its content across its website NFB.ca, partner sites, and on mobile platforms. NFB.ca’s documentary library has 1,490 titles on its web portal and 1,252 on its mobile devices. The content is available in French and English, and in 4 formats: clips, features, shorts, and trailers.
In 2007–08, the NFB began to populate its libraries. The majority of its content was added in 2008–09; the NFB added 580 documentaries to its portal that year. The NFB continues to increase the number of titles in its library in both languages. Since 2008–09, 436 English films have been added to the library as well as 356 French titles.
The formats can be somewhat arbitrary. Shorts can range between 6 and 55 minutes, while features are generally 44 minutes and over. Clips are either smaller portions of films that are not distributed for free on the platform or extra content about the films.
Currently, the majority of content on all platforms is English, and the most prevalent format in both languages is shorts (see figure 3.1).
3
Clips Features Shorts Trailers
Source: NFB data request, March 2011
Figure 3.1 Total Documentary Library:
NFB mobile applications vs. NFB.ca, by format and language
70 50 140 68 120 77 124 80 431 415 492 470 47 42 65 51 668 584 821 669 0 100 200 300 400 500 600 700 800 900 0 100 200 300 400 500 600 700 800 900
English French English French
26 D I G ITAL D I ST R I B UTI O N R E P O RT
Viewership
The NFB uses multiple strategies to distribute its content and increase viewership. First, its services are not geo-blocked, but available to everyone around the world. The NFB also syndicates its content across different services: Dailymotion, Hulu, RODO, SnagFilms, and YouTube. Its content is also delivered over multiple platforms: iPhone (2009), iPad (2010), Android (2011), and PlayBook (2011).
Viewership over its syndicated services, web-portal, and mobile applications is increasing year after year. At the time of the writing of this report, 2010–11 total viewership was already at 9.31 million (Q1 to Q3); it is edging towards its viewership of 2009–10: 10.73 million views. The majority of its views came from its international partner sites (4.49 million). Canadian views account for 30% of total viewership, the rest being international. Mobile properties have the least amount of viewers (0.8 million). 18
D OC U M ENTARy VI E wERS H I P
Over the last two years, the total requested views on NFB.ca and mobile applications for documentaries totaled 5.5 million views. The majority of that viewership was on NFB.ca.
nfb.ca
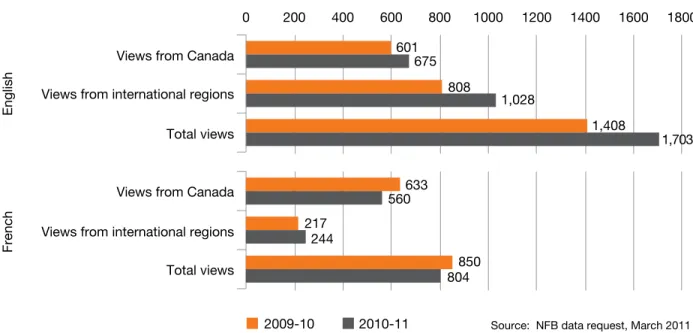
Since the launch of NFB.ca in 2009, documentaries have been viewed 4.8 million times. Between 2009–10 and 2010–11, viewership has grown by 250,000 viewers. Much of its growth can be attributed to growing viewership from international audiences.
At first, the combined Canadian viewership of English and French titles surpassed international, but in 2010–11, the increase of international English viewership allowed it to surpass Canadian viewership (see figure 3.2). In 2010–11, falling French figures lowered the total Canadian viewership to below that of international spectators.
27 T H E PE R FO R M A N C E O F D O C U M E NTA R I ES O N D I G ITAL S E RV I C ES I N CA NADA
Both Canadian and international viewers preferred to watch shorts. In 2010–11, the viewership of shorts, trailers, and clips fell in Canada, but shorts remained the dominant format. Features also increased in viewership. Like Canadians, international viewers watched fewer trailers and clips, but shorts and features rose. The international viewership of shorts grew more than any other format.
• In 2010–11, Canadian viewership of shorts dropped from 831,000 to 817,000, while international viewership rose from 559,000 to 796,000 total requested views. • In 2010–11, Canadian viewership of features increased from 230,000 to 290,000
total requested views, whereas international viewership increased from 281,000 to 360,000.
• In 2010–11, Canadian viewership of clips fell from 87,000 to 61,000 total requested views, while international viewership of clips dropped from 108,000 to 26,000. • In 2010–11, Canadian viewership of trailers dropped from 88,000 to 67,000 total
requested views, whereas international viewership fell from 77,000 to 70,000.19
moBile
The viewership of documentaries over mobile applications was smaller than viewership on NFB.ca. Over the last 2 years, the viewership of documentaries on mobile platforms totalled 720,000. The majority of those views were on the iPhone application, but the introduction of the iPad application may have caused platform migration. Android viewership has been excluded from these statistics because the device was only introduced in March 2011.
19 NFB data request; total requested documentary views for NFB.ca between 2009–10 and 2010–11.
2009-10 2010-11 Source: NFB data request, March 2011
Figure 3.2 NFB.ca: Total requested views by language and region
601 808 1,408 633 217 850 675 1,028 1,703 560 244 804 0 200 400 600 800 1000 1200 1400 1600 1800 Views from Canada
Views from international regions Total views Views from Canada Views from international regions Total views
English
French
28 D I G ITAL D I ST R I B UTI O N R E P O RT Unlike NFB.ca, Canadian documentary viewers on mobile platforms outnumber international
documentary viewers. Similar to NFB.ca, the majority of content viewed is English.
In 2010–11, Canadian documentary viewership has shrunk on the iPhone application, while international documentary viewership has grown slightly in both languages.
• Canadian English iPhone documentary viewership dropped from 154,474 to 136,124 total requested views, while international English iPhone documentary viewership increased from 57,982 to 58,539 views.
• Canadian French iPhone documentary viewership dropped from 72,639 to 65,096 total requested views, whereas international French iPhone documentary viewership rose from 16,040 to 18,389 views.20
In June 2010, the iPad was introduced to Canadian markets. The NFB launched its iPad application on the heels of the device’s release. This had a clear impact on the popularity of documentary viewership on the iPhone application. In 2010–11, the iPhone application’s documentary viewership dropped in Canada.
• Canadian English iPad documentary viewership totalled 60,472 requested views, while international English iPad documentary viewership was 46,134.
• Canadian French iPad documentary viewership totalled 24,564 requested views, whereas international French iPad documentary viewership totaled 8,684.21
Similar to the NFB.ca viewership, most people watch shorts and features on mobile devices. In 2010–11, Canadian viewers watched less of every format of documentaries on the iPhone application, while international viewers watched more of almost every documentary format on the iPhone application, except clips and trailers.
• Canadian iPhone documentary viewership of shorts dropped from 147,779 to 131,258 total requested views, while international iPhone documentary viewership increased from 46,622 to 49,157.
• Canadian iPhone documentary viewership of features fell from 68,292 to 65,422 total requested views, whereas international iPhone documentary viewership grew from 24,110 to 26,448.
• Canadian iPhone documentary viewership of clips diminished from 4,022 to 2,058 total requested views, while international iPhone documentary viewership decreased from 1,191 to 467.
• Canadian iPhone documentary viewership of trailers decreased from 7,418 to 2,532 total requested views, whereas international iPhone documentary viewership fell from 2,113 to 860.22
In the first year, the NFB iPad application’s (June 2010 to April 2011) viewership already totalled almost 140,000 views. The iPad viewers watch content according to the same preferences as iPhone applications viewers: they prefer shorts and features.
20 NFB data request, total requested views for documentaries on iPhone application between 2009–10 and 2010–11. 21 NFB data request, total requested views for documentaries on iPad application between June 2010 and March 2011. 22 NFB data request, total requested views for documentaries on iPhone application between 2009–10 and 2010–11.
29 T H E PE R FO R M A N C E O F D O C U M E NTA R I ES O N D I G ITAL S E RV I C ES I N CA NADA
• Canadian iPad documentary viewership of shorts was 58,998 total requested views, while international iPad documentary viewership totalled 35,344.
• Canadian iPad documentary viewership of features was 25,214 total requested views, whereas international iPad documentary viewership totalled 18,774. • Canadian iPad documentary viewership of clips was 271 requested views, while
international iPad documentary viewership totalled 147.
• Canadian iPad documentary viewership of trailers was 575 requested views, whereas international iPad documentary viewership totalled 563.23
TO P FIVE D OC U M ENTAR I ES
nfb.ca
Aggregate viewership demonstrates English titles are viewed more than French, but individually, it is a French title that has the highest viewership (see figure 3.3). Given the disparity between the highest- and lowest-ranking French titles of the top five, it is evident that the highest-ranking title is an outlier.
23 NFB data request, total requested views for documentaries on iPad application between June 2010 and March 2011. Figure 3.3 NFB.ca top 5 documentaries by region and language
28,872 99,641 54,766 23,530 81,269 123,171 12,644 6,954 34,657 4,803 45,385 9,457 18,577 28,809 46,600 10,272 64,702 37,226 0 20,000 40,000 60,000 80,000 100,000 120,000 140,000 English views from Canada French views from Canada English views from international regions French views from international regions Total English views Total French views
#1 #5 Average top 5 rank Top 5 rankings are from 2010-11 financial year Source: NFB data request, July 2011
30 D I G ITAL D I ST R I B UTI O N R E P O RT As for the top five English titles, the range between the highest and fifth-highest documentary
titles is narrower, which implies that English titles have higher ratings overall. Similar to aggregate English viewership on NFB.ca, the top five English titles viewed by international audiences have higher ratings than the top ones viewed by Canadians. Interestingly, the highest-rated English documentary in Canada on NFB.ca has a similar rating to the highest-highest-rated English documentary feature on broadcaster portals: 28,800, which is far below the highest-ranking series episode: 60,000.
The titles appearing in the top five rankings indicate that English viewers watched many of the same titles: four of the top five rankings were the same titles (see table 3.1).
Table 3.1 NFB.ca top five English titles, April 2010–March 2011
ranK top 5 engliSh:
canaDian ViewerS international ViewerStop 5 engliSh: top 5 engliSh: total ViewerS 1 Carts of Darkness Sexy Inc.: Our Children
Under Influence Carts of Darkness 2 Sexy Inc.: Our Children
Under Influence Carts of Darkness Sexy Inc.: Our Children Under Influence 3 RIP!: A Remix Manifesto
(Chapter 1) How to Build an Igloo How to Build an Igloo 4 Railroaders RIP!: A Remix Manifesto RIP!: A Remix Manifesto
(Chapter 1) 5 How to Build an Igloo Hitman Hart: Wrestling
with the Shadows Hitman Hart: Wrestling with the Shadows Source: NFB data request, July 2011
On the other hand, international and Canadian French viewers were less similar: only two of the top five titles were the same (see table 3.2).
Table 3.2 NFB.ca top 5 French titles, April 2010–March 2011
ranK top 5 french:
canaDian ViewerShip top 5 french: international ViewerShip top 5 french: total ViewerShip 1 Un dimanche à 105 ans Un dimanche à 105 ans Un dimanche à 105 ans 2 Sexy Inc. : Nos enfants
sous influence Sexy Inc. : Nos enfants sous influence Sexy Inc. : Nos enfants sous influence 3 Sacrée montagne — L’amitié 60 cycles Sacrée montagne — L’amitié 4 Un homme de parole RIP! : Remix manifesto La bête lumineuse 5 La bête lumineuse L’incroyable histoire des
machines à pluie Un homme de parole Source: NFB data request, July 2011
Some titles perform well in both linguistic markets, such as Sexy Inc.: Our Children Under Influence.
31 T H E PE R FO R M A N C E O F D O C U M E NTA R I ES O N D I G ITAL S E RV I C ES I N CA NADA
moBile
The top five documentary titles on mobile platforms follow the same trends as their aggregate viewership (see figure 3.4). The highest rated documentaries are English titles and Canadian viewers watch the most documentaries on mobile platforms. The top five titles viewed by international English viewers have views comparable to its aggregate viewership.
The most successful documentaries in Canada receive between 5,800 and 11,000 views in the English market, and between 1,900 and 6,000 views in the French market.
#1 #5 Average top 5 rank Top 5 rankings are from 2010–11 financial year Source: NFB data request, July 2011 10,995 6,032 6,873 3,006 17,828 9,038 5,876 1,910 3,634 473 8,984 2,410 7,579.5 3,119.2 5,109.8 1,201.8 12,556 4,371.6 0 2,000 4,000 6,000 8,000 10,000 12,000 14,000 16,000 18,000 20,000 English views from Canada French views from Canada English views from international regions French views from international regions Total English views Total French views
32 D I G ITAL D I ST R I B UTI O N R E P O RT As for the titles, they were almost the same as the ones that appeared on NFB.ca’s top five lists.
Three of the five top mobile English titles appeared in the NFB.ca’s top five list (table 3.3). Table 3.3 NFB mobile application’s top 5 English titles, April 2010–March 2011
ranK top 5 engliSh:
canaDian ViewerS international ViewerStop 5 engliSh: total ViewerStop 5 engliSh: 1 Carts of Darkness Carts of Darkness Carts of Darkness 2 Sexy Inc.: Our Children
Under Influence Sexy inc.: Our Children Under Influence Sexy inc.: Our Children Under Influence 3 Waiting for Fidel Waiting for Fidel Waiting for Fidel 4 The Defender Hitman Hart: Wrestling
with Shadows Hitman Hart: Wrestling with Shadows 5 Hitman Hart: Wrestling
with Shadows How to Build an Igloo How to Build an Igloo Source: NFB data request, July 2011
A similar trend is found in the top five French mobile titles: three of the five titles are the same. Table 3.4 NFB mobile application’s top 5 French titles, April 2010–March 2011
ranK canaDian ViewerStop 5 french: international ViewerStop 5 french: total ViewerStop 5 french:
1 Sexy Inc. : Nos enfants
sous influence Sexy Inc. : Nos enfants sous influence Sexy Inc. : Nos enfants sous influence 2 Un dimanche à 105 ans Un dimanche à 105 ans Un dimanche à 105 ans
3 Junior Junior Junior
4 Bacon, le film La couleur de la beauté La couleur de la beauté 5 Un homme de parole Pour la suite du monde Pour la suite du monde Source: NFB data request, July 2011
FormAt
In the Canadian market, the rated documentary title is a French short, and the highest-rated English title is a feature (see figure 3.5). Similar to the top five titles on NFB.ca, the French short’s high rating appears to be an outlier. The other four range between 18,000 views and 6,600 views. French-Canadian viewers prefer shorts, and English Canadian viewers prefer to watch features.
The average length of the top five French shorts was 54 minutes, and 24.8 minutes for English, whereas the average length of the top five French features was 78.2 minutes, and 79.4 for English.
33 T H E PE R FO R M A N C E O F D O C U M E NTA R I ES O N D I G ITAL S E RV I C ES I N CA NADA
NFB D IG ITAL D OwNLOADS
In addition to streaming content, the NFB also has a digital download service. The titles are available in standard and high definition. Prices range from $1.95 for a 10-minute short, Médecins sans résidence, to $14.95 for an entire feature film, Life with Murder. Some of the films are exclusively available as downloads, while others are available for streaming and download. There are 444 titles available for download; 287 are documentaries. The majority of titles are English, and the most frequent format in the library is shorts.
• There are 145 English documentary titles: 88 shorts and 57 features. • There are 142 French documentary titles: 112 shorts and 30 features.
Although there are some exclusive digital download documentaries that only allow users to stream the trailer of a title, most content is available for free streaming.
Top 5 rankings are from 2010–11 financial year Source: NFB data request, July 2011
#1 #5 Average top 5 rank
Figure 3.5 Top 5 documentaries, total requested Canadian views, by format and language
20,157 99,641 28,872 5,766 8,586 6,638 8,083 3,530 14,520 27,843 13,688 4,070 0 20,000 40,000 60,000 80,000 100,000 120,000 English Shorts French Shorts English Features French Features
Conclusion
There are a few aggregate viewership trends on the NFB properties: 1. Viewers prefer to watch shorts;
2. There are more English viewers than French ones;
3. International viewers are quickly outnumbering Canadian ones.
As for individual titles, the highest-rated documentary almost surpasses 125,000 views. The most successful documentaries on the portal have a range between 41,000 and 85,000 total views (including international views). In the Canadian market, the most successful documentary had 28,800 views in the English market. On mobile applications, the highest viewed title was seen 17,828 times (including international views).
35 T H E PE R FO R M A N C E O F D O C U M E NTA R I ES O N D I G ITAL S E RV I C ES I N CA NADA
Rogers On Demand Online
In November 2009, Rogers launched the beta of its TVeverywhere service: Rogers On Demand Online (RODO). This section examines the documentary content available on this portal, its viewership, and its top-performing titles.
Library
Depending on their cable, phone, wireless, or Internet package, consumers can access a range of different content. Cable package subscribers have access to the most titles. Pay-TV subscribers can view exclusive content from such services as HBO, Movie Central, TMN, and Super Channel. In addition, web-exclusive content can be seen on Vuguru. The public can access free content, such as movies from the NFB.
RODO’s library contains 2,500 hours of programming drawn from various genres, including prime time, daytime and specialty TV, movies, sports and music videos. It has more than 60 programming and content partners.24 Many offer documentary content.
RODO has a total of 228 documentary titles available in its library across 15 different “channels” (see figure 4.1). The mix comprises pay-TV channels, specialty cable services, documentary portals, and Rogers’ digital rentals library.25 History Television has the most documentaries,
followed by RODO rentals, SnagFilms, and NFB.
24 “Rogers On Demand Online Pops with over 550 hours of New Programming From Crackle”,
<http://www.rogersondemand.com/about/pr/rogers_on_demand_online_pops_with_over_550_hours_of_new_ programming_from_crackle>.
25 In September 2010, RODO launched its own digital download service where consumers can rent digital downloads.
36 D I G ITAL D I ST R I B UTI O N R E P O RT
Viewership
Between June 2010 and March 2011, RODO’s documentary assets were viewed 27,595 times. December 2010 had the most views, and October 2010 was the lowest (see figure 4.2). On average, documentaries receive 2,700 views a month on RODO.
PERFO R MAN C E OF D OC U M ENTAR I ES
The highest ranking titles are all Canadian documentaries (see table 4.1). Five of the titles are not exclusive to RODO, but are streamed elsewhere on Internet video portals: Ice Pilots,
Hannah’s Story, Royal Journey, Being Caribou, and Execution. The majority of the top titles were films.
Source: Rogers Communications Inc. data request, March 2011 12 9 1 111 1 18 2 5 4 21 5 4 7 7 21 0 20 40 60 80 100 120 Bio EQ HD HBO History TV MPix NFB Oasis OLN RadX SnagFilms Super Channel TMN Treasure HD UR Music RODO rentals
37 T H E PE R FO R M A N C E O F D O C U M E NTA R I ES O N D I G ITAL S E RV I C ES I N CA NADA
Table 4.1 Top-performing documentary assets on RODO
ranK aSSet title channel type
1 Earth from Above EqHD film
2 Royal Journey NFB film
3 Hubble’s Canvas Oasis HD TV show
4 Being Caribou NFB film
5 Beyond Survival OLN TV show
6 Hannah’s Story NFB film
7 Execution SnagFilms film
8 Ice Pilots NWT History Television TV show
Source: Rogers Communications Inc. data request, March 2011 Source: Rogers Communications Inc. data request, March 2011
Figure 4.2 RODO: total requested documentary views by month
1,535 2,904 1,167 4,712 2,555 0 500 1,000 1,500 2,000 2,500 3,000 3,500 4,000 4,500 5,000
Jun-10 Jul-10 Aug-10 Sept-10 Oct-10 Nov-10 Dec-10 Jan-11 Feb-11 Mar-11
On RODO, NFB is the channel with the most documentary views, followed by Oasis HD and EqHD (see table 4.2).
Table 4.2 Top 5 channels services with most total requested views of documentaries in their libraries on RODO
ranK channel 1 NFB 2 Oasis HD 3 Bio 4 Super Channel 5 EqHD
Source: Rogers Communications Inc. data request, March 2011
Conclusion
Similar to broadcaster online portals, RODO’s documentary assets compete with a plethora of different offerings from online movie rentals, specialty and pay-TV services, and web-exclusive content. In the midst of these choices, viewers seeking documentaries appear to gravitate toward channels they recognize such as the NFB, and toward films.
Over the period of nine months, RODO’s documentary viewership totalled 27,595 requested views. Its most successful titles are from the NFB library and High Fidelity’s cable channels (Oasis and EqHD).
39 T H E PE R FO R M A N C E O F D O C U M E NTA R I ES O N D I G ITAL S E RV I C ES I N CA NADA
iTunes
In the U.S., the iTunes Store remains the dominant service for digital movie downloads with 64.5% of the market share.26 In 2008, the iTunes Store Canada launched its digital download
service for film and TV content. As the dominant service for digital downloads and rentals in Canada, the performance of documentaries on iTunes provides a good indication of how they perform in that part of the market. This section examines performance of documentaries through the library of television and feature film documentaries available on iTunes and their ranks in different top 200 rankings.
Library
iTunes sells both feature films and television series. Feature films are sold in either standard- or high-definition, whereas television series are sold in a complete set or by individual episode. The overwhelming majority of documentaries on iTunes are non-Canadian.
• Of the 725 documentary films available to download, only 33 are Canadian, or 4% of all documentary feature films.
• Of the 400 documentary television series available to download, only 13 are Canadian, or 3% of all documentary series.
There are very few Canadian documentaries on iTunes, likely because iTunes has exclusive agreements with certain distributors and broadcasters. In addition, there are more non-Canadian broadcasters and non-non-Canadian distributors that distribute through iTunes than Canadian ones.
There are fewer television documentary series than feature films, likely because broadcasters own the digital rights to most productions; it is their choice to distribute them on iTunes. Many documentaries begin as television one-offs and producers can choose to reversion them as longer feature films. Consequently, these one-offs versioned as features would appear in the feature film section, e.g., Reel Injun.
R AN kI NG S
Because iTunes does not release any data concerning the number of downloads or sales of content, the performance of documentaries has been assessed by analyzing the top 200 rankings that are posted on iTunes. The top 200 rankings list the best-selling assets on iTunes segmented by genre, format, and other categories. It is updated constantly. This report analyzes the top 200 feature film purchases and rentals, and the top 200 television series and episode rankings.
26 IHS iSuppli, February 7, 2011, “Apple iTunes Remains Dominant in U.S. Online Movies in 2010, Despite Competitors’ Inroads,” <http://www.isuppli.com/Media-Research/News/Pages/Apple-iTunes-Remains-Dominant-in-US-Online-Movies-in-2010-Despite-Competitors-Inroads.aspx>.
40 D I G ITAL D I ST R I B UTI O N R E P O RT FE ATU R E FILM
iTunes has a page devoted to documentary film. On this page, it showcases documentaries according to their price (docs under $10), popularity (top HD docs), release (new and noteworthy), filmmaker (Ron Mann, Errol Morris) and subject matter (sports, counterculture). Of the 33 Canadian feature documentaries, 16 appeared in the top 200 feature film
documentaries purchase rankings very frequently. These titles appeared 77% of the time during the 26-week monitoring period (see table 5.1). The most popular subject matters are popular culture, sport, politics, music and the environment. Although most titles were released in the past 10 years, there were some older titles from the ’90s that appeared in the listings as well. The most popular titles rarely dropped below the rank of 100, and almost always appeared in the top 200 rankings. Some titles with lower average rankings did climb very high in the ratings, higher than titles with a higher average rank.
Table 5.1 iTunes Store Canada, top ranking Canadian feature documentary films, purchase title in top 200aVg ranK higheSt ranK % of tiMe in top 200 releAseyear of
The Corporation 17 3 96% 2004
Rush: Beyond the Lighted Stage 20 4 96% 2010
Sharkwater 32 11 96% 2007
Petropolis: Aerial Perspectives
on the Alberta Tar Sands 35 21 96% 2009
Manufacturing Consent: Noam
Chomsky and the Media 45 25 100% 1992
Under the Sea 3D 49 29 96% 2009
Facing Ali 50 17 100% 2009
Souvenir of Canada 76 3 88% 2005
Reel Injun 84 8 100% 2009
Shake Hands With the Devil 96 1 100% 2007
Don’t You Forget About Me 97 75 88% 2009
Metal double pack 102 83 100% 2008
Hitman Hart: Wrestling With
Shadows 130 8 100% 1998
Metal: A Headbanger’s Journey 148 18 100% 2006
Noam Chomsky: Rebel Without
a Pause 151 88 81% 2003
Global Metal 168 111 77% 2008