http://www.jscdss.com Vol.2 No.1 February 2015: 8-17 Article history:
Accepted 24 November 2014 Published online 3 January 2015
Journal of Soft Computing and Decision
Support Systems
A Comparative Study of CCR-(ε-SVR) and CCR-(ν-SVR) Models for
Efficiency Prediction of Large Decision Making Units
Mohammadreza Farahmand a,c,*, Mohammad Ishak Desa b, Mehrbakhsh Nilashi a a Faculty of Computing, Universiti Teknologi Malaysia, Johor, Malaysia b
Advanced Informatics School, Universiti Teknologi Malaysia, Jalan Semarak, 54100 Kuala Lumpur, Malaysia c Department of Science, Abarkouh Branch, Islamic Azad University, Abarkouh, Iran
*
Corresponding author email address: [email protected]
Abstract
In this paper, we develop CCR-(ε-SVR) and CCR-(ν-SVR) models based on modified parameters for efficiency prediction of large DMUs to improve the accuracy and reduce the computation time using three normalization functions. CCR-(ε-SVR) and CCR-(ν-SVR) are evaluated using large datasets over the three normalization functions. The experimental results of comparisons between CCR-(ε-SVR) and CCR-(ν-SVR) demonstrate that the proposed models can significantly improve the accuracy and reduce the computation time in predicting the efficiency of large DMUs.
Keywords:Data Envelopment Analysis (DEA), Support Vector Regression (SVR), Large DMUs, Normalization function
1. Introduction
Data Envelopment Analysis (DEA) is an effective method for obtaining the efficiency of Decision Making Units (DMUs) (Charnes et al., 1978; Chen and van Dalen, 2010; Emrouznejad and Shale, 2009). DMUs have been generated based on production function, cost function and measuring efficiency for evaluation and selection (Koopmans, 1951; Debreu, 1951; Farrell, 1957). Conventional DEA methods such as Charnes, Cooper and Rhodes (CCR) and Banker, Charnes and Cooper (BCC) models have been proposed by (Charnes et al., 1978; Banker, et al., 1984). Methods such as Additive DEA model (ADD), Enhanced Russell Measure (ERM) and Slack Based Measure (SBM) have been proposed to classify the DMUs into efficient and inefficient units which are not able to complete ranking for DMUs (Charnes et al., 1985; Färe and Knox, 1978; Pastor et al., 1999). In the most of these DEA models, the best DMUs have an efficiency score of unity, and, the experience is shown that there are usually plural DMUs which have this efficient status.
The dimensions of the original DEA linear programs formulated by Charnes et al. (1987) are essentially the dimensions of the n by m matrix defined by the data. Since
DEA procedure of Charnes et al. (1987) requires the application of n Linear Programs (LPs).
To overcome the computation time in DEA, several researchers tackled the problem in large data sets with using different DMUs (Ali, 1990, 1993, 1994; Ali and Seiford, 1993; Barr et al., 2002; Dulá, 2008).
Although LPs can be solved in polynomial time, the repeated solution of LPs becomes computationally intensive and time consuming, especially when large data sets are involved. In the other hand, for a massive data set with high dimensions of inputs and outputs for DMUs, DEA needs huge computer resources in terms of memory and CPU time (Emrouznejad and Shale, 2009).
The main problems with DEA based methods for large DMUs raking are time consuming and insufficient accuracy. The proposed combination of DEA and SVR (DEA-SVR) method for large DMU's efficiency evaluation was presented by Farahmand et al. (2014). They presented a combination of two conventionally methods, namely CCR and BCC with SVR (CCR/BCC-(ν-SVR)) for measuring of efficiency large DMUs ranking. The data used for training the SVR includes input, output and efficiency of DEA. This method was proposed for
drawbacks which include uncontrolled convergence and non-generalization. For SVR, they selected the ν-SVR using RBF kernel and obtained the best value by 2-fold and 10-fold cross-validation. The DEA-SVR method was applied to five data sets each with 5000 units, and compared the results with the combined methods by DEA and NN. Also, Experimental results demonstrated that the proposed method outperforms the earlier developed combined method of back-propagation neural network and DEA.
As can be found from the above literature, the accuracy and computational complexity in measuring the efficiency of large DMUs still have been two main challenges in the field. Besides that, requiring huge computer resources that spend large amount of memory and CPU time for large DMUs is one of the main issues connected to the conventional DEA. In addition, the approaches used in the prior researches have some drawbacks which include uncontrolled convergence, non-generalization and unstable. Thus, in this paper, a comparative study between two new models based on select the best normalization is presented and tested its performance to evaluate efficiencies of large number of DMUs.
The remainder of this paper is organized as follows. Related work of SVR is presented in Section 2. DEA-SVR method explains in Section 3. Section 4 presents the experimental results and performance evaluation and comparison for the proposed method. Finally, conclusions are presented in Section 5.
2. Related work of DEA-SVR method
2.1 Normalization Functions
The normalization functions and distance measures are also taken into consideration. Four normalization functions extracted from Yoon and Hwang (1995), Milani et al. (2005) and Graf (2001) are used in the experimental study.
1. Normalization (1) (denoted by NF1)):
1 , 1, 2,..., , 1, 2,...,
max ij
ij j
x
NF i m j n
x
(1)
2. Normalization (2) (denoted by NF2):
2
min
, 1, 2,..., , 1, 2,...,
max min
ij j ij
ij j ij j
x x
NF i m j n
x x
(2)
3. Normalization (3) (denoted by NF3):
3 , 1, 2,..., 1, 2,...,
ij ij
j x x
NF i m and j n
(3)
where σj is the standard deviation of alternative ratings with respect to the jth attribute.
2.2 Kernel Functions
The use of a standard kernel functions are as follows (Scholkopf and Smola, 2002; Abe, 2010)):
1. Linear Function (LF):
1( ,i j) i, j
K x x x x c (4)
where c and
x x
i,
j
are products inner between xi and xj vectors in Rn and kernel-specific parameters, respectively. 2. Radial Basic Function (RBF):2
2
2
( )
2
2( , )
i j
x x
i j i j
x x
K x x e e
(5)
where
2
1 2
must be value optimized. 3. Polynomial Function (PF):
3( , ) ( , )
d i j i j
K x x b x x c (6)
where b, c and d are kernel-specific parameters.
4. Sigmoid Function (SF):
4( ,i j) tanh( i, j )
K x x b x x c (7)
where b and c are kernel-specific parameters.
5. Cauchy Function (CF):
2 1 5( , ) (1 2 )
xi xj i j
K x x
(8)
where must be value optimized.
6. Logarithm Function (LOGF):
6( , ) log( )
d
i j i j
K x x x x c (9)
Select the parameter optimize such as γ, c, b, d and σ in kernel functions is very important. The parameters are affected in run time and accuracy. In Eq. (5), γ is the important parameter to increase accuracy in SVM algorithm. The best parameters, such as γ in RBF kernel, can be obtained using cross-validation model.
3. DEA-SVR method
Assume that there are VDMUj=(Xj, Yj,θj) (for j=1,2,…,n) is vector belongs
R
M
R
where, M=m+s. A general scheme of the DEA-SVR method withX
j
( , ,...,
x x
1j 2jx
mj)
and
Y
j
(
y y
1j,
2j,...,
y
sj)
whereθ
j, Ii(i=1,2,…,m) and Or (r=1,2,…,s) are efficiency, input and output vectors of DMUj=(Xj,Yj), respectively.Suppose
1, 1
, ( , ),2 2 , ( ,n ) M nx y x y x y R R where M
R is a dot product space and primal objective function for ε-SVR as the following:
*
,
1
*
*
1
min . ( ) 2
. . .
, 0, 1, 2, ,
n t
i i w b
i t
i i i
t
i i i
i i
w w C
y w x b
s t w x b y
i n
(10)
where C > 0, φ(xi) maps xi into a higher dimensional space,
w is the margin.
Dual optimization problem of ε-SVR model is given by:
* * * *
1 1 1 1
* *
1
max 1
α 2
: 0 , [0, ]
k k k k
i j i i j j i i i i i
i j i i
k
i i i i
i
x x y
subject to and C
(11)
The prediction function is given as,
*
1
( ) ,
n
i i i
i
f x K x x b
(12)where,
i,
j
i
j ijK x x
x
x
Q
(13)K is a kernel function and Q is called kernel matrix and it is used in the SVR algorithm. In this chapter, the following RBF kernel function is used.
3.1 Proposed DEA-SVR method
In this section, the proposed combination of DEA and SVR, DEA-SVR, method for DMU's efficiency evaluation is presented. The ν-SVR model is presented and used in the new proposed DEA-SVR method by Farahmand et al. (2014). In this proposed method, the authors are testing the two common methods of DEA, namely CCR and BCC (Cooper et al., 2007), and combined them individually with SVR. The DEA-SVR method studied consist of CCR-SVR and BCC-SVR methods. In this paper, two SVR models, namely the ε-SVR and ν-SVR models are considered for the improved CCR-SVR method called CCR-(ε-SVR) and CCR-(ν-SVR), respectively. The process of DEA-SVR method is presented in Algorithm 1 as following (Farahmand et al., 2014):
Algorithm 1: Process ofDEA-SVR method
Step 1: Get the input data=(Xj,Yj)=[DMU Inputs|DMU Outputs]. The method requires a set of DMUs, each with set of DMU's input
and output.
Step 2: Calculate efficiency of units using DEA with CCR model (Obtained θCCR). Step 3: Calculate NIO=Normalized [DMU Inputs|DMU Outputs].
here, normalization functions Eq.(1,2 and 3) are used.
Step 4: Calculate XCCR=[NIO|θCCR].
Step 5:Calculate XSVRCCR=[feature column number: XCCR]
where the number of features = the number of DMU inputs + the number of DMU outputs.
Step 6: Calculate (Feature set) FSCCR= [θCCR |XSVRCCR].
Step 7: Select the best parameters C, γ ,ν , ε andthe best kernel function for ν-SVR or ε-SVR model based on t run programming (t trials) by do k-Fold cross-validation (obtain MSE average for each run and select the best solution).
Step 8: If the results are satisfactory then stop, else go to Step 7.
Step 9: Stop.
3.2. Proposed CCR-(ε-SVR) and CCR-(ν-SVR) models
There are two SVR models for non-separable data points, namely ε-SVR and ν-SVR. In algorithm 1, DEA and SVR are replaced with CCR and ε-SVR or ν-SVR to develop two hybrid methods called CCR-(ε-SVR) and CCR-(ν-SVR), respectively. The CCR-(ν-SVR) model was developed by Farahmand et al. (2014) based on RBF kernel and normalization function as presented in Eq. (5) and Eq.
parameters can play important role in achieving noticeable results.
4. Experimental results and performance comparisons
This section explains the experiments carried out to test the performance of the proposed DEA-SVR algorithm for large DMU's data sets. The performance is in terms of accuracy which is measured by several evaluation methods. Performance comparisons between normalization functions, DEA-SVR models, predicting efficiency of new DMUs and stability analysis of DEA-SVR with DEA-NN are also presented.
4.1 Evaluation methods
In this section, the experiments perform on large data sets to test the performance of the proposed method. The performance is defined in terms of accuracy which is measured by reduction of efficient units to obtain the DMU's ranking. In our experiments, performance comparisons between proposed method and CCR model and integrated DEA with prediction methods are presented. For evaluating the proposed method, one measures of accuracy are used to determine the algorithm capability for DMUs ranking.
K-Fold cross-validation: K-Fold cross-validation estimates of performance cross-validation is a computer intensive technique, using all available examples as training and test examples. It makes pattern for the use of training and test sets by repeatedly training the algorithm K times with a fraction 1/K of training examples left out for testing purposes. This kind of hold-out estimate of performance lacks computational efficiency due to the repeated training, but the latter are meant to lower the variance of the estimate. Cross Validation metrics are used based on as following (Bengio and Grandvalet, 2004):
Mean Squared Error (MSE):
(14)
where f(xi) must be approximated by yi.
Root Mean Squared Error RMSE):
(15)
where f(xi) must be approximated by yi. 4.2 Data set description
The experimental data set for this experiment was taken from (Farahmand et al., 2014) which consist of 5 data sets. Each data set contains 5000 units and each unit has 6 attributes of 3 inputs and 3 outputs. The program code for DEA-SVR (i.e. CCR-(ε-SVR) and CCR-(ν-SVR)) and DEA-NN (i.e. CCR-NN) are improved by LIBSVM (Chang and Lin, 2011) implemented in MATLAB software.
Furthermore, selecting parameters of ε-SVR or ν-SVR are very important in improvement of CCR-(ε-SVR) or CCR-(ν-SVR) models. As a result, selecting the suitable kernel function, normalization function, SVR models and their parameters can play important role in achieving noticeable results.
4.3 Comparison of results between CCR-(ε-SVR) and CCR-(ν-SVR) models
In this section, the data sets have been used for evaluating the proposed method using large DMUs (DATA 1-5). In the following, the experiments for efficiency and effectiveness evaluations of proposed methods are provided. Firstly, accuracy of the proposed method is evaluated using large data sets for predicting the efficiency of large DMUs.
Table 1 shows the results of comparison between CCR-(ε-SVR) and CCR-(ν-SVR) models based on accuracy (MSE), standard deviation (SD) and time average (TA (seconds)) for predicting the efficiency of large DMUs using DATA 1-5. In this table, results are obtained based on three types of best normalization functions namely NF1, NF2 and NF3 with RBF kernel. This table showed NF3 is better than other normalization functions in terms of MSE, SD and TA.
Table 2 shows the results of comparison between CCR-(ε-SVR) and CCR-(ν-SVR) models based on MSE, SD and time average (TA (seconds)) for predicting the efficiency of large DMUs using DATA 1-5. In this table, results are obtained based on three types of best normalization functions namely NF1, NF2 and NF3 with RBF kernel. This table showed NF3 is better than other normalization functions in terms of MSE.
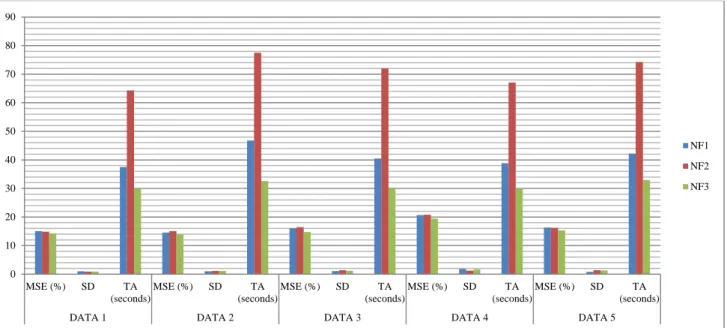
Fig. 1 shows the results of comparison between 3 functions NF1, NF2 and NF3 using CCR-(ε-SVR) model based on MSE, Standard Deviation (SD) and TA (seconds) for DATA 1-5 with 2-Fold cross-validation for predicting the efficiency of large DMUs using DATA 1-5. In this figure, results are obtained based on three types of best normalization functions namely NF1, NF2 and NF3 with RBF kernel. This figure showed NF3 is better than other normalization functions in terms of TA and MSE.
1 2
( ( ) )
1 n
MSE f xi yi
n i
1 2
( ( ) ) 1
n
RMSE f xi yi n
i
Table 1
A comparison between CCR-(ε-SVR) and CCR-(ν-SVR) models with 3 functions (NF1, NF2 and NF3) based on accuracy, standard deviation (SD) and
computational time using prediction of large DMUs for DATA 1-5.
10 Trials, 2-Fold CCR-(ε-SVR) CCR-(ν-SVR)
Normalization Functions
NF1
C*=2000 γ* =3
NF2
C*=3000 γ* =3
NF3
C*=1000 γ*=0.3
NF1C*=2000
γ* =3
NF2
C*=3000 γ* =3
NF3
C*=1000 γ*=0.3 DATA 1 15.0884 0.9843 37.5366 14.8467 0.8832 64.3017 14.2786 0.8523 30.0233 14.0061 1.2307 68.4814 14.5463 0.6244 74.4167 13.9577 1.0374 49.4870 MSE (%) SD TA (seconds) DATA 2 14.5529 1.0067 46.8041 15.0613 1.1318 77.4965 13.9652 1.1593 32.5664 14.1861 1.3560 75.6564 14.5483 0.9645 87.66 13.7174 0.9755 62.3933 MSE (%) SD TA (seconds) DATA 3 16.0605 1.0768 40.4969 16.4356 1.3887 72.0403 14.7559 1.1703 30.3113 15.268 1.2722 73.6281 16.2436 1.0358 82.2234 14.3155 0.8098 62.3122 MSE (%) SD TA (seconds) DATA 4 20.67 1.8169 38.8590 20.7994 1.2722 67.0582 19.4043 1.6367 29.8013 20.284 1.5092 73.5659 20.463 1.6196 82.2743 20.4606 1.8233 50.8884 MSE (%) SD TA (seconds) DATA 5 16.3075 0.7844 42.1743 16.2085 1.3809 74.2466 15.3055 1.33 32.9482 15.1061 0.9576 74.2050 15.8147 1.4301 83.3519 15.1959 1.2848 58.316 MSE (%) SD TA (seconds) Table 2
A comparison between CCR-(ε-SVR) and CCR-(ν-SVR) models with 3 functions (NF1, NF2 and NF3) based on accuracy, standard deviation (SD) and
computational time using prediction of large DMUs for DATA 1-5.
10 Trials, 5-Fold CCR-(ε-SVR) CCR-(ν-SVR)
Normalization Functions
NF1
C*=2000 γ* =3
NF2
C*=3000 γ* =3
NF3
C*=1000 γ*=0.3
NF1
C*=2000 γ* =3
NF2
C*=3000 γ* =3
NF3
Fig. 1 A comparison between 3 functions NF1, NF2 and NF3 using CCR-(ε-SVR) model based on MSE, Standard Deviation (SD) and TA (seconds) for
DATA 1-5 with 2-Fold cross-validation.
Fig. 2 shows the results of comparison between 3 functions NF1, NF2 and NF3 using CCR-(ν-SVR) model based on MSE, Standard Deviation (SD) and TA (seconds) for DATA 1-5 with 2-Fold cross-validation for predicting the efficiency of large DMUs using DATA 1-5. In this
figure, results are obtained based on three types of best normalization functions namely NF1, NF2 and NF3 with RBF kernel. This figure showed NF3 is better than other normalization functions in terms of TA and MSE.
Fig. 2 A comparison between 3 functions NF1, NF2 and NF3 using CCR-(ν-SVR) model based on MSE, Standard Deviation (SD) and TA (seconds) for
DATA 1-5 with 2-Fold cross-validation.
Fig. 3 shows the results of comparison between 3 functions NF1, NF2 and NF3 using CCR-(ε-SVR) model based on MSE, Standard Deviation (SD) and TA (seconds) for DATA 1-5 with 5-Fold cross-validation for predicting the efficiency of large DMUs using DATA 1-5. In this
figure, results are obtained based on three types of best normalization functions namely NF1, NF2 and NF3 with RBF kernel. This figure showed NF1 is better than other normalization functions in terms of TA and MSE.
0 10 20 30 40 50 60 70 80 90
MSE (%) SD TA
(seconds)
MSE (%) SD TA
(seconds)
MSE (%) SD TA
(seconds)
MSE (%) SD TA
(seconds)
MSE (%) SD TA
(seconds)
DATA 1 DATA 2 DATA 3 DATA 4 DATA 5
NF1
NF2
NF3
0 10 20 30 40 50 60 70 80 90 100
MSE (%) SD TA
(seconds)
MSE (%) SD TA
(seconds)
MSE (%) SD TA
(seconds)
MSE (%) SD TA
(seconds)
MSE (%) SD TA
(seconds)
DATA 1 DATA 2 DATA 3 DATA 4 DATA 5
NF1
NF2
Fig. 3 A comparison between 3 functions NF1, NF2 and NF3 using CCR-(ε-SVR) model based on MSE, Standard Deviation (SD) and TA (seconds) for
DATA 1-5 with 5-Fold cross-validation.
Fig. 4 shows the results of comparison between 3 functions NF1, NF2 and NF3 using CCR-(ν-SVR) model based on MSE, Standard Deviation (SD) and TA (seconds) for DATA 1-5 with 5-Fold cross-validation for predicting the efficiency of large DMUs using DATA 1-5. In this
figure, results are obtained based on three types of best normalization functions namely NF1, NF2 and NF3 with RBF kernel. This figure showed NF1 is better than other normalization functions in terms of TA and MSE.
Fig. 4 A comparison between 3 functions NF1, NF2 and NF3 using CCR-(ν-SVR) model based on MSE, Standard Deviation (SD) and TA (seconds) for
DATA 1-5 with 5-Fold cross-validation. 0
20 40 60 80 100 120 140 160
M
SE
(%
)
SD
T
A
(s
ec
on
ds
)
M
SE
(%
)
SD
T
A
(s
ec
on
ds
)
M
SE
(%
)
SD
T
A
(s
ec
on
ds
)
M
SE
(%
)
SD
T
A
(s
ec
on
ds
)
M
SE
(%
)
SD
T
A
(s
ec
on
ds
)
DATA 1 DATA 2 DATA 3 DATA 4 DATA 5
NF1
NF2
NF3
0 50 100 150 200 250
M
S
E
(
%
)
SD
T
A
(s
ec
on
ds
)
M
S
E
(
%
)
SD
T
A
(s
ec
on
ds
)
M
S
E
(
%
)
SD
T
A
(s
ec
on
ds
)
M
S
E
(
%
)
SD
T
A
(s
ec
on
ds
)
M
S
E
(
%
)
SD
T
A
(s
ec
on
ds
)
DATA 1 DATA 2 DATA 3 DATA 4 DATA 5
NF1
NF2
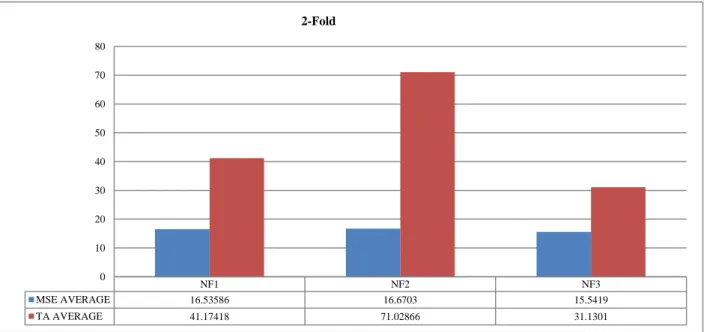
Fig. 5 shows the results of comparison between 3 functions NF1, NF2 and NF3 using CCR-(ε-SVR) model based on average of MSE, and TA (seconds) for DATA 1-5 with 2-Fold cross-validation for predicting the efficiency of DMUs using DATA 1-5. In this figure, results are obtained
based on three types of best normalization functions namely NF1, NF2 and NF3 with RBF kernel. This figure showed NF3 is better than other normalization functions in terms of TA.
Fig. 5 A comparison between 3 functions NF1, NF2 and NF3 using CCR-(ε-SVR) model with 2-Fold cross-validation based on average of MSE and TA for
DATA 1-5.
Fig. 6 shows the results of comparison between 3 functions NF1, NF2 and NF3 using CCR-(ν-SVR) model based on average of MSE, and TA (seconds) for DATA 1-5 with 2-Fold cross-validation for predicting the efficiency of DMUs using DATA 1-5. In this figure, results are obtained based on three types of best normalization functions namely NF1, NF2 and NF3 with RBF kernel. This figure showed NF3 is better than other normalization functions in
terms of TA. Fig. 7 shows the results of comparison between CCR-(ε-SVR) and CCR-(ν-SVR) models using based on average of MSE and TA (seconds) for DATA 1-5 with 2-Fold cross-validation for predicting the efficiency of DMUs using DATA 1-5. In this figure, results are obtained based on NF3 and RBF kernel. This figure showed CCR-(ε -SVR) model is better than CCR-(ν-SVR) models in terms of average of TA for DATA 1-5.
Fig. 6 A comparison between 3 functions NF1, NF2 and NF3 using CCR-(ν-SVR) model with 2-Fold cross-validation based on average of MSE and TA for
DATA 1-5.
NF1 NF2 NF3
MSE AVERAGE 16.53586 16.6703 15.5419
TA AVERAGE 41.17418 71.02866 31.1301
0 10 20 30 40 50 60 70 80
2-Fold
NF1 NF2 NF3
MSE AVERAGE 15.77006 16.32318 15.52942
TA AVERAGE 73.10736 81.98526 56.67938
0 10 20 30 40 50 60 70 80 90
Fig. 7 A comparison between CCR-(ε-SVR) and CCR-(ν-SVR) models using NF3 using with 2-Fold cross-validation based on average of MSE
and TA for DATA 1-5.
5. Conclusions
This paper developed Data Envelopment Analysis (DEA) and Support Vector Regression (SVR) for improving CCR-(ν-SVR) and CCR-(ε-SVR) models using 4 normalization functions. The results showed that Radial Basic Function (RBF) kernel is better than other functions for predicting efficiency of large DMUs. The study showed that selecting parameters of ε-SVR or ν-SVR is very important in improvement of DEA-SVR method. In addition, the results showed that selecting the suitable kernel function, normalization function, SVR models and their parameters plays an important role in achieving high accuracy improvement and low computation time. Finally, CCR-(ν-SVR) model solved problems such as instability, computational time and insufficient accuracy for predicting efficiency of new small and large DMUs with new proposed normalization functions.
References
Abe, S. (2010). Support vector machines for pattern classification. Springer.
Ali, A. I. (1993). Streamlined computation for data envelopment analysis. European journal of operational research, 64(1), 61-67.
Ali, A. I. (1994). Computational aspects of DEA (pp. 63-88). Springer Netherlands.
Ali, A. I., & Seiford, L. M. (1993). Computational accuracy and infinitesimals in data envelopment analysis. Infor, 31(4), 290-297.
Banker, R. D., Charnes, A., & Cooper, W. W. (1984). Some models for estimating technical and scale inefficiencies in data envelopment analysis.Management science, 30(9), 1078-1092.
Barr, R. S., & Durchholz, M. L. (1997). Parallel and hierarchical decomposition approaches for solving large-scale data
envelopment analysis models. Annals of Operations Research, 73, 339-372.
Barr, R. S., Killgo, K. A., Siems, T. F., & Zimmel, S. (2002). Evaluating the productive efficiency and performance of US commercial banks. Managerial Finance, 28(8), 3-25.
Bengio, Y., & Grandvalet, Y. (2004). No unbiased estimator of the variance of k-fold cross-validation. The Journal of Machine Learning Research, 5, 1089-1105.
Chang, C. C., & Lin, C. J. (2011). LIBSVM: a library for support vector machines. ACM Transactions on Intelligent Systems and Technology (TIST),2(3), 27.
Charnes, A., Cooper, W. W., & Rhodes, E. (1978). Measuring the efficiency of decision making units. European journal of operational research, 2(6), 429-444.
Charnes, A., Cooper, W. W., Golany, B., Seiford, L., & Stutz, J. (1985). Foundations of data envelopment analysis for Pareto-Koopmans efficient empirical production functions. Journal of econometrics, 30(1), 91-107.
Chen, C. M., & van Dalen, J. (2010). Measuring dynamic efficiency: Theories and an integrated methodology. European Journal of Operational Research, 203(3), 749-760.
Cooper, W. W., Seiford, L. M., & Tone, K. (2007). Data envelopment analysis: A comprehensive text with models, applications, references and DEA-Solver Software. Second editions. Springer, ISBN, 387452818, 490.
Dulá, J. H. (2008). A computational study of DEA with massive data sets.Computers & Operations Research, 35(4), 1191-1203.
Emrouznejad, A., & Shale, E. (2009). A combined neural network and DEA for measuring efficiency of large scale datasets. Computers & Industrial Engineering, 56(1), 249-254. Farahmand, M., Desa, M. I., & Nilashi, M. (2014). A Combined Data Envelopment Analysis and Support Vector Regression for Efficiency Evaluation of Large Decision Making Units. International Journal of Engineering and Technology (IJET). pp. 2310-2321.
Färe, R., & Knox Lovell, C. A. (1978). Measuring the technical efficiency of production. Journal of Economic theory, 19(1), 150-162.
Farrell, M. J. (1957). The measurement of productive efficiency. Journal of the Royal Statistical Society. Series A (General), 253-290.
Graf, A. B., & Borer, S. (2001). Normalization in support vector machines. Pattern Recognition (pp. 277-282). Springer Berlin Heidelberg.
Koopmans, T. C. (1951). Analysis of production as an efficient combination of activities. Activity analysis of production and allocation, 13, 33-37.
Milani, A. S., Shanian, A., Madoliat, R., & Nemes, J. A. (2005). The effect of normalization norms in multiple attribute decision making models: a case study in gear material selection. Structural and multidisciplinary optimization, 29(4), 312-318.
Pastor, J. T., Ruiz, J. L., & Sirvent, I. (1999). An enhanced DEA Russell graph efficiency measure. European Journal of Operational Research, 115(3), 596-607.
Samoilenko, S., & Osei-Bryson, K. M. (2010). Determining sources of relative inefficiency in heterogeneous samples: Methodology using Cluster Analysis, DEA and Neural Networks. European Journal of Operational Research, 206(2), 479-487.
Schölkopf, B., & Smola, A. J. (2002). Learning with kernels: support vector machines, regularization, optimization, and beyond. MIT press.
31.1301
56.67938
0 10 20 30 40 50 60
CCR-(ε-SVR) CCR-(ν-SVR) NF3