286
STRUCTURE AND EVOLUTION OF THE TURNOVER
OF R.N.P. ROMSILVA (2015-2017)
PÂNZARU R.L., MEDELETE D.M.
Faculty of Agronomy, University of Craiova
Key words: production, import, export, stock, available, consumption
ABSTRACT
The forest is a basic component of the environment, without which human life and not only cannot be conceived, fulfilling the role of its improvement and preservation.
The forest is designed to provide a rich range of products with an undisputed economic value to the human. It is not only the woody mass and the other products of the forest, including: game, fish, berries, edible mushrooms, herbs, resin, tanning substances, etc.
National forestry Director – Romsilva is a legal person, headquartered in the municipality of Bucharest and operates on economic management and financial autonomy, exercising also public service tasks, with specific forestry and horse Authority accordance with the provisions of the organization and functioning regulation – approved by Government decision. The specific legal basis under which the National Forestry Director-Romsilva operates and is organized, are Law No. 46/2008 (Silvic code) and HG No. 229/2009 on reorganization of the National Forest Registry – Romsilva.
National Forestry Director – Romsilva represents a strategic unit at national level through the range of activities it carries out, thanks to its role in the national economy.
During the period analyzed (2015-2017) It is noted that the component indicators of the turnover in the natural expression recorded differentiated developments: ascending – The volume of the recovered woody mass and the amount of forest seeds ; Fluctuating – the quantities of berries and truffles and other edible mushrooms, respectively; Descending – Number of forestry and ornamental puffs in forestry nursery.
.
INTRODUCTION
The phenomenon of restructuring the national economy has also affected forestry as a branch of it, experiencing significant changes especially in terms of ownership structure.However, the whole complex of forest normative measures is subject to a fundamental objective - that of ensuring the real conditions for the sustainable management of forests, regardless of who owns or will own them.
Given the role of forests in human life, we consider that it is necessary for the whole social mechanism (liability factor, economic agents, the human being as an entity) to accept that ensuring and guaranteeing the sustainable management of forests is the only policy that needs to be elevated to the rank.
national, in which the consensus is to be achieved in the most natural way, without the need for prior negotiations.
287
sports competitions, fairs and exhibitions. At the same time, through the 22 parks administrations, units with legal personality, RNP - Romsilva manages 22 national and natural parks in which the state-owned forest fund has a significant share, ensuring the conservation of biodiversity in these protected areas.
By their nature, forests have many functions with direct and indirect implications in the social and economic life of man. To better understand the manifestation of the functions of forests, these (forests) have been systematized into two groups.
The first group includes forests with social functions of water, soil, climate and national interest objectives, recreational forests, forests for the protection of the geno-found and eco-fund, as well as the declared forests of nature and reserves.
In the second group, the forests with production and protection functions are included, in which the main objective is to achieve, mainly, high quality wood mass and other forest products and the protection of the quality of the environmental factors.
METHOD AND MATERIAL
The turnover includes the total amount of the revenues from the commercial operations carried out by the company, namely the sale of goods and products within a certain period of time. The amount of the turnover does not include the financial income and the exceptional income. In fair terms, the turnover represents the sum of the revenues related to the delivered goods, to the executed works, to the services provided, as well as to other operating revenues, less discounts, discounts and other discounts granted to customers. The notion of turnover, can be approached in several categories: total turnover, average turnover, marginal turnover and critical turnover, each highlighting an aspect regarding the activity of the company. The total turnover represents the total volume of the
business of a company, evaluated at the market prices, respectively the total receipts. It covers all the revenues from the sale of goods and products, the execution of works and the provision of services over a period of time.
The turnover of the forestry unit represents the revenues obtained from the valorization of the products specific to the forestry fund, from the specialized forestry services (without VAT) that they carry out within the forestry structures, as
well as from compensations,
authorizations and tariffs.
The valorized products include: valorized wood mass, forest and ornamental seedlings from forest nurseries, forest seeds, berries, truffles and other mushrooms of spontaneous flora, other non-wood products, game products, fish products, bee products (honey bees) and others valorization.
The valorized wood mass
represents the total volume of wood mass valorized internally or on the intra and extra-Community market until the end of the reference year, in compliance with the legislation in force. The wood table can be used on the foot, in the form of assorted wood or in the form of timber and other semi-finished products.
Other wood products, include ornamental trees and shrubs and Christmas trees, wicker.
Other non-wood products refer to herbs and herbs, soft drinks and resin.
The hunting products include the meat and the fur of the shot, the live game caught, the pheasants produced in the pheasant, horns (deer and deer) sold.
Fishery products refer to consumer trout (from mountain and trout waters), other species of consumer fish (from inland waters and landscaped ponds), offspring, spawning (consumption, embryo) sold.
288
agricultural products destined for valorization to various beneficiaries, granulated food.
The following indicators were used for the present work:
- indicators in natural expression: wood mass recovered (thousands mc), forest and ornamental seedlings from forest nurseries (thousands pcs), forest seeds (t), berries (t), truffles and other mushrooms of spontaneous flora (t);
- indicators in value expression: capitalized products (thousands lei), forestry services (thousands lei), compensation, authorizations, tariffs (thousands of lei), turnover (thousands of lei).
The turnover appears as a sum of the valorized products, forest services, compensations, authorizations and tariffs. In order to determine the value of the valorized wood mass, the seedlings and
the shrubs, the forest seeds, the berries and the mushrooms, from the total value of the valorized products, the level of other wood products, other non-wood products, hunting products, fishery products, beekeeping products has decreased.
The dynamics of the indicators is highlighted by the use of fixed and mobile based indices, which in practice transpose the method of time comparation (dynamic series consisting of four terms: 2015, 2016, 2017 and the average of the period).
RESULTS AND DISCUSSIONS
Table 1 presents the level of the indicators included in the turnover, expressed in natural units.
.
Table 1.
Products used - indicators in natural expression
Specificare U.M.
Year
Period average**
2015 2016 2017
Effective* Dynamic** Effective* Dynamic** Effective* Dynamic** Effective Dynamic
Ibf Ibm Ibf Ibm Ibf Ibm Ibf Ibm
Wooden table made use of
Th.
mc 11,322.9 100 100 11,254.5 99.40 99.40 12,021.8 106.17 106.82 11,533.07 101.86 95.93 Forestry and
ornamental puffs in forestry nursery
Th.
pcs. 15,166.2 100 100 13,631.0 89.88 89.88 10,476.6 69.08 76.86 13,091.27 86.32 124.96
Forest
seeds t 7.3 100 100 7.6 104.11 104.11 8.7 119.18 114.47 7.87 107.81 90.46
Berries t 3,481.9 100 100 2,442.4 70.15 70.15 3,182.7 91.41 130.31 3,035.67 87.18 95.38 Truffles and
other edible mushrooms from spontaneous flora
t 542.7 100 100 460.7 84.89 84.89 495.0 91.21 107.45 499.47 92.03 100.90
*http://statistici.insse.ro:8077/tempo-online/#/pages/tables/insse-table (25.02.2019)
**my calculation
The harnessed woody mass ranged from 11,254.5 thousand M.C. in 2016, up to 12,021.8 thousand M.C. at the level of 2017, and the average period reached 11,533.07 thousand M.C. (Fig. 1.). The indicator's dynamics highlight an uneven evolution, characterized by decreases by 0.60% in 2016 compared to 2015 (11,245.5 versus 11,322.9 thousand M.C.), increases with 6.17 and 6.82% at
the level of 2017 – compared to the reporting terms, and the average Exceeded 1.01 times the level of 2015 but decreased by 4.07% compared to the previous term of the dynamic series.
289
dynamic of the indicator is found (successive annual decreases of 10.12 and 23.14% in the case of 2016 and 2017 respectively). The only Superunit index in dynamics is the average of the period (124.96% compared to the previous time of the dynamic series).
11,322.911,254.5
12,021.811,533.07 15,166.2
13,631.0
10,476.6
13,091.27
Harnessed Woody Mass Forestry and Ornamental Puffs
Fig. 1. Harnessed Wood (thousands m.c.) and forestry and ornamental
puffs (thousand pcs)
If we refer to the production of recovered forest seed, it is found that it ranged from 7.3 to 8.7 t (2015 and 2017 respectively) and the average of the period was 7.87 t (Fig. 2.). In this context, the indicator's dynamics are a strictly ascending one (the only subunit level being 90.46% for the average of the period compared to the previous time of the dynamic series). The reporting bases were 1.04 times in year 2016, 1.19 and 1.14 times in the case of 2017 and 1.07 times for the average of the period.
The quantity of berries recorded an average of 3,035.67 t, which is based on annual sequential situations of: 3,481.9 t
in 2015, 2,442.4 t at the level of the year 2016 and 3,182.7 t respectively for the year 2017 (Fig. 2.). The indicator's dynamics are uneven, 29.85% decreases specific to 2016, followed by 30.31% increase in 2017 compared to the previous year. The average period is lower than both reporting bases with 12.82 and 4.62% respectively.
7.3 7.6 8.7 7.87 3,481.9
2,442.4 3,182.7
3,036.67
542.7
460.7 495.0
499.47
Forest seeds Berries
Truffles and other mushrooms
Fig. 2. Production of forest seeds, berries, truffles and other mushrooms
(t)
290
respectively) are found and the average period reached 499.47 t (Fig. 2.). Starting from this situation, there is an uneven dynamic of the indicator, with decreases of 15.11% in the case of 2016 compared to the first term of the dynamic series, increases by 7.45% in 2017 (495.0 t) compared with the previous term of the
dynamic series. The average of the period was less than 7.97% compared to 2015 but exceeded 0.90% of the specific situation of the year 2017.
Table 2 provides information on the value indicators of the turnover.
Table 2.
Turnover, value indicators – structure
No. Specification
Year
Period average**
2015 2016 2017
Effective Th. lei*
Structure %**
Effective Th. lei*
Structure %**
Effective Th. lei*
Structure %**
Effective Th.lei
Structure % 1. Harnessed
Products 1,858,099.0 88.17 2,015,021.8 89.36 2,210,320.1 89.26 2,027,813.63 88.96 1.1. Wood,
forestry, seeds, berries, truffles and other mushrooms
1,786,709.8 84.78 1,968,280.6 87.29 2,185,814.8 88.27 1,980,268.40 86.86
1.2. Other Woody Products
2,702.1 0.13 1,72.7 0.07 1,186.6 0.04 1,872.46 0.08
1.3. Other non-Woody products
3,246.7 0.15 2,789.6 0.12 3,256.1 0.13 3,097.47 0.14
1.4. Hunting
Products 5,903.4 0.28 5,229.1 0.23 5,170.2 0.21 5,434.23 0.24
1.5. Fishery
Products 11,093.8 0.53 8,992.9 0.40 9,060.9 0.37 9,715.87 0.43
1.6. Apiculture
Products 9.9 0.01 39.5 0.01 63.7 0.01 37.70 0.01
1.7. Other
valorations 48,433.3 2,.29 27,961.4 1.24 5,767.8 0.23 27,387.50 1.20
2. Forestry
services 201,141.3 9,.54 163,194.9 7.24 198,931.9 8.03 187,756.03 8.23 3. Damages,
permits, tariffs
48,349.7 2.29 76,613.5 3.40 67,002.5 2.71 63,988.57 2.81
4. Turnover 2,107,590.0 100 2,254,830.1 100 2,476,254.5 100 2,279,558.23 100
*http://statistici.insse.ro:8077/tempo-online/#/pages/tables/insse-table (25.02.2019)
**my calculation
In the case of 2015, a turnover of 2,107,590 thousand lei is found, where the recovered products contributed 1,858,099 thousand lei (88.17% of the total), the Services of forestry held 201,141.3 thousand lei (9.54%), and the compensation, authorizations and The tariffs contributed 49,349.7 thousand lei (2.29%). At the level of the recovered products are: 1,786,709.8 thousand lei wood, forestry and ornamental puffs, forest seeds, berries, truffles and other edible mushrooms (84.78% of the total); 2,702.1 thousand lei other woody products (0.13%); 3,246.7 thousand lei
other non-woody products (0.15%); 5,903.4 thousand lei hunting products (0.28%); 11,093.8 thousand lei fishery products (0.53%); 9.9 thousand lei apiculture products (0.01%); 48,433.3 thousand lei Other capitalizations ( 2.29%).
291
the turnover reached 2,254,830.1 thousand lei. For the products being recovered, the weights were: 0.01%-apiculture products (39.5 thousand lei); 0.07%-Other woody products (1,728.7 thousand lei); 0.12%-Other wood products (2,789.6 thousand lei); 0.23%-hunting products (5,229.1 thousand lei); 0.40%-Fishery products (8,992.9 thousand lei); 1.24%-Other capitalizations (27,961.4 thousand lei); 87.29%-Woody mass, seedlings, seeds, berries, truffles and edible mushrooms (1,968,280.6 thousand lei).
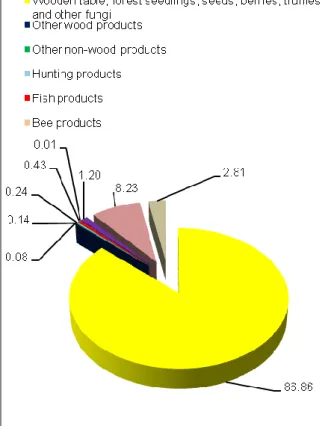
For the year 2017, variable weights in turnover (2,476,254.5 thousand lei) are observed, from 2.71% in the case of compensations, authorizations and tariffs (67,002.5 thousand lei) to 89.26% for products sold (2,210,320.1 thousand Lei). In the setting up of turnover, 8.03% of the services of forestry – 198,931.9 thousand Lei contributed more. The components of the recovered products were: Woody Mass, seedlings, seeds, berries, truffles and other mushrooms – 88.27% (2,185,814.8 thousand lei); Fishery products – 0.37% (9,060.9 thousand lei); other valuations– 0.23% (5,767.8 thousand lei); Hunting products – 0.21% (5,170.2 thousand lei); Other wood products – 0.04% (1,186.6 thousand lei); Apiculture Products – 0.01% (63.7 thousand lei).Based on the annual sequential levels, the average period was determined, indicating a total turnover of 2,279,558.23 thousand lei, with the following structure: 0.01% bee products (37.70 thousand lei); 0.08% other wood products (1,872.46 thousand lei); 0.14% other non-wood products (3,097.47 thousand lei); 0.24% hunting products (5,434.23 thousand lei); 0.43% fish products (9,715.87 thousand lei); 1.20% other assets (27,387.50 thousand lei); 2.81% compensation, authorizations, tariffs (63,988.57 thousand lei); 8.23% forest services (187,756.03 thousand lei); 86.86% wood mass, seedlings, seedlings,
berries, truffles and other mushrooms (1,980,268.40 thousand lei - fig. 3).
Fig. 3. Turnover, average period - structure (%)
In these conditions, we can notice the weight of 88.96% of the valorized products (2,027,813.63 thousand lei).
Table 3 presents the dynamics of the value elements, which make up the turnover.
292
Table 3.
Turnover, value indicators - dynamic *
No. Specification
Year
Period average
2015 2016 2017
Ibf Ibm Ibf Ibm Ibf Ibm Ibf Ibm
1. Harnessed Products 100 100 108.45 108.45 118.96 109.69 109.13 91.70 1.1. Wood, forestry, seeds,
berries, truffles and other mushrooms
100 100 110.16 110.16 122.34 111.05 110.83 90.60 1.2. Other Woody Products 100 100 63.98 63.98 43.91 68.64 69.30 157.80 1.3. Other non-Woody products 100 100 85.92 85.92 100.29 116.72 95.40 95.13
1.4. Hunting Products 100 100 88.58 88.58 87.58 98.87 92.05 105.11
1.5. Fishery Products 100 100 81.06 81.06 81.68 100.76 87.58 107.23
1.6. Apiculture Products 100 100 398.99 398.99 643.43 161.27 380.81 59.18
1.7. Other valuations 100 100 57.73 57.73 11.91 20.63 56.55 474.83
2. Forestry services 100 100 81.13 81.13 98.90 121.90 93.35 94.38
3. Compensations, permits,
tariffs 100 100 158.46 158.46 138.58 87.46 132.35 95.50
4. Turnover 100 100 106.99 106.99 117.49 109.82 108.16 92.06
*my calculation
If we refer to the dynamics of wood mass, forest seedlings, seeds, berries and fungi, we can see the same upward trend. In 2016, the comparison term was exceeded by 10.16%, and for 2017 the overruns of the reporting bases were 22.34 and 11.05% respectively. In these conditions, the average of the period exceeded by 10.83% the state of affairs specific to 2015, but was lower by 9.40% compared to the level of 2017.
For other woody products, the dynamic is a downward one, with successive annual decreases of 36.02 and 31.36% at the level of 2016 and 2017 respectively. Average of the period, is less than 30.70% compared with the first term of the dynamic series, but exceeds, with 57.80% the specific level of 2017.
With regard to the evolution of other non-woody products, dynamic is a fluctuating one, characterized by reductions of 14.08% in year 2016 compared to 2015, with 0.29 and 16.72% increases in the case of 2017 compared to the reporting terms. As a result, the average of the period is less than both reporting bases with 4.60 and 4.87% respectively.
The hunting products are
characterized by a downward trend, the dynamics being dominated by the subunit values of the component indices, except those with the mobile base for the average period (105.11%). The indicator
level decreased by 11.42% in 2016 compared to 2015, by 12.42 and 1.13% in the situation of 2017 and by 7.95% at the average of the period compared to the first term of the dynamic series.
The fishery products show an uneven evolution in time, decreases by 18.94% in 2016 compared to 2015, increases by 0.76% in 2017 compared to the previous term of the dynamic series. In these conditions, the average period was lower by 12.42% compared to the first term of the dynamic series (2015), and higher by 7.23% compared to the previous term of the dynamic series.
If we refer to the evolution recorded by bee products, we can see the strictly increasing direction of their value. Thus, we discuss spectacular advances in reporting terms: 3.98 times in 2016, 6.43 and 1.61 times in 2017. The average period is 3.80 times the specific status of 2015, but is 40.82% lower than the previous term. of the dynamic series.
For the valuations, the dynamics is strictly descending, with the predominance of subunits of dynamics (exception being those with the mobile base for the average period - 474.83%). The characteristic decreases were 42.27% in 2016, 88.09 and 79.37% for 2017, 43.45% at the average of the period.
293
decreases of 18.87% in the case of 2016 compared to the situation of 2015, increases of 21.90% at the level of 2017 compared to the previous term of the dynamic series (2016). Under these conditions, the average period is lower - compared to both reporting terms - by 6.65 and 5.62% respectively.
Compensation, authorizations and tariffs show an uneven evolution. Thus, in 2016 there is an advance of 1.58 times the level of 2015, for 2017 there is a decrease by 12.54% compared to the
previous term of the dynamic series, and the average period is lower by 4.50% compared to the situation specific to 2017.
At a general level, the turnover shows an upward trend, the dynamics being dominated by the supra-unitary levels of the component indices (except those with a mobile base, for the average period - 92.06%). The advances of the comparison terms were 1.06 times for 2016, 1.17 and 1.09 times for 2017 and 1.08 times for the average period.
CONCLUSIONS
The turnover of the National Forest Administration - Romsilva, is a complex indicator that, by its specificity, covers the entire range of incomes of the respective unit, discussing both the valorized products, the provision of forestry services, respectively of the compensation activity, the issuance of authorizations and collection of tariffs. At the level of the valorized products are found all kinds of lucrative activities, materialized by obtaining woody, non-woody, hunting, fish, beekeeping, etc..
In the case of value indicators, the main products in the turnover structure are the capitalized products - 88.96%, followed by the provision of forestry services - 8.23% and the compensations, authorizations and tariffs - 2.81%. As a result, there is a need to increase, as far as possible, the weight of the last two components.
At the level of the valorized products, wood mass, forest seedlings, forest seeds, truffles and other edible mushrooms (86.86% of the total turnover) predominate, followed at a great distance by other uses, fishery products, hunting products, other non-wood products, other products wood and bee products (weights below 1.25%). As a result, the need arises to improve the related activity, at least in the fisheries, hunting and beekeeping sectors, under the conditions
- in which - the wood mass remains the main income generating product.
Under the report of the dynamics of the value indicators, of the turnover, we notice the positive aspects related to the upward trend of the total of the indicator, a situation that is also found for the valorized products, the wood mass and the fishery products. The situation is less convenient for the provision of services, compensation, fishery products and other non-wood products - fluctuating trend.
Unfortunately, downward trends appear, in the case of other wood products, hunting products and other uses.
On the whole, it is necessary to reconsider the complementary activities, so that the increase of the turnover can be realized, under the conditions of the adequate management of the forestry fund and based on the rational exploitation of the wood material.
BIBLIOGRAPHY
1. Barba V., Costea C., 1975, Economics
of the forestry enterprise, Ceres
Publishing, Bucharest
2. Milescu I. et al., 2005, Book of Forestry, Publishing Milyrom, Reghin, 3. Roua C., Ştefănescu E., Mihăilă I., Pafnote M., 1976, Forest ergonomics, Publishing Ceres, Bucharest
4. Stinghe V. et al., 1958, Handbook of forestry engineer, Technical Publishing, Bucharest
294
6. X X X, 1965, Polyglot forest dictionary, Ministry of forest economy, Bucharest 7. X X X, 2001, Guide to economic indicators, Teora Publishing, Bucharest 8.https://ro.wikipedia.org/wiki/Cifr%C4%8 3_de_afaceri
9.http://statistici.insse.ro/shop/ 10.www.fao.org
11.www.insse.ro
12.http://www.rosilva.ro/