Accredited by RISTEKDIKTI, Decree No: 32a/E/KPT/2017 doi: 10.14203/jet.v19.7-12
Design Analysis of Microstrip Rectangular Patch Array
Antenna 16×1 on X-band Radar
Soni Aulia Rahayu
a, *, Joko Suryana
b, Laras Tursilowati
a, Halimurrahman
a,
Ginaldi Ari Nugroho
aaCenter for Atmospheric Science and Technology
LAPAN Jl. Dr. Djunjunan no 133
Bandung, Indonesia
bSchool of Electrical Engineering and Informatic
Institut Teknologi Bandung (ITB) Jl. Ganesha No.10, Lb. Siliwangi, Coblong
Bandung, Indonesia
Abstract
Radar has been widely used for various purposes such as monitoring atmospheric precipitation. For that purpose, it gives more accurate results than satellites do. Previous research has developed navigation radar that alters its functions into an atmospheric precipitation monitoring radar. To improve the development of the radar, an antenna system will be developed in this research. The purpose of developing this antenna is to obtain better data reception results. This antenna is a microstrip rectangular array antenna that works on X-band with a frequency of 9.41 GHz. Microstrip antenna is chosen since it has several advantages such as small dimensions and relatively low costs. The designed antenna gain ≥ 12 dB, bandwidth of 60 MHz, and horizontal polarization. Antenna fabrication produces a microstrip rectangular 16 x 1 array antenna using the mitered bend method at a frequency of 9.4 GHz with a reflection coefficient of -22.8 dB, VSWR of 1.2, gain of 13.21 dB, unidirectional radiation patterns and horizontal polarization.
Keywords: Weather radar, precipitation monitoring, microstrip rectangular array, X-band, mitered bend
I. INTRODUCTION
Indonesia has a vast territory consisting of thousands of islands that requires a tool that can monitor the entire region. There are several methods to monitor the condition of the atmosphere, one of them by using radio detection and ranging (radar). Radar is an electromagnetic wave system for detecting, measuring distances and providing weather information such as rain.
Previous research has made the development of Radar Furuno M1932 mk-2. At first, this radar is navigation radar to detect ships around the aircraft carrier. Then development is carried out by making this radar into monitoring radar for atmospheric precipitation which is utilizing noise from the feedback signal (echo) contained on the ship's radar as a target on the radar monitoring atmospheric precipitation [1]. This radar is used for partial precipitation measurements in the Bandung region and its surroundings. This radar has been able to display a large amount of echo during rain conditions on the ship radar plotter display [2]. Radar Furuno M1932 mk-2 is a non-Doppler radar pulse that has frequency transmission in the X-band range with a wavelength of 3.18 cm.
In this research, the antenna will be designed to be
used in the Furuno M1932 mk-2 Radar for monitoring the atmospheric precipitation. Antennas can also be referred as guided wave transducers (on physical transmission lines) to unmanned waves (on non-physical transmission lines) or vice versa [3]. It is an intermediary device between the cable and air media which must have a matching property with its feeder line.
Antennas have various types of antennas. This research will be focused on microstrip antennas. A microstrip antenna is an antenna consisting of a pair of layers of parallel conductors separated by a dielectric medium known as substrate [4]. The conductors are patch and ground. Patch is a conductor made from copper or gold as the top layer of the antenna and ground is a conductor for the bottom one.
Microstrip antennas have several advantages over common microwave antennas, and are often used for antenna applications that cover a wide frequency range from 100 MHz to 100 GHz [5]. The selection of microstrip antennas has several advantages including small dimensions and relatively inexpensive costs so that it can be an alternative to the development of system antennas since antenna is a crucial component of a radar system because it can determine the performance of the entire radar system, especially in receiving signal which later to be processed.
The antenna in this research is a microstrip array antenna with gain is greater than 12 dB, Voltage
* Corresponding Author.
specification, a microstrip array antenna will be designed. The performance of this microstrip array antenna will be seen from the reflection coefficient value, VSWR, gain, and polarization.
II. METHODOLOGY
A. Antenna Specifications
This research has several steps in the process. The first step of microstrip antenna design is to determine the antenna specification as shown by Table 1.
Substrate used in this research is FR4 Epoxy. It is a popular and sturdy material which has operable frequency of 2 - 10 GHz [6]. In this research, the antenna has a center frequency at 9.41 GHz. The most commonly found Epoxy FR4 substrate has a dielectric constant εr = 4.3 with a thickness of 1.6 mm.
VSWR is an indication of the amount of mismatch between an antenna and the feed line connecting to it [7], [8]. A VSWR value under 2 is considered suitable for most antenna applications. For example VSWR with a ratio of 1.1:1 is better than 1.4:1. VSWR 1:1 measurement shows perfect impedance compatibility and no standing wave voltage will appear in the signal path. While the return loss is the ratio of power that is reflected back to the antenna to the transmitted power. A good antenna will have a return loss value below -10 dB and a VSWR value of ≤ 2 [9].
Gain (directive gain) is an antenna character associated with the antenna's ability to direct its signal radiation, or signal reception from a particular direction [3]. Gain is not a quantity that can be measured in physical units in general such as watts, ohms, or other, but a form of comparison. Therefore, the units used for gain are decibels.
B. Method
After getting the antenna specifications, the next step is designing the antenna according to the flowchart in Figure 1. There are several steps ranging from the determination of specifications, mathematical dimension calculations, simulated using Computer Aided Design (CAD), antenna fabrication, and antenna measurement results from fabrication compared to the required specifications.
TABLE 1 ANTENNA SPECIFICATIONS
No Specification Information
1 Substrates Materials FR4 (εr= 4.3) 2 Substrate thickness (h) 1.6 mm 3 Copper thickness (t) 0.035 mm 4 Working Frequency (fo) 9.41 GHz
5 Bandwidth 60 MHz
6 Radiation pattern Unidirectional 7 Polarization Linear (Horizontal)
8 VSWR ≤ 2
9 Reflection coefficient / Return Loss
≥ -10 dB
10 Gain ≥ 12 dB
START
Frequency = 9.41 GHz Material : FR4
h = 1.6 mm Ԑr = 4.3 t= 0.0035 mm Specifying Antenna Specifications
Determining Patch Dimensions :
Width : Wp Length : Lp
Determining the groundplane Dimensions:
Width : Ws Length : Ls
Specifying Dimensions (Width and Length) Transformer, Edge (200 Ω), Edge (100 Ω) and
Feed (50 Ω):
Simulation Using CAD
Simulation Results In accordance with
Specification
Realization of Antenna Prototype
Measurement
Measurement Results Subject to Specification
END Yes No
Yes No
Figure 1. Microstrip Antenna Design Flow Diagram
Antenna dimensions can be calculated
mathematically by the following parameter values [10], [11]:
The width (W) of the antenna Effective Length (Leff) Length (L)
Ground Plane Length Feed Width
Microstrip channel length
The mathematical calculation results for the size of the single microstrip antenna dimension can be seen in Table 2.
In this research, microstrip antennas use microstrip feedline to connect patch and power. Microstrip feeding is a technique of λ/4 channel combining which has the same impedance as the resonator connected to channel 50 Ω. The calculation of feedline width and length on microstrip antenna will be the basic in designing this antenna array. After knowing the parameter values of the single antenna microstrip patch, it required feed and transformer to combine antennas with each other. Quarter-wave transformers are used to match the 100 Ω lines to the 50 Ω lines and the 200 Ω lines to the 100 Ω lines. The values of the design parameters of microstrip array antennas obtained systematically can be seen in Table 3.
TABLE 2
MATHEMATICAL RESULTS OF MATHEMATICAL ANTENNA PARAMETERS [12]
Microstip Patch
Parameters Simbol Value (mm)
Value (mm) width of
antenna W 9.8
Dielectric effective
constants εeff 3.6
Effective Length Leff 8.4 Length due to fringing
effect 𝞓L 0.7
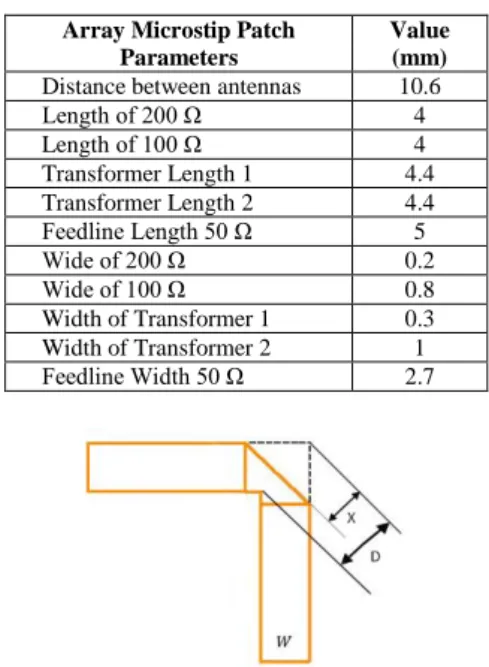
TABLE 3
ARRAY DESIGN PARAMETERS OF MICROSTRIP ANTENNA
Array Microstip Patch Parameters
Value (mm)
Distance between antennas 10.6 Length of 200 Ω 4 Length of 100 Ω 4 Transformer Length 1 4.4 Transformer Length 2 4.4 Feedline Length 50 Ω 5
Wide of 200 Ω 0.2
Wide of 100 Ω 0.8
Width of Transformer 1 0.3 Width of Transformer 2 1 Feedline Width 50 Ω 2.7
Figure 2. Microstrip Mitered Bend Process
Furthermore, simulations were performed using CAD. While using CAD, the values of the parameters that have been obtained systematically must be optimized using mitered bend method to get a 16×1 elements microstrip patch antenna that has good reliability as could be seen from the value of VSWR, reflection coefficient, gain and polarization. The mitered bend process can be used for dielectric constant (εr) values ranging from 2.5 ≤ εr ≤ 25 [13]. In this research, εr of 4.3 is used. Equations (1) and (2) are used to calculate the angle width between the two feeds (D) and cuts for mitered bend optimization respectively [14].
𝐷 = 𝑊√2 (1)
𝑋 = 𝑊√2 × (0.52 + 0.65 × 𝑒(−1.35∗𝑊ℎ)) (2)
where W is feed width and h is substrate’s thickness. The optimization process with mitered bend method uses a cutting angle of 45o and a cutting length of 1.42 at feed width times [15].
III. Results and Discussion
The microstrip antenna in this design will be applied to precipitation (rain) detection radar in real time. This antenna is expected to complement the shortcomings of the antennas used today, in terms of both reliability and dimension size. The principle of rainfall at the time of descent has a horizontal dimension larger than its vertical dimension, so the use of horizontally linear polarization antennas is preferred for weather radar [16].
This research started from designing a single horizontal polarization antenna using mathematical calculations in Table 2 and simulated it using CAD. The simulated antenna can be seen in Figure 3 (left). The Figure 3 (center) is the direction of the electric field of
of the earth. The direction of the electric field is parallel to the surface of the earth as a condition of horizontal polarization [17]. Figure 3 (right) is a tangential value is a loss that must be minimized.
The simulation result for single microstrip antenna has a gain of 4.2 dB. The value of the gain is still far from the expected gain value of 12 dB. Gain (directive gain) is an antenna character associated with the antenna's ability to direct its signal radiation, or signal reception from a particular direction [3]. There are several methods for increasing gain, including the addition of the number of elements with the 2n
provision of the antenna [18] and feed angle cutting methods known as microstrip mitered bend. Mitered bend with cutting angle of 45o and cutting length of 1.42 multiplied by feed width can increase gain [15]. The Mitered Bend method can be used for dielectric constant (εr) values ranging from 2.5 ≤ εr ≤ 25 [13].
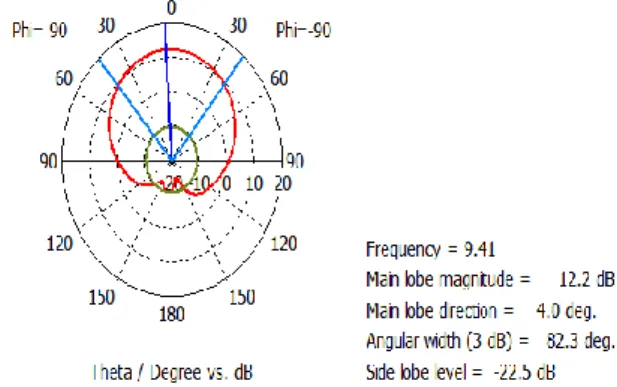
The next antenna design process is designing the antenna by adding the number of antennas known as microstrip arrays. The design starts using the array of microstrip 2×1element, 4×1element, 8×1element and 16×1 elements can be seen in the Figure 4 (a), (b), (c), (d). The design of antenna is done by arranging the antenna in series which aims to improve the efficiency of microstrip antenna [19]. The number of the left antenna is equal to the number of antennas on the right as seen in the above array antenna. Each of the above array antenna resulted return loss value, VSWR and different gain. Each addition of the number of elements and the gain obtained will increase. According to the antenna specifications in Table 1, the desired gain is ≥ 12 dB, in the microstrip 16 x 1 array antennas the gain element is in accordance with the specifications of 12.2 dB in Figure 5.
The gain difference of each antenna can be seen in Table 4. The return loss value obtained for each antenna is smaller than -10 dB and VSWR smaller than 2. With the addition of the antenna array number, the gain value will increase.
Figure 3. Single microstrip antenna (Left), electric Field Direction (Center) and Tangential Value (Right)
Figure 5. Simulation result of antenna gain of 16×1 elements microstrip array
TABLE 4
COMPARISON OF SINGLE MICROSTRIP ANTENNA WITH MICROSTRIP ARRAY ANTENNA
Antenna Type Return Loss VSWR Gain
Single microstrip -23.88 1.13 3.91 Array 2×1 -27.06 1.09 5.42 Array 4×1 -14.44 1.46 7.90 8×1 array (regular) -17.36 1.31 10.32 Array 8×1 (Mitered
band) -27.55 1.8 10.65
Array 16×1
(regular) -15.45 1.6 11.10 Array 16×1
(Mitered band) -14.3 1.4 12.20
Figure 6. The Value of the Axial Ratio of the 16x1 Element Array Antenna
Based on Table 4, it can be seen that the gain increases. In the 8×1 array antenna element using the mitered band method there was a gain increase of 0.33 dB [14]. The value of gain on an array 8×1 element antenna is 10.56 dB, this is not in accordance with the desired specifications. To increase gain, an antenna element is added to an array 16×1 elements. After simulating a 16×1 element microstrip array antenna, a gain of 12.20 dB is obtained, the gain value is in accordance with the desired antenna specifications.
Furthermore, this research focused on antenna array 16×1 elements. There are 2 types of antenna polarization: circular and linear polarization. The difference between the two polarizations is that if the axial ratio (AR) is 0 ≤ AR ≤ 40 dB, then it has circular polarization while linear polarization has AR ≥ 40 dB [20]. In Figure 6, it can be seen that the axial ratio value is AR ≥ 40 dB, so this antenna has linear polarization.
Figure 7 (above) shows the direction of the current from the antenna. Visible current direction parallel to the surface of the earth indicates that this antenna has horizontal polarization. While in Figure 7 (below) is the value of tangential electric field.
Figure 7. Flow direction (up) and electric field Tangential value (bottom) of array antenna microstrip16x1 element
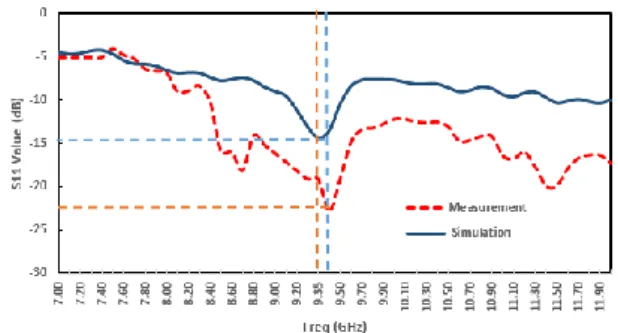
After the design of the antenna following the specification and the process of fabrication of the microstrip antenna array 16×1 elements, the results of its fabrication can be seen in Figure 8. Figure 8 (top) is a front-facing antenna and Figure 8 (bottom) is a rear one. The dimensions of the fabricated antenna are 30×300 mm with a thickness of 16 mm. Later, the antennas which have been fabricated is measured for testing the design results Measurement of return loss and VSWR was conducted by using VNA Agilent Technologies N5221A Network Analyzer with measurement capability from 10 MHz to 13.5 GHz. After measuring the antenna, we compare the measurement result and the simulation result of the reflection coefficient which can be seen in Figure 9. In Figure 9, the dotted red line is the result of the measurement and the blue color line is the simulation result. This Figure shows the difference in the value of the return loss, where the return loss value of the measurement results is lower than the simulation results. The lowest return loss value of the measurement -22.8 dB at a frequency of 9.4 GHz, for simulation results obtained value -14.3 dB at a frequency of 9.35 GHz. There was a 0.5 GHz shift in frequency for the lowest return loss however both the measurement results and the simulated return loss value is still smaller than -10 dB in accordance with the planned specifications.
The results of the comparison of VSWR measurements and simulations can be seen in Figure 10. The dotted red line shows the value of the measurement result and the blue line illustrates the simulation result. The VSWR value of the measurement results has a VSWR value smaller than the simulated value. VSWR value of measurement results have the lowest value at the frequency of 9.4 GHz with a value of 1.2 while for the simulation results the lowest VSWR value is at a frequency of 9.35 GHz with a value of 1.4. The results obtained by both measurement and simulation have VSWR ≤ 2 values at the frequency of 9.41 GHz according to the desired specification.
Figure 9. Comparison of Reflection Coefficient of Simulation Result with Measurement
Figure 10. Comparison of VSWR Simulation Results with Measurement
As for the measurement of antenna gain of microstrip 16×1 element array is carried out using another type of antenna as a reference. The reference antenna in [21] used in this measurement is a monopole antenna λ/4 whose gain is known. Comparison of values obtained from reference antennas with antenna array microstrip 16×1 elements, and then the gain value is obtained. The gain value of the measurement results is 13.21 dB. This value increases compared to the simulation results, where in the simulation, the gain value obtained is 12.2 dB. It is expected that the gain can increase the range of the power from the radar. This atmospheric precipitation monitoring radar can receive data as far as 40 km. It is under Furuno radar coverage that could reach 60 km. Because, the transmit power after 40 km is so weak, the range of this radar reaches only the nearest 40 km.
Many factors can affect the difference between the measurement and simulation results, such as the difference in the relative permittivity value of FR-4 Epoxy in the simulation and at the time of antenna fabrication. So it seems that there is a shift in reflection coefficient curve owned by this antenna. Besides, the soldering technique can also have an effect in antenna implementation. The imperfect antenna soldering technique can create a connector that does not adhere properly so that the measured results displayed are not optimum.
CONCLUSION
Microstrip array antenna is an antenna designed to be implemented on FURUNO 1932 MK-2 radar. For precipitation monitoring for the Bandung area. Microstrip array antenna designed with frequency 9.41 GHz, reflection coefficient value ≤ -10 dB, VSWR ≤ 2,
After performing the simulation by using CAD, microstrip array antenna 16×1 element is obtained by using mitered bend method until meets the desired specification. Later, the design was fabricated. After fabrication, it is measured to find out whether the design meets the requirements. It is found in the measurement results that there was a frequency shift of 0.5 KHz, from 9.35 GHz to 9.4 GHz according to the desired specifications. This can be seen from the reflection coefficient and VSWR graph. As for the gain, it gets better with a value of 13.21 dB. With the addition of this gain, the power radar can have maximum transmit power to receive precipitation data.
ACKNOWLEDGMENT
Authors wish to thank Prof. Chunaeni Latief who has helped in understanding microstrip antenna.
REFERENCES
[1] A. Awaludin, G. A. Nugroho, S. A. Rahayu, “Analisis kemampuan radar navigasi laut Furuno 1932 Mark-2 untuk pemantauan intensitas hujan,” Jurnal Sains Dirgantara, vol.10, no. 2, pp. 90-103, June, 2013.
[2] G. Ari, A. Awaludin, dan S. A. Rahayu, “Pemanfaatan noise radar kapal untuk pemantauan curah hujan wilayah local,” in Proc. Seminar Nasional Teknik Elektro Tahun 2012, Jakarta, 2012.
[3] C. A. Balanis, Antenna Theory: Analysis and Design, 3rd ed., New York: John Wiley and Sons, Inc., 2005.
[4] V.R. Anitha and S. N. Reddy, “Design of an 8X1 square
microstrip patch antenna array,” Int. J. Electron. Eng. Research, vol. 1, no. 1, pp. 71-77, 2009.
[5] C. A. Balanis, Modern Antenna Handbook, Canada: John Wiley & Sons, Inc., 2008.
[6] A. A. Qureshi, M. U. Afzal, T. Tauqeer, M. A. Tarar, “Performance analysis of FR-4 substrate for high frequency
microstrip antennas,” in Proc. 2011 China-Japan Joint Microwave Conference, China, 2011, pp 1-4.
[7] N. Nurfitriani, D.Arseno dan Y. Wahyu, “Pengaruh dimensi feeder terhadap antenna mikrostrip patch persegi untuk DBS Ku-Band,” in Proc. Seminar Nasional Inovasi dan Aplikasi Teknologi di Industri, Malang, 2018.
[8] Y. Huang, and K. Boyle, Antennas from Theory to Practice, UK: John Wiley & Sons, Ltd., 2008.
[9] M. Long, The Ku-Band Satellite Handbook, USA: H.W.Sams, 1986.
[10] P. Subbulakshmi and R. Rajkumar, “Design and characterization of corporate feed rectangular microstrip patch array antenna,” in Proc. 2013 IEEE Int. Conf. Emerging Trends Computing, Commun., India 2013.
[11] P. A. Nawale, and R.G. Zope, “Rectangular microstrip patch antenna for 2.4 GHz communication using defected ground structure,” Int. J. Advance Found. Research Comput., vol. 2, no. 1, Jan., 2015.
[12] S. A. Rahayu, L. Tursilowati dan J. Suryana, “Perancangan dan analisis polarisasi linier (horizontal dan vertikal) antena array microstrip 4 elemen pada X-Band radar,” in Pengembangan Teknologi Atmosfer dan Pemanfaatannya, Bandung: CV. Andira, 2015, pp. 1-15.
[13] R. J. P. Douville, D. S. James, “Experimental study of symmetric microstrip bends and their compensation,” IEEE Trans. Microw. Theory Tech., vol. 26, no. 3, pp. 175 – 182, 1978.
[14] E. H. Fooks, R. A. Zakarevicius, Microwave Engineering Using Microstrip Circuits, Australia, Prentice Hall, Inc., pp. 97-101, 1990.
[16] (2015) NWS Wilmington Ohio Dual Polarization Radar
Upgrade [Online]. Available:
http://www.erh.noaa.gov/iln/dualpol.php.
[17] F. Y. Kuo and R. B. Hwang, “High-isolation X-band marine radar antenna design,” IEEE Trans. Antennas Propag., vol. 62, no. 5, May, 2014.
[18] D. M. Pozar, D. H. Schaubert, Microstrip Antennas: The Analysis and Design of Microstrip Antennas and Arrays. NY: Willey- IEEE Pres., 1995.
[19] A. F. Alsager, “Design and analysis of microstrip patch antenna arrays,” M. S. Thesis, University College of Borås, Swedia, 2011.
[20] D. W. Dwiputro, “Desain dan implementasi susunan antena microstrip sebagai penerima bergerak siaran TV satelit pada pita Ku,” M. S. Thesis, Institut Teknologi Bandung, Indonesia, 2014.
![Figure 1. Microstrip Antenna Design Flow Diagram Antenna dimensions can be calculated mathematically by the following parameter values [10], [11]:](https://thumb-us.123doks.com/thumbv2/123dok_us/8094421.2144928/2.892.468.811.80.351/microstrip-antenna-diagram-dimensions-calculated-mathematically-following-parameter.webp)