672 | P a g e
Migration Dynamics: An Analysis of J&K
Ishfaq Ahmad Khoja
1, Naorem Pushparani Chanu
21
Research scholar, School of Economics, Central university of Hyderabad, Telangana Hyderabad
2Research scholar, institute of development studies, Salt Lake City Kolkata, West Bengal Kolkata
ABSTRACT
The primary mandate of current study has been to analyze the migration and its different aspects in case of
Jammu and Kashmir based on census 2001. So we have analysed migration from the aspects of pattern, stream,
composition and reason. It was found that intra-district migration is the main pattern of migration in state
followed mainly through the stream of rural-rural migration. The marriage has been a vibrant reason for both
intra-district and district migration while as the employment has been the main reason in case of
inter-state migration. Punjab, UP, HP and Bihar were found to be the major sources of in-migration for the inter-state of
Jammu and Kashmir. Substantial inter-division and inter-district variations have been documented in case of
in-migration between the three divisions of state with Jammu division receiving the highest over-all in-migrants.
Employment was found to be the main reason for the in-migration followed by the reason of marriage. It was
found that as the age group of in-migrated persons increase so does their educational standards. The
proportion of Marginal workers was found to be higher followed by non-workers. The major destinations for
out-migrants have been Punjab, Bihar, Delhi, Himachal and UP. Employment, Business and education scored
comparatively batter as reasons for out-migration for all states except Bihar in which case Marriage was found
to be significant. The proportion of out-migration was found to be of longer durations as compared to the
seasonal movement.
Key words: In-migration, out-migration, marriage, employment, business.
INTRODUCTION
Migration has become a global challenge especially on the advent of 21st century. The story of human
civilization, in other words, is a story of migration too, though with different magnitudes and motives. Migration
is a form of mobility in which people change their usual place of residential location across defined
administrative boundaries for a variety of reasons, which may be voluntary or involuntary, or a combination of
both. The decision on whether to migrate, how to migrate and where to migrate is a complex process and could
involves a variety of factors in different ways” (Srivastava, 2012). In the contemporary context, migration can
673 | P a g e
and b) international migration [movement from one country to another country]. Based on the particular
location, migration can be categorized as in-migration and out-migration.
Migration is influenced by various factors. Those favorable factors/conditions (better opportunities of
employment, education, health care services etc) in an external location “pull” people in and those unfavorable factors/conditions (poverty, social insecurity, ethnic conflict and political instability) in a place “push” people
out. Migration decision is thus a complex process. Migration is defined broadly as a permanent or semi
permanent change of residence. It has a place of origin and place of destination. The decision to migrate is the
result of the comparison between the attractive & repulsive factors of both the areas - Lee, 1966.
The case of Jammu and Kashmir has been a balanced mixture of all these forces over the time governing its
migration process. The Jammu and Kashmir under its native rulers have seen consistent progress and prosperity
and hence huge in-migration. But things saw a dramatic reversal following the partition of India into a Muslim
majority Pakistan and a Secular India, with its strong repercussions on the state of J&K. All these developments
along with the insurgency that erupted during 1990‟s took a very heavy toll on the migration scenario of the
state.
The present study has been executed to highlight the dynamics of migration for the state of Jammu and Kashmir
according to the census 2001. The main focus will be to highlight the different aspects of migration which
includes migrants from different states of the country as a well as out-migrants from the region to the rest of the
country. Though a comparative analysis could have better served the purposes, but unfortunately the data
regarding 2011 is yet to be updated and those of 1991 and 1981 are not available. The study will add up to the
already existing literature of migration in J&K, though quite insignificant.
PATTERN & STREAMS OF MIGRATION IN THE STATE:
The general pattern of migration in J& K is mainly dominated by intra-district migration followed by
inter-district migration and inter-state migration. The intra-inter-district migrants in the state according to Census 2001
were 91% while inter-district migrants were 17% & inter-state migrants were only 9% [see table 1]. It is quite
evident from the Census data that short-distance migration is prominent in the state as a whole. As can be
documented from the table 1, the inter-state migration is quite low as compared to other two ingredients. There
is a multitude of reasons for such a state of affairs. The consistent political instability, hostile terrain, rising
security concerns, separate citizenship laws and above all the insurgency of 1990‟s are some of the active
players for such a scenario.
There are generally four major stream of migration in India and they are: Rural-rural, Rural-Urban, Urban-rural
& Urban-urban migration. Each pattern of migration (intra-district, inter-district & inter-state) can be
acknowledged under the different streams of migration. We have tried to analyze the same in case of Jammu and
Kashmir. The highest inter-state in-migration has been in case of urban to urban followed by rural to urban. On
674 | P a g e
In case of intra-district migration, the relative importance of rural-rural migration is quite dominant. This is
followed by urban-urban migration, urban-rural and finally by rural-urban migration. In case of inter-district, the
prominence has been acquired by urban-urban followed by rural-rural, rural-urban and finally by urban-rural.
The similar case has been experienced in case of inter-state migration1. The urban-urban movement is on the top
of list followed by rural urban, rural-rural and urban-rural. A welcome development that can be taken notice
form table 1 is the proportion of female migrants in all the three patterns of migration. Though in case of intra
and inter-district migration these trends may be on part of marriages and all but in case of inter-state they may
exhibit a better scenario of work for the female populace.
Table 1: showing pattern of migration in J&K
Intra-district
Total Male Female
Rural-rural 84% 16% 84%
Rural-urban 16% 39% 61%
Urban-rural 33% 31% 69%
Urban-urban 67% 44% 56%
Inter-district
Total Male Female
Rural-rural 55% 35% 65%
Rural-urban 45% 53% 47%
Urban-rural 21% 42% 58%
Urban-urban 79% 49% 51%
Inter-state
Total Male Female
Rural-rural 35% 42% 58%
Rural-urban 65% 54% 46%
Urban-rural 24% 45% 55%
Urban-urban 76% 45% 55%
Source D2 table of migration, Census 200, compact disk
MAJOR STATES OF IN-MIGRANTS IN J&K
As in case of other states of Indian union, the state of Jammu and Kashmir has not been able to attract
significant amount of migrants from other states. The most in-migrating states in J&K are Punjab, Uttar Pradesh,
Chhattisgarh, Bihar and Himachal Pradesh. The first place as occupied by Punjab may be explained in terms of
1
675 | P a g e
least distance between Punjab and Jammu region of the state. Yet another reason may be in terms of much
common cultural and linguistic specificity of people of Jammu division with those of northern Punjab.
Table 2: showing the source of in-migration in J&K
Source: D1 table of migration, Census 2001, compact disk
Uttar Pradesh, Chhattisgarh and Bihar may be explained owing to the seasonal migration of a huge amount of
laborers especially barbers from Uttar Pradesh, manual laborers from Bihar and Chhattisgarh along with other
states.
In terms of the reception of these migrants from different states in different districts, the scenario is
found to be skewed in favor of better developed districts. From the state of HP, Anantanag and Leh have
received highest number of in-migrants. From the state of Punjab, Jammu division in particular and districts like
Kathua, Poonch and Jammu have received a huge proportion. From the state of Uttar Pradesh, it is Kashmir
division that has experienced a more dependence especially the districts of Badgam, Srinagar and Pulwama.
Similarly migrants from Bihar mostly prefer Kupwara as their favored place of destination. In case of
Chhattisgarh the move has been mainly towards Jammu division and its constituent districts. As can be seen
from the table 3, UP and Bihar have strongly contributed to the migration pool of Kashmir division. While as,
on an average, Punjab, Bihar and Chhattisgarh have made heavy contribution to the Jammu division. However,
in case of Ladakh the state of UP and Bihar have a substantial presence.
Table 3: District wise in-migration from various states
District wise
in-migrants
Himachal
Pradesh
Punjab Uttar Pradesh Bihar Chattisgarh
Jammu 5% 27% 11% 8% 13%
Srinagar 3% 9% 20% 12% 0%
Leh 14% 10% 16% 8% 0%
Pulwama 3% 6% 17% 9% 0%
Badgam 2% 6% 28% 13% 0%
Anantanang 16% 8% 16% 6% 0%
Kargil 4% 7% 17% 9% 0%
In-migrants in J&K Male Female
Punjab 27% 37% 63%
Uttar Pradesh 13% 62% 38%
Chhattisgarh 9% 57% 43%
Himachal Pradesh 6% 44% 56%
676 | P a g e
Doda 16% 19% 23% 12% 1%
Udampur 6% 18% 17% 10% 3%
Kupwara 0% 2% 8% 23% 6%
Baramulla 5% 21% 15% 5% 0%
Punch 5% 31% 12% 6% 8%
Rajouri 7% 15% 21% 6% 8%
Kathua 9% 54% 7% 8% 8%
Source: D1 table of migration, Census 2001, Compact disk
REASONS OF MIGRATION
The decision to migrate is always guided by the reason under-lying the same, so is the case in our present study.
However, the reasons of migration are not time, type and region invariant as they undergo changes with the
change in circumstances. Accordingly different reasons have been documented in present case differing along
the patterns and streams of migration. In case of Intra-district migration, „marriage‟, „moved after birth‟ and
„Other‟ reason were found to be the major incentives of migration. Employment or work related reason which is
considered to be one of the most important incentives of migration is found to be just 3%. This only shows that
people do not move district for work related reason. This may also explain the scenario of dominant
intra-district female migration as contextualized in the table 1 above.
In the case of inter-district migration, marriages were found to be the major driving forces of migration.
Education and business does not find any appreciable mention as they are almost non-existent in this case.
Moving to the inter-state migration, employment with 23 percent has been on the top as a galvanizing factor for
migration. The marriage with a score of 15 percent is indexed at second place as an incentive to carry on an
inter-state migration decision [see table 4].
Table 4: showing distribution of migrants according to purposes
Reason of migration Intra-district Inter-district Inter-state
Work/employment 3% 11% 23%
Business 0% 1% 1%
Education 1% 2% 1%
Marriage 44% 22% 15%
Moved after birth 44% 2% 1%
Moved with household 1% 2% 1%
Other 44% 41% 24%
Source: D3 table on migration, Census 2001, compact disk
So what we could establish from the above table is that female population has mostly dominated the case of
marriage related reason while as male population has dominated the case of employment related reason under
677 | P a g e
education as an incentivizing factor which was found to be just 1 percent in case of inter-state movement. One
reason for such a scenario may be that the trend as is prevalent right now in Jammu and Kashmir, especially
related to education induced inter-state migration might have been quite weak and insignificant in relation to
other factors in 2001.
As it has been discussed earlier the major in-migrating states in J&K are Punjab followed by Uttar Pradesh,
Bihar, Chhattisgarh and Himachal Pradesh. In case of Himachal Pradesh the dominant reasons have been
marriage (30%), followed by employment (14%) besides movement with household and others.
Table 5: relative distribution of reasons of in-migration
Reason of migration Himachal
Pradesh
Punjab Uttar Pradesh Bihar Chhattisgarh
Work/employment 14% 17% 23% 37% 49%
Business 2% 2% 1% 1% 0%
Education 1% 1% 1% 1% 0%
Marriage 30% 37% 4% 5% 3%
Moved after Birth 1% 1% 1% 1% 1%
Moved with HH 26% 27% 42% 33% 33%
Others 26% 16% 18% 28% 14%
Source: D3 table of migration, Census, 2001, compact disk
People from Punjab have mainly migrated to the state for marriage related reason followed by „moved along
with household‟ and „employment‟ related reason. In case of Uttar Pradesh 42% of the migrants move along
with the household followed by „employment‟ related reason. It may be worth noting that „moved along with
household‟ mean migrants who move along with the earning member of the household. This may include
children, siblings, housewife and parents etc. In the case of Bihar, 23% of the migrants have work or
employment related reason followed by „moved along with household‟. In case of Chhattisgarh 49% of the
migrants have migrated for work or employment related reason.
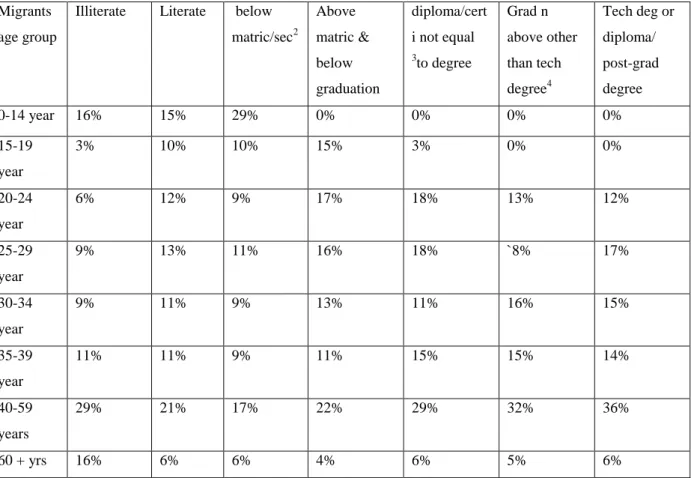
MIGRANT PROFILE OF IN-MIGRANTS IN J& K
As can be seen from the table 6 a vast majority of in-migrants in the state of Jammu and Kashmir are
either illiterate or they are below the matriculation. However as the age group increases so does the level of
education increases as can be seen from the age group of 35-39 and 40-59 where in we have more
678 | P a g e
Table 6: distribution of literacy profile of in-migrants in J& K
Migrants
age group
Illiterate Literate below
matric/sec2 Above matric & below graduation diploma/cert
i not equal
3to degree
Grad n
above other
than tech
degree4
Tech deg or
diploma/
post-grad
degree
0-14 year 16% 15% 29% 0% 0% 0% 0%
15-19
year
3% 10% 10% 15% 3% 0% 0%
20-24
year
6% 12% 9% 17% 18% 13% 12%
25-29
year
9% 13% 11% 16% 18% `8% 17%
30-34
year
9% 11% 9% 13% 11% 16% 15%
35-39
year
11% 11% 9% 11% 15% 15% 14%
40-59
years
29% 21% 17% 22% 29% 32% 36%
60 + yrs 16% 6% 6% 4% 6% 5% 6%
Source: D4 table of migration, Census 2001, compact disk
In case of reasons of migration and the corresponding age groups, the employment /work along with
business and education seem to be quite neutral.
Table 7: distribution of age profile of the in-migrants and their reason of migration
Ages of the
in-migrants
Reason of migration for the in-migrants from the rest of the country to J&k
Work/empl Business Education Marriage Moved
after birth
Moved with
HH
Others
0-14 0% 0% 1% 0% 5% 26% 67%
15-19 4% 0% 4% 8% 2% 19% 62%
20-24 8% 0% 2% 37% 1% 12% 40%
25-29 8% 1% 1% 50% 0% 10% 31%
2
Below and secondary level of education 3
Diploma/certificate which is not equal to degree course
679 | P a g e
30-34 8% 1% 0% 52% 0% 9% 30%
35-39 8% 1% 0% 51% 0% 9% 31%
40-59 8% 1% 0% 47% 0% 8% 35%
60-79 4% 1% 0% 45% 0% 10% 39%
80+ 4% 1% 0% 44% 0% 13% 39%
Source: D5 table of migration, Census 2001, compact disk
However in case of marriage, as the age groups increase so does the in-migration induced by marriages increase.
In case of movement induced by movement of household is concerned, it decreases with the increase in the age
group and hence supports the hypothesis of increasing age means lesser dependence.
As for as age profile and economic activity of in-migrants is concerned, both the main workers and
marginal workers have experienced an increase with the increasing age group up-to 59 year. However the
non-workers have shown a negative correlation with the growing age profile as can be better seen from the table 8
below.
Table 8: distribution of age profile and economic activity of the in-migrants in J&K
Ages of the migrants Main workers Marginal workers Non workers
0-14 1% 3% 26%
15-19 4% 5% 8%
20-24 9% 11% 8%
25-29 12% 14% 8%
30-34 13% 14% 9%
35-39 15% 14% 8%
40-59 37% 30% 19%
60+ 9% 8% 13%
Source: D6 table of migration, Census 2001, compact disk
Out-Migration from Jammu & Kashmir
According to Census 2001, the total number of in-migrants from the rest of the country was 224,891 while as
the total number of out-migrants from the entire J&K was 249,450 which is slightly higher than the
in-migration. People of the state mostly prefer to migrate in states like Punjab, Bihar, Delhi, Himachal Pradesh,
Maharashtra, Uttar Pradesh and Haryana in sequential order of importance. From the table 9 we can see that the
number of female out-migrants in case of Punjab and Bihar are quite substantial. On the other hand, for the
680 | P a g e
Table 9: Percentage distribution of out-migrants of J& K in major place of destination
Place of destination Total out-migrants Total male -migrants Total female migrants
Punjab 20% 33% 67%
Bihar 18% 12% 88%
Delhi 16% 52% 48%
Himachal Pradesh 6% 63% 37%
Maharashtra 6% 59% 41%
Uttar Pradesh 5% 53% 47%
Source: D2 table of migration, census 2001, compact disk
Given such a scenario it is further necessary to investigate about the reason of out-migration that is taking place
from the state in particular. Census 2001 has observed seven major reason of migration that includes:
Work/employment, business, education, marriage, moved after Birth, moved along with household and reasons
that falls under ‟others‟ category. „Moved after birth‟ has been newly inserted as a reason of migration in 2001 census by omitting „natural calamities‟ as a reason of migration in 1991 census.
Table 10: showing out-migration along various reasons to different state
Place of destination Work/em
p
Busines
s
Edu Marriage Moved after
birth
Moved
with HH
Other
Punjab 14% 1% 1% 43% 2% 23% 17%
Bihar 1% 0% 0% 85% 0% 4% 10%
Delhi 21% 21% 2% 11% 2% 42% 20%
Maharashtra 26% 1% 11% 8% 3% 35% 15%
Uttar Pradesh 17% 1% 10% 10% 1% 42% 20%
Himachal Pradesh 38% 2% 4% 18% 2% 19% 17%
Source: D3 table of migration, census 2001, compact disk
As can be seen that out-migration with the employment purposes has been highest to HP followed by
Maharashtra, Delhi and UP. Similarly for the purposes of business, the state of Delhi has received a major chunk
of out-migration from the state according to census 1991. For the purposes of education Maharashtra and UP
have been prominent followed by other states. In case of marriage Bihar and Punjab have been the fore-runners
followed by Delhi and other states. Movement along with family has been highest to Delhi followed by
Maharashtra and UP.
In case of Punjab one can see as the age group increases so does the duration of stay implying positive
association. Similar case has been experienced in all other states except the state of Himachal Pradesh. The case
681 | P a g e
Table 12: Duration of stay of the out-migrants
Place of destination Duration of residence at the place of destination
>1 year 1-4 year 5-9 year 10-19 year 20+ year
Punjab 6% 24% 14% 20% 24%
Bihar 1% 15% 14% 26% 36%
Delhi 5% 22% 16% 30% 21%
Maharashtra 9% 41% 12% 16% 15%
Uttar Pradesh 7% 43% 15% 14% 9%
Himachal Pradesh 18% 27% 14% 17% 17%
Source: D2 table of migration, 2001 census, compact disk
From the table we can also infer that the kind of out-migration that is being taking place from the state is rather
permanent in nature. On an average the out-migrants from the state stays for 1-4 years at the various place of
destination for various reasons. Given the socio-economic and political scenario of the state of J&K,
Out-migrants from the state prefer less to return back.
CONCLUSION:
The study has been executed with the prime focus to analyze various dynamics of migration in Jammu
and Kashmir according to the census of 2001. The main thrust of the study has been on the areas of pattern,
stream, and composition, along with age and literacy profiles of both in-migrants and out-migrants. In the
present study we were able to document that Jammu and Kashmir exhibits a weak scenario of both in-migration
and out-migration when compared to other states of Indian union.
So far as the migration within the state is concerned, it is heavily dominated by the intra-district
migration followed by inter-district migration. It was further found that a vast proportion of intra-district
migration takes place for the purposes of marriage. This was the reason for a very heavy proportion of female
population comprising the intra-district migration. Though similar trends were observed in case of inter-district
migration but the intensity of female component was not so severe. So far as the case of inter-state migration is
concerned, it was dominated by male migration with a primary purpose of employment or work. In over-all
scenario, it was the rural-rural migration that was more prevalent in the state of Jammu and Kashmir according
to census 2001.
The major in-migrating states were: Punjab, UP, Chhattisgarh, HP followed by Bihar ranked in line of
their proportion. The in-migration from these states was found to have mainly influenced by distance, ethnicity,
culture and religion. Except for UP, a major proportion of in-migrants from other states have mainly migrated to
Jammu division. The work or employment has been the major incentivizing factor for in-migration in Jammu
and Kashmir from all the cited states. The majority of in-migratory persons were found to be with low
682 | P a g e
found to have better literacy ratios as compared to the lower strata. The proportion of Marginal workers was
found to be higher followed by non workers thus authenticating the fact that a vast amount of in-migration has
been in the form of movement of house-hold.
The number of out-migrants from the state of Jammu and Kashmir was found to be slightly higher than
number of in-migrants. The major destinations for out-migrants have been Punjab, Bihar, Delhi, Himachal
Pradesh and Uttar Pradesh ranked in order of preference. Employment, Business and education scored
comparatively better as reasons of out-migration to the above cited states except Bihar in which case Marriage
was found to be significant. Moreover the out-migration from the state was found to be of a permanent type and
not a seasonal movement as the case might have been anticipated.
REFERENCES
Srivastava, R. "Internal Migration in India: An Overview of its Features." Trends and Policy (2011).
Bhagat, Ram B. "Internal migration in India: Are the underclass more mobile." Migration, identity and conflict:
India migration report (2011).
Banal, Rakesh, Jagdish Thappa, H. U. Shah, Arshid Hussain, Abhishek Chowhan, Harneet Kaur, Mala Bharti,
and Sushant Thappa. "Psychiatric morbidity in adult Kashmiri migrants living in a migrant camp at
Jammu." Indian journal of psychiatry 52, no. 2 (2010): 154.
Dabla, Bashir A. Sociological Implications of Pandit Migration in Jammu and Kashmir. Jay Kay Book Shop,
2008.
Harris, John R., and Michael P. Todaro. "Migration, unemployment and development: a two-sector
analysis." The American economic review 60, no. 1 (1970): 126-142.
Hicks, John Richard. Value and Capital: An Inquiry Into Some Fundamental Principles of Economic
Theory.[Mit Schaubildern und Einem Mathematischen Anhang]. Clarendon Press, 1939.
Katz, Eliakim, and Oded Stark. "Labor migration and risk aversion in less developed c Katz, Eliakim, and Oded
Stark. "Labor migration and risk aversion in less developed countries." Journal of labor Economics 4, no. 1
(1986): 134-149.
Lauby, Jennifer, and Oded Stark. "Individual migration as a family strategy: Young women in the
Philippines." Population studies 42, no. 3 (1988): 473-486.
Lee, Everett S. "A theory of migration." Demography 3, no. 1 (1966): 47-57.
Lewis, W. Arthur. "Economic development with unlimited supplies of labour." The manchester school 22, no. 2
(1954): 139-191.
MacDonald, John S., and Leatrice D. MacDonald. "Chain migration ethnic neighborhood formation and social
networks." The Milbank Memorial Fund Quarterly 42, no. 1 (1964): 82-97.
Majumder, Rajarshi. "Workers on the move: migrated labour in post-reform india." (2012).