MORPHOLOGICAL QUANTIFICATION OF AORTIC CALCIFICATION
FROM LOW MAGNIFICATION IMAGES
J
ESUS´
A
NGULO1,T
HAON
GUYEN-K
HOA2,Z
IADA. M
ASSY2,T
ILMAND
RUEKE¨
2ANDJ
EANS
ERRA11Centre de Morphologie Math´ematique, Ecole des Mines de Paris, 35, rue Saint-Honor´e, 77305 Fontainebleau,
France,2Laboratoire INSERM U 507, Hˆopital Necker, 161, rue de S`evres, 75015 Paris, France e-mail: angulo,serra @cmm.ensmp.fr,[email protected]
(Accepted May 14, 2003)
ABSTRACT
Atherosclerotic and medial vascular calcifications are frequent in chronic renal failure patiens and predict their increased cardiovascular mortality. Experimental models for mice have been recently developed in order to study these disorders. The aim of this paper is to present the morphological image processing algorithms developed for the semi-automated measurement of calcification from sections of aorta stained using von Kossa’s silver nitrate procedure and acquired at low magnification power ( 25) on colour images. The approach is separated into two sequential phases. First, the segmentation is aimed to extract the calcification structures and on the other hand to demarcate the region of the atherosclerotic lesion within the tissue. The segmentation yields the image data which is the input to the second phase, the quantification. Calcified structures are measured inside and outside the lesion using a granulometric curve which allows the calculation of statistical parameters of size. The same operator computes the shape of the lesion. The relative proportion of the area of calcification is also calculated respectively for the atherosclerotic lesion area and the area outside such lesions. In conclusion, the here developed method allows quantification of vascular calcified deposits in mouse aorta. This method will be useful for the quantitative assessment of pathological vascular changes in animals and man.
Keywords: aortic calcification, automation in bioimaging, low magnification histology, mathematical morphology, nephrology, quantitative image analysis.
INTRODUCTION
Atherosclerotic and medial vascular calcifications are frequent in chronic renal failure patients and predict their increased cardiovascular mortality. Experimental models for mice have been proposed in order to study these disorders (Muntzel et al., 2002). The detection of coronary artery calcium, using mainly fluoroscopy, has been shown to be of value in predicting artery disease (Margolis et al., 1980; Reinmuller and Lipton, 1987; Tanenbaum et
al., 1989). Recently, electron beam tomography has
been introduced for the detection of coronary calcium (Agatston et al., 1990; Morgan-Hughes et al., 2002).
The purpose of the present work is to propose an image-based method of quantification for the uremia-enhanced vascular calcification in the aortic root, which allows the evaluation of previously established biological models.
The images were derived from thin sections of aortic tissue. The aim is the extraction and quantification of calcification deposits. Confirmation of the presence of calcification is provided by staining using von Kossa’s silver nitrate method which is
widely used for detection of calcification (Lardenoye
et al., 2002).
In previous studies, mathematical morphology has shown its ability for solving bioimaging problems from low magnification power images in haematological cytology (Angulo and Flandrin, 2003). Such morphological approaches have also been applied successfully to other issues in nephrology (Moreso et al., 1994; Seron et al., 1996).
MATERIALS AND METHODS
STAINED AORTIC LOW MAGNIFICATION IMAGE
two weeks later. After sacrifice, the aortic arch was cut into serial sections in a cryostat. Sections were stained with von Kossa’s silver nitrate method. The animals were treated according to the recommendations of animal care committees, under anesthesia (Protocol: short term anesthesia of a duration of 30-40 min; one IP injection composed of 75µl Rompun 2% in 25 ml vial, 300 µl Ketamine CLORKETAM 1000 in 10 ml vial, 1.53 ml 0.09% NaCl; the amount of the anesthetic fluid administered 100 120µl / 20 g body weight).
Figure 1. Images under two magnification powers
(
25 and
10) of a section of the aortic sinus showing the elements of interest: tissue, atherosclerotic lesion and calcification structures.
In Fig. 1 are depicted two colour images under two magnification powers (
25 and
10) of a section of the aortic sinus showing the elements of interest: tissue, atherosclerotic lesion and calcification structures. In this study, the series of colour images were acquired under very low magnification power at
25. The main advantage is that in one image field all
the tissue to be examined is included; however there is a considerable drawback since the quality of the structures is mediocre. Therefore the automation of the segmentation and quantification procedures involves the development of specific algorithms using advanced techniques of image analysis. This is the rationale behind the use of mathematical morphology operators. As one can see from Fig. 1, other alternatives are possible. For instance, working at the magnification power of
10 and using a motorized microscope is an alternative to acquire several subimages to cover the whole area of interest. This approach has however serious drawbacks including definition of lesion at
10, extraction of the whole calcification region and merger of quantified data (overlapping of images).
The size of the image is 672
538 pixels on a rectangular raster with 256 grey tone levels for each red, green and blue colour channels. We consider for quantification that at
25 magnification and for the
resolution used, the size of a pixel is 55µm
2
pixel.
(a)
(b)
(c)
(d)
(e)
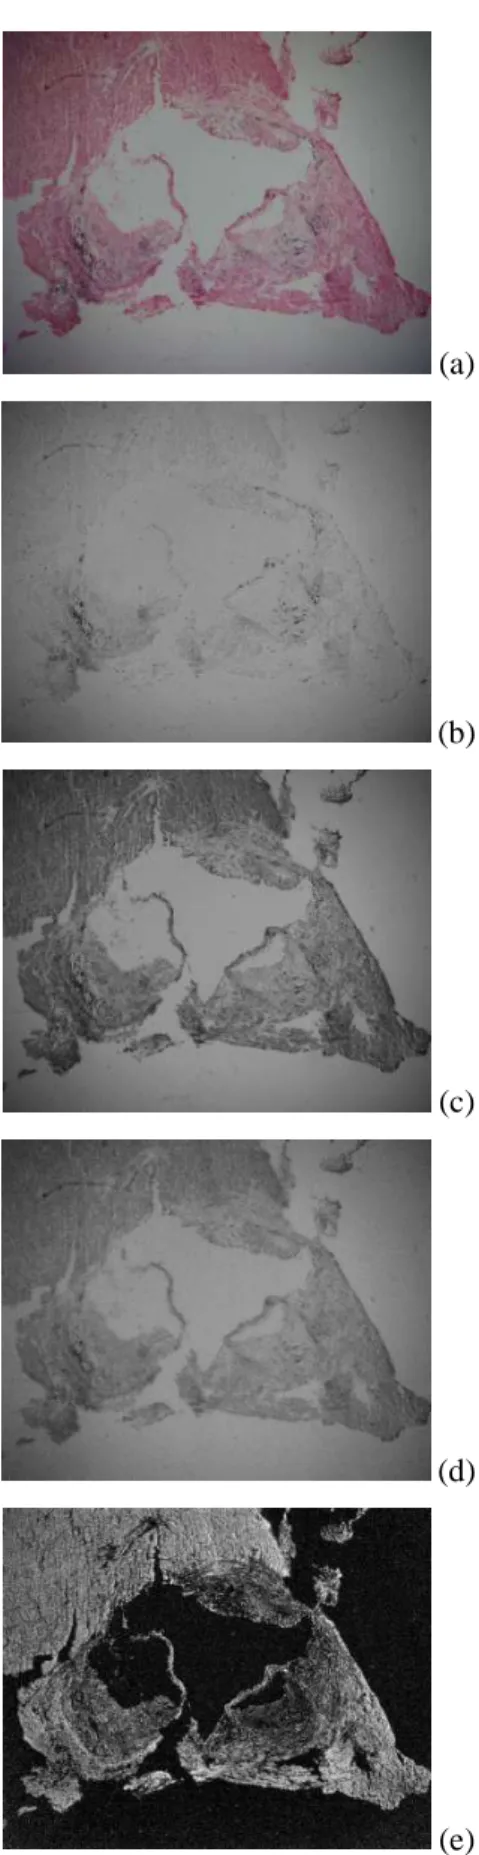
Figure 2. Example of microscopic field image from a
section of aorta stained using the von Kossa method
at low magnification power (
25): (a) RGB colour
image fRGB, (b) red component fR, (c) green component
fG, (d) blue component fB, (e) saturation component
Fig. 2 is an example of colour image to be processed, fRGB. The red fR, green fG and blue
fB colour component images are shown and beside
this, the saturation component fS of a 3D-polar
coordinate colour representation (Hanbury and Serra, 2002). For a colour pixel c
rgb ; i.e. fRGB
c
fR
c fG
c fB
c the saturation coordinate fS
c is
obtained by the simple expression
fS
c max
rgb min
rgb (1)
Using the spectral properties of the staining procedure on the tissues (calcifications appear black and tissues red-pink), we use the colour component images in the following way:
– The calcification is relatively more contrasted against the rest of tissues in fR, therefore this
component is used for extracting the calcifications.
– In order to detect the tissue in the field image the simplest means is to take fS where the biological
structures are clearly defined, despite the shading effect (non-uniform illumination).
– For segmenting the region of the atherosclerotic lesion a combined method of thresholding and manual interaction is achieved from fG.
Through this choice of the colour components, the color shading effect is negligible. Anyway, a method for shading correction of color images (Tomaˇzeviˇc et al., 2002; Derganc et al., 2003) can be used in applications with important multispectral inhomogeneities.
MORPHOLOGICAL IMAGE PROCESSING AND QUANTIFICATION
First introduced as a shape-based tool for binary images, mathematical morphology has become a very powerful nonlinear image analysis technique with operators capable of handling sophisticated image processing tasks in binary, grey-scale, colour and multiresolution imaging modalities. A tutorial in the technique can be found in (Serra, 1982, 1988; Coster and Chermant, 1989). In this section we briefly review the basic morphological operators used in this work.
In the framework of digital grids, a grey-tone
image can be represented by a function f : Df T ,
where Df is a subset of Z2and T tmin tmax is an
ordered set of grey-levels. Let B be a subset of Z2and
s N a scaling factor. sB is called structuring element
(shape probe) B of size s. The basic morphological operators are
– Dilation:δB
f
x sup
y B f
x y
– Erosion:εB
f
x inf y
B f
x y
The two elementary operations of erosion and dilation can be composed together to yield a new set of operators having desirable feature extractor properties which are given by
– Opening:γB
f δB
εB
f
– Closing:ϕB
f εB
δB
f
The morphological openings (closings) filter out light (dark) structures from the images according to the predefined size and shape criterion of the structuring element.
The top-hat transformation is a powerful operator which permits the detection of contrasted objects on non-uniform backgrounds (Meyer, 1977). There are two versions,
– White top-hat: The residue of the initial image f and an openingγ
f ; i.e.ρ
f f γ
f , extracts
bright structures.
– Black top-hat: The residue of a closingϕ
f and
the initial image f ;ρ
f ϕ
f f , extracts dark
structures.
Usually, the top-hat is accompanied by a thesholding operation, in order to binarise the extracted structures.
A granulometry is the study of the size distributions of the objects of an image. Formally, a
granulometry can be defined as a family of openings
Γ
γn n
0such that
n 0 m 0γnγm γmγn
γmaxnm. Moreover, granulometries by closings (or
anti-granulometry) can also be defined as families
of increasing closings Φ
ϕn n
0. Performing the
granulometric analysis of an image f with Γ is equivalent to mapping each opening of size n with a measure
γn
f of the opened image.
f is
the area of f in the binary case (number of pixels) and the volume in the grey scale case (sum of pixel values). The size distribution or pattern spectrum of
f with respect toΓ, denoted PSΓ
f is defined as the
following (normalised) mapping
PSΓ
fn PS
fn
γn f
γn! 1
f
m
f
n 0 (2)
The pattern spectrum PSΓ
f maps each size n to
some measure of the bright image structures with this size (loss of bright image structures between two successive openings). The pattern spectrum PSΓ
fn
scale. It is also possible to use standard probabilistic definitions to compute the moments of PS. The first moment µ is given by µ µ1 ∑
nnPS
fn , the
k-th pattern spectrum moment, k 2, is computed
as µk ∑n
n µ
kPS
fn . In particular, the first
four moments: meanµ, varianceµ2, skewnessµ3and
kurtosisµ4are often used.
Using a pair of an opening γ and a closingϕ as primitives, an operator of contrast enhancement can be obtained (Serra, 1989). This toggle mapping or two states contrastκis generated by the following criterion applied to each point x,
κ f x γ f
x if
ϕ
f
x f
x f
x γ
f x ϕ f
x if
ϕ
f
x f
x f
x γ
f x f
x if
ϕ
f
x f
x f
x γ
f
x
(3) The closing and the opening may be replaced by a dilation and an erosion of f .
A morphological tool that complements the opening and closing operators for feature extraction (extract the marked particles) is the morphological reconstruction, implemented using the geodesic dilation operator based on restricting the iterative
dilation of a function marker f by B to a function mask g,δn
g
f δ
1
gδn
1
g
f , whereδ
1
g
f δB
f g.
The reconstruction by dilation is defined by
γrec
g f δ
i g
f (4)
such thatδgi
f δ
i! 1
g
f (idempotence).
The thresholding transformation of the image f between the grey levels u1and u2 (typically u1 tmin
or u2 tmax), T
u1u2
f , yields the binary image I such
that for each pixel x the binary value is given by
I
x Tu
1u2
f
x
1 u1 f
x u2
0 otherwise (5)
The choice of u1
u2 determines the set of grey
levels associated with the object of interest. The histogram summarises the grey-level contents of an image and typically, the optimal threshold values can be obtained from an analysis of the histogram, see in (Angulo and Flandrin, 2003) the method of automated thresholding which combines the classical selection of the threshold value by minimising the sum of within class variances with a morphological technique for selecting the central mode values which speeds up
the convergence to the u’s. An alternative to make the choice of u1
u2 easier is a method which relies
on a double thresholding combined with a geodesic reconstruction; the technique is known as thresholding
by hysteresis (Soille, 1999). For instance, in order
to extract light structures we have to take u2 tmax
and let uTlow be a low threshold value and uThigh be a
high threshold value. Using this double threshold, two binary images are obtained: Iwide Tu
Tlowtmax
f and
Inarrow Tu Thightmax
f. The final binary image is given
by the reconstruction of Iwideusing Inarrowas a marker;
i.e.
I Thystu Tlow
uThightmax
f γ
rec
InarrowIwide (6)
ALGORITHMS
The approach is separated into two sequential phases. First, the segmentation is aimed on the one hand to extract the calcium structures and on the other hand to demarcate the region of the lesion on the tissue. The segmentation yields the image data which are the input to the second phase, the quantification. The calcification structures are measured inside and outside the lesion using a granulometric curve which allows to calculate some statistical parameters of size. The same operator is used to compute the shape of the lesion. The relative proportion of area of calcification is also calculated.
Detection of tissue in the field image
We start by binarising the saturation component fS
for detecting the tissue presented in the field image by using a simple thresholding operation at uT1 (a low
value; e.g. uT1 10, has shown to be suitable for this
kind of images), see Fig. 3(a),
Is Tu T1tmax
fS (7)
In order to remove the noise and mistakes due to the small pieces of tissue (histology artefact), the image is then filtered by applying a reconstruction using an opening as the marker,
Itissue γrec
γs1B
IsIs (8)
with s1such that s1B is larger than the size of the noise
and the small artefact pieces of tissue (good results were obtained with s1 5); the structuring element B
(a)
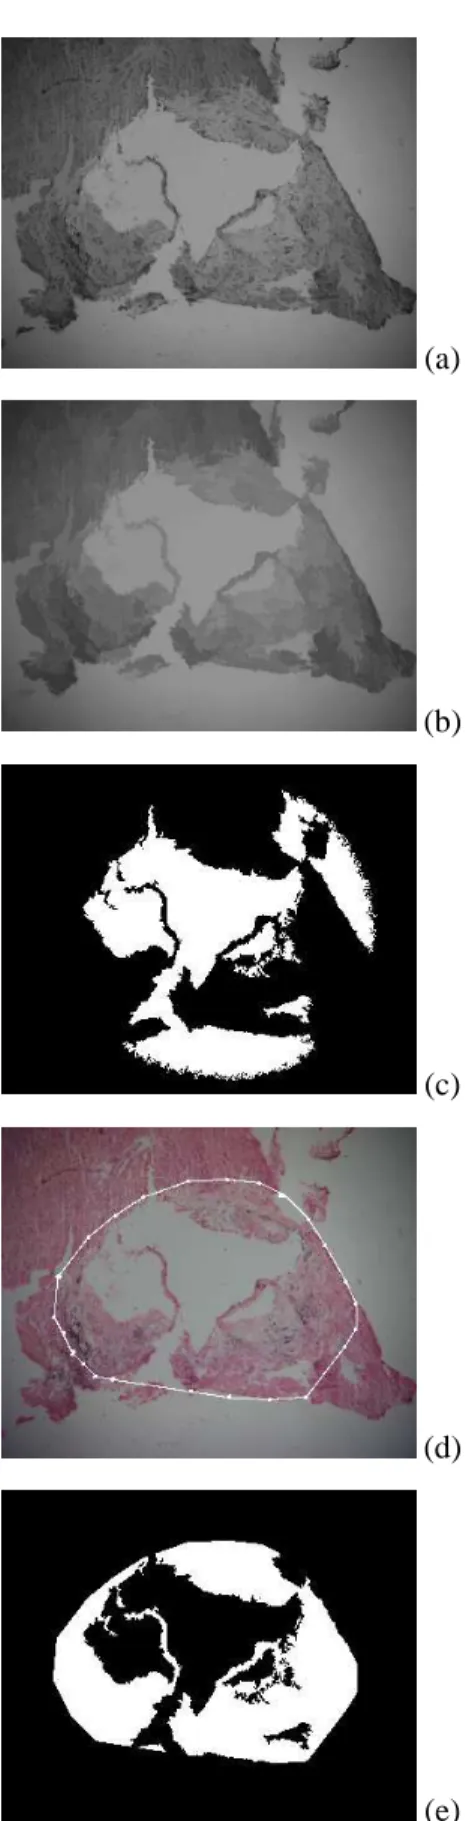
(b) Figure 3. Detection of tissue in the field image:
(a) Binary image after thresholding saturation component, Is; (b) cleaned binary mask of tissue, Itissue.
Interactive segmentation of the region of atherosclerotic lesion
In the tissue, the atherosclerotic lesion zone squares with a texture of tissue less thick than the rest, recognising visually, but its precise morphological definition is almost impossible. Therefore due to the fact that the automated segmentation of the lesion on the tissue can not be achieved without some mistakes and in order to avoid the propagation of these errors to the quantification step, we preferred to developed an interactive approach.
In a first step the human expert must perform a manual dot-marking of the region of interest (ROI) using the computer mouse on the colour image. This zone associated to the lesion has to be closed, see Fig. 4(d), but it is possible for the human user to demarcate several closed partial ROI’s: the definitive ROI is the union of the partial ones and is represented by the binary image Imrk.
The automated step works on the green component
fG. This image is simplified by means of an opening by
reconstruction (which simplifies the light structures),
fG γ
rec
γs2B
fG fG (9)
(a)
(b)
(c)
(d)
(e)
Figure 4. Interactive segmentation of the region of
lesion: (a) Simplified green component using an
opening by reconstruction, fG; (b) followed by closing
by reconstruction, fG; (c) negative of the binary
mask without empty image zones, Ig; (d) manual
dot-marking region of interest, Imrk; (e) binary mask of
followed by a closing by reconstruction (which simplifies the dark structures),
fG ϕrec
ϕs3B
fG f
G (10)
where the sizes of the opening and the closing have been empirically fixed to s2 15 and s3
10 respectively (B is a circle). The corresponding example of tissue image after simplification is shown in Fig. 4(a)-(b). The image fG must be binarised for extracting the empty zones (zones of the field without tissue); the optimal threshold value uT2 for each image
is obtained by the algorithm presented in Angulo (02). The result of this thresholding process at uT2,
Ig Tt minu
T2
fG (11)
is a first binary mask which is then restricted to the manual defined Imrk to obtain the binary mask of the
region of lesion,
Ilesion Imrk Ig (12)
See the result in Fig. 4(e).
Extraction of calcification
In the red component of the aortic section colour image fRthe calcium appears as dark structures upon
a bright background. In order to enhance the contrast of the calcifications against the background a toggle mapping is taken,
fR κ
fR (13)
where the two primitives of κ are an erosion and a dilation of size 3, see Fig. 5(a). From this image, a black top-hat of size s4 extracts the calcification
(s4 corresponds to the size of the biggest calcium
structures which can be found); experimentally we have fixed s4 25 with a circular structuring element,
fc ρ
fR (14)
On the image fc, Fig. 5(b), a thresholding by
hysteresis is performed to provided the binary mask of calcifications (see Fig. 5(c)),
Icalci f Thystu Tlow
uThightmax
f ; (15)
the choice of the threshold values is not so critical (the top-hat facilitates just the thresholding); e.g. uTlow 50
and uThigh 70.
(a)
(b)
(c) Figure 5. Extraction of calcification: (a) Contrast
enhancement of calcification on red component, fR; (b)
extracted calcification by means of a dual top-hat, fc;
(c) binary mask of calcification after thresholding by hysteresis, Icalci f.
Quantification of atherosclerotic lesion
Let
I be the surface area; i.e. number of pixel
to ones, of the binary image I. We start by calculating the size of the tissue and the lesion regions,
Atissue
Itissue Alesion
Ilesion (16)
We propose to characterise the shape of the lesion region by means of a pattern spectrum curve,
PS
Ilesionn PSlesion. The structuring elements are
circles of increasing size n 2 (in fact, the practical
peak corresponds to the thickness of a sector of the wall. These histograms of shape can be parametrised by using their statistical moments. The surface area in pixels of an octagon of size n is given by the formula (Serra, 1982), Noctagon 7n2 4n 1. In order to
obtain the sizes in µm2 we have to multiply the area
in pixels by 55µm
2
pixel for all the measurements.
Quantification of calcification
In order to quantify the calcium, we compute first the absolute and the relative surface of calcifications inside and outside the lesion,
Acalci f i
Icalci f Ilesion
Acalci f o
Icalci f
Itissue Ilesion (17)
Acalci f i
Acalci f i
Ilesion
(18)
Acalci f o
Acalci f o
Itissue Ilesion
(19)
Besides these parameters, the calcification structures inside the lesion are quantified by using a size distribution, PS
Icalci f Ilesionn PScalci f i (the
structuring elements of openings are again circles of increasing size n 2, from n 3 to n 23) and its
moments.
RESULTS AND DISCUSSION
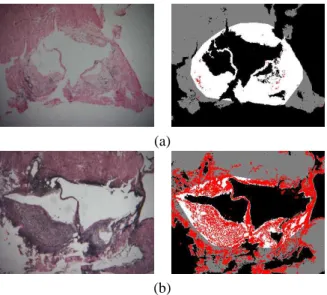
In Fig. 6 two examples of segmented aortic section images are depicted: one corresponding to a mouse with low calcification content (control mouse) and another to high calcification (uremic mouse). In Fig. 7 their associated pattern spectra are shown.
In Table 1 the obtained parameters of the lesion are included. For mouse 35 the area of lesion is larger than for mouse 40, but above all, the thickness of the walls is considerably greater. Besides being used for determining the relative amount of calcium located inside, the size of the atherosclerotic lesion may be significant a priori. However, due to the fact that during the tissue preparation procedure the shape of the atherosclerotic lesion may be modified involuntarily, the practical usefulness of the parameters from PSlesion remains doubtful. Other techniques of
tissue preparation could be envisaged in order to achieve more reproducible sections in such a way that the parameters associated to PSlesion will be very
important.
(a)
(b)
Figure 6. Two examples of aortic section images:
(a) with low calcification content (mouse 35); (b) riches in calcification (mouse 40). On the left, the initial images and on the right, summary of segmented structures: the background in black, the tissue in gray, the lesion in white and the calcification in red.
0 10 20 30 40 50 60 70 0
0.02 0.04 0.06 0.08 0.1 0.12 0.14 0.16
n (size of opening)
Normalised size (area)
Pattern spectrum of lesion
Mouse 35 Mouse 40
(a)
2 4 6 8 10 12 14 16 18 20 22 0
0.1 0.2 0.3 0.4 0.5 0.6 0.7 0.8
Size distribution of calcification
n (size of opening)
Normalised size (area)
Mouse 35 Mouse 40
(b)
Figure 7. Quantification of size and shape using
Table 1. Size (Atissue and Alesion) and shape (first four moments of PSlesion) parameters of lesion zone for the
examples of Fig. 6.
Atissue Alesion µ µ2 µ3 µ4
Mouse 35 120859 59079 38.55 293.03 -1176.89 208019.51 Mouse 40 160483 78696 51.17 647.21 -206.51 720299.94
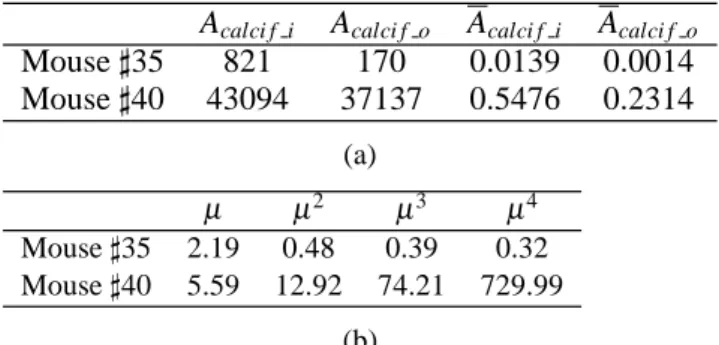
Regarding the parameters of calcification, summarised in Table 2, the use of this set of parameters yields an easy way to identify the different levels of calcification. Obviously, the most interesting parameters are the relative surfaces of calcification and the two first moments of size distribution: the mean size of calcium structures and the variance of size (which gives an idea of size dispersion and is helpful for distinguishing large compact calcifications from large disintegrated calcifications).
Table 2. Surface area parameters and first four
moments of PScalci f i of lesion zone for the examples
of Fig. 6.
Acalci f i Acalci f o Acalci f i Acalci f o
Mouse 35 821 170 0.0139 0.0014 Mouse 40 43094 37137 0.5476 0.2314
(a)
µ µ2 µ3 µ4
Mouse 35 2.19 0.48 0.39 0.32 Mouse 40 5.59 12.92 74.21 729.99
(b)
The robustness of an algorithm can be defined with respect to changes in the parameters or to image quality. The present algorithms have seven configurable parameters: uT1 (threshold value for
the tissue determination on fS), s1 (size of the
tissue filtering on fS), s2 and s3 (size of the
tissue simplification on fG), s4 (size of the calcium
enhancement on fR), uTlow and uThigh (threshold values
for the calcium extraction on fR). The threshold value
uT2 is obtained automatically for each image. The
values proposed for the other parameters have been set after empirical tests on a random selection of 10 images which covers the different levels of pathology and image quality. Someone who would like to use these methods with a different magnification or a different camera has to start by using a training set of images (representative of its problem) in order to adjust the values of parameters. In any case, some tests of images at
10 have shown that the approach is quite robust.
Once these parameters were fixed, a deep study has been performed on the basis of the present methods. A database of 173 images corresponding to 45 mice
has been used. The results of the interactive human segmentation of the atherosclerotic lesion and the extraction of calcification have been subjected to evaluation by another human grader in order to find out serious mistakes: only 3 cases among the set of 173 have been rejected and manually corrected (17%). In
view of these results we can state that the behaviour of the image analysis algorithms is quite satisfactory.
The approach has however several limitations. On the one hand, in order to minimise the errors of segmentation, an interactive algorithm was developed which involves a necessary human action for each image. Obviously, the task is simple (some “clicks” of mouse) but time consuming. The balance between automation and precision leads sometimes to this kind of approach. On the other hand, working on low magnification microscopic images entails that the image structures can be very small, limiting the resolution of the methods. For instance in Fig. 7 (right), notice that the size distribution of calcium for the control mouse (small calcification structures) is limited to the openings of size n 3 and 5. The classical problem of reproducibility of histologic preparations (sectioning, staining, etc.) must be also taken into account in order to prevent artefacts, like dust or others.
CONCLUSION
The robustness and accuracy of segmentation results allowed us to consider the subsequent quantification as a correct procedure. The morphological parameters obtained have been analysed and correlated to several biomedical parameters (Massy et al., 2003). We also envisage to apply this quantification approach to the study of calcification using non-invasive techniques, for instance by obtaining the morphological information by means of electron beam tomography or other imaging technique. In the previous studies based on computed tomography (Agatston et al., 1990, Morgan-Hughes et al., 2002), the quantification of calcification has not been attempted using morphological techniques.
histologic sections by morphological image analysis software are very useful. They provide a powerful tool for improving and automating experimental studies on structural-functional correlations in tissues with histopathologic changes.
ACKNOWLEDGMENTS
The authors thanks the comments and suggestions of the anonymous reviewers.
REFERENCES
Agatston AS, Janowitz WR, Hildner FJ, Zusmer NR, Viamonte M, Detrano R (1990). Quantification of Coronary Artery Calcium Using Ultrafast Computed Tomography. J Am Coll Cardiol 15:827-32.
Angulo J, Flandrin G (2003). Automated detection of working area of peripheral blood smears using mathematical morphology. Anal Cell Pathol, 25:37-49. Coster M, Chermant JL (1989). Pr´ecis d’analyse d’images,
2nd. ed. Paris: Les Presses du CNRS.
Derganc J, Likar B, Bernard R, Tomaˇzeviˇc D, Pernuˇs F (2003). Real-time automated visual inspection of color tablets in pharmaceutical blisters. Real-Time Imaging, 9:113-24.
Hanbury A, Serra J (2002). A 3D-polar Coordinate Colour Representation Suitable for Image Analysis. Submitted to Comput Vis Image Und.
Ishibashi S, Herz J, Maeda N, Goldstein JL, Brown MS (1994). The two-receptor model of lipoprotein clearence: Tests of the hypothesis in ”knockout” mice lacking the low density lipoprotein receptor, apolipoprotein E, or both proteins. Proc Natl Acad Sci USA, 91:4431-5.
Lardenoye J, de Vreis M, lowik C, Xu C,Dhore C, Cleutjens, J van Hinsberg V, van Bockel J, Quax P (2002). Accelerated atherosclerosis and calcification in vein grafts. Circ Res 91:577-84.
Margolis JR, Chen JTT, Kong Y, Peter H, Behar VS, Kisslo JA (1980). The diagnostic and prognostic significance of coronary artery calcification. Radiology 137:609-16. Massy Z, Nguyen-Khoa T, Angulo J, Munzel M, Ivanovski O, Szumilak D, Ruellan N, Descamps-Latscha B, Lacour B, Dr¨ueke T (2003) Uremia accelerates calcification in apolipoprotein E knock-out (EKO) mice. To be presented in 17th Congress of the International Society of Nephrology – 40th Congress of the European Renal Association, Berlin, June 8-12.
Meyer F (1977). Constrast features extraction. In: Chermant JL, ed. Quantitative Analysis of microstructures in Materials Science, Biology and Medecine. Stuttgart: Riederer Verlag, 374-80.
Moreso F, Ser´on D, Vitri´a J, Griny´o JM, Colom´e-Serra FM, Par´es N, Serra J (1994). Quantification of interstitial chronic renal damage by means of texture analysis. Kidney 46:1721-7.
Morgan-Hughes GJ, Roobottom CA, Marshall AJ (2002). Aortic valve imaging with computed tomography: A review. Journal of Heart Valve Disease 11(5):604-11. Muntzel M, Massy ZA, Ruellan N, Descamps-Latscha
B, Lacour B, Drueke TB (2002). Chronic renal failure increases oxidative stress and accelerates atherosclerosis in apolipoprotein-E knock-out (EKO) mice (Abstract). Nephrol Dial Transplant 17:46. Reinmuller R, Lipton MJ (1987). Detection of coronary
artery calcification by computed tomography. Dynam Cardiovasc Imag 1:139-45.
Ser´on D, Moreso F, Gratin C, Vitri´a J, Colom E, Griny´o JM, Alsina J (1996). Automated Classification of Renal Interstitium and Tubules by Local Texture Analysis and a Neural Network. Anal Quant Cytol Histol 18:410-9. Serra J (1982). Image Analysis and Mathematical
Morphology. Vol I. London: Academic Press.
Serra J (1988). Image Analysis and Mathematical Morphology. Vol II: Theoretical Advances. London: Academic Press.
Serra J (1989). Toggle mappings. In: Simon JC, ed. From Pixels to Features. Amsterdam: North Holland, 61–72. Soille P (1999). Morphological image analysis. Berlin,
Heidelberg: Springer-Verlag.
Tanenbaum SR, Dondos GT, Veselik KE, Prendergast MR, Brundage BH, Chomka EV (1989). Detection of calcific deposits in coronary arteries by ultrafast computed tomography and correlation with angiography. Am J Cardiol 63:870-2.
Tomaˇzeviˇc D, Likar B, Pernuˇs F (2002). Comparative evaluation of retrospective shading correction methods. J Microsc-Oxford, 208:212-23.