Journal of Global Pharma Technology
Available Online at:
www.jgpt.co.in
RESEARCH ARTICLE
Spectral and Linear Optical Characterization of Organic Laser
Dyes Mixture Solution
Noor K. Abdulmutalib*
,Abdulazeez O. Mousa Al-Ogaili
Physics Department, college of Science, University of Babylon, Babylon, Iraq.
*Corresponding Author:
Noor K. Abdulmutalib
Abstract
Spectral and linear optical properties for mixture of compounds Aurintricarboxylic Acid after polymerization (H1)
and Aurintricarboxylic Acid after closer ring (H2), were determined at different concentrations (3* 10-4, 6*10-4 and
9*10-4 ) M in Dimethyl sulfoxide (DMSO) solvent at room temperature. The intensity of absorption range is towards
longer wavelengths (red shift); organic laser dyes have a spectrum within range (240-600) nm. Results demonstrate that mixture of laser dyes are effective optical materials when contrasted with single laser dyes. It can be utilized as resonator in cavity lasers.
Keywords:Linear and nonlinear properties, Mixture dyes, Optical limiting, And organic laser dyes.
Introduction
Organic dyes like laser dyes have attracted extensive attention in various applications, and have been successfully integrated into optical limiters [1],the nanomedicine field [2], and optical signals in telecommunication systems [3].Due to their chemical stability and photostability, high molar extinction coefficient and bright fluorescence, it can be using in optical limiters [4-6]. Laser dyes characterized with large nonlinear optical responses are of major interest in this aspect owing to their fast response time, large nonlinear optical susceptibilities, broadband spectral response combined with low cost and ease of processing [7, 8].
Nonlinear optical (NLO) is used in various technological fields such organic materials exhibiting nonlinear absorption are currently of interest because of their large third-order nonlinearities, instantaneous response time, ease of processing, structural modifications and their applicability over a wide range of wavelengths [9]. Nonlinear optical nonlinear in the sense that they occur when the response of a material system to an applied optical field depends on a nonlinear manner upon the strength of the optical field. Therefore, nonlinear effects offer the possibility of generating light in almost any manner [10]. In order to measure the nonlinear parameters of materials, nonlinear
coefficients like nonlinear refraction (NLR), nonlinear absorption (NLA) and third-order susceptibility can be obtained with high accuracy and simplicity from a single experiment by Z-scan technique. Z-scan technique offers simplicity to determine nonlinear optical properties. This technique is a method which can rapidly measure both nonlinear absorption and nonlinear refraction in solids, liquids, and liquid solutions [11].
In this paper, the optical testing included linear and nonlinear optical properties Aurintricarboxylic Acid after polymerization (H1) and Aurintricarboxylic Acid after closer ring (H2). Also- using Z-scan for the two cases, open and closed aperture utilized (457 nm) and (84 mW) power were presented. The optical limiting behaviour of the samples is also discussed.
Material and Methods
Solutions Preparation
concentrations were prepared according to the following eq.1 [12]: …… 1
Where, W: Weight of the dissolved in material (g), Mw: Molecular weight of the material (g /mol), V: Volume of the solvent (mL) and C: The molar concentration (M).
The prepared solutions were diluted according to the following eq 2 [12]:
……. 2
Where: C1: Primary concentration, C2: New concentration, V1: The volume before dilution and V2: The volume after dilution. In this work ,three concentrations were prepared for pure liquid crystals and its complexes, the concentrations were ( 3×10⁻⁴, 6×10⁻⁴and 9×10
-4)M.
Results and Discussion
Absorption Spectra
The UV-visible absorption spectra analysis was carried out using a Shimadzu 1800 UV-visible spectrophotometer, which covers the spectral range of (200-1100) nm. DMSO contained in 1cm path cuvette was used as background set up before the measurements
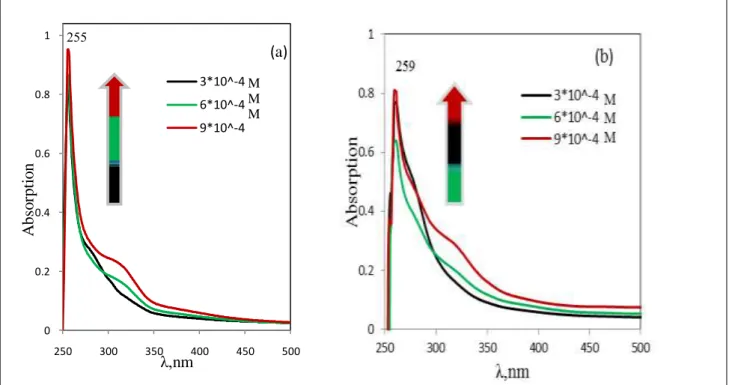
(defined as base line). This was followed by similar measurements of the dye solutions in identical cuvettes. The spectra plots were then obtained by computerized spectrophotometer automatically. All the measurements were carried out at room temperature. Fig 1. Illustrate the absorption spectra of H1 and H2 dye in DMSO solvent for different concentrations. The present results show that the absorption peaks for (3*10-4, 6*10-4 and 9*10-4) M dissolved in DMSO solvent were increase with increasing concentrations. Due to increasing number of molecules per volume unit at high concentrations, and absorption increasing with increases concentration. This behavior agrees with Beer-Lambert law [13].
0 0.2 0.4 0.6 0.8 1
250 300 350 400 450 500
A
bs
o
rpt
io
n
λ,nm
3*10^-4 6*10^-4 9*10^-4
(a) M M M
Figure 1: (a) Absorption spectra of (H1) and (b) (H2) at different concentrations
Transmission Spectra
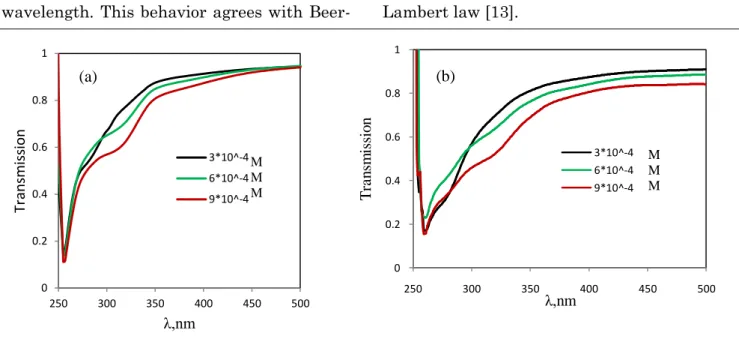
The optical transmission of pure dye solutions (H1) and (H2), in dissolved in DMSO solvent at different concentrations (3*10-4, 6*10-4 and 9*10-4) M, recorded for wavelengths (200 -1100) nm were recorded using UV-VIS spectrophotometer at room
wavelength. This behavior agrees with Beer- Lambert law [13].
0 0.2 0.4 0.6 0.8 1
250 300 350 400 450 500
Tr
an
sm
is
sio
n
λ,nm
3*10^-4 6*10^-4 9*10^-4
(a)
M M M
0 0.2 0.4 0.6 0.8 1
250 300 350 400 450 500
T
ra
n
sm
is
si
o
n
λ,nm
3*10^-4 6*10^-4 9*10^-4
(b)
M M M
Figure 2: Transmission spectra of (a) H1 and (b) H2 at different concentrations Dyes Mixture Characteristics
The absorption and fluorescence spectral of dye mixtures (H1) and (H2) at different concentrations. Fig 3.(a) and (b) illustrate the absorption spectra of dye mixtures in DMSO solvent at room temperature for different concentrations in range (3×10⁻⁴, 6×10⁻⁴ and 9×10⁻⁴) M. Several indications can be achieved from these spectra; the first one is that the dye mixtures absorption spectrum has a wide spectral range at wavelength range (260-500) nm [14]. Second, there is a change of the absorption profile with the change of concentration. At high concentrations a wide peak appears because of the aggregation and dimmer formation of dye molecules [15]. Third, a red shift appears in the absorption peaks with increasing of the concentration of dye in solution. As it happened in the Absorption Spectra, fluorescence intensity increases linearly with increasing of concentration. while at higher
concentrations fluorescence intensity reaches a limiting value and then decreases with further increase in concentration. This can be related to the phenomenon of re-absorption and re-emission, which ultimately reduces fluorescence emission [16]. The fluorescence spectra of many organic dyes in liquid solution depend on the local electric field which is induced by the surrounding polar solvent molecules, so this effect is a result of intermolecular solute-solvent interaction forces that tend to stretch the molecular bonds and shift the charge distribution on molecules and thus altering the energy difference between the ground and excited states of the solute molecules [17]. This shift is not special case for fluorescence spectra but in the same principles in absorption spectra where the fluorescence represents a mirror image for the absorption [14].
0 0.2 0.4 0.6 0.8 1
260 300 340 380 420 460 500
A
b
so
rp
ti
o
n
λ,nm (a)
3*10^-4 6*10^-4 9*10^-4
M M M
The fluorescence spectra of dye mixtures in DMSO are illustrated in Fig. 4.
0 300 600 900 1200 1500 1800
290 292 294 296 298 300 302 304 306 308 310
F
lu
o
re
sc
en
ce
λ,nm
3*10^-4 6*10^-4 9*10^-4
M M M
Figure 4: Fluorescence spectra of dyes mixture at different concentration
Nonlinear Optical Properties
The nonlinear optical properties were investigated compounds(H1,H2)respectively, for different concentrations using continuous wave (CW) diode pump solid state blue laser at wavelength (457 nm) and (84mW) power. There are two parts were used to measure the nonlinear properties of the material by Z-scan technique. The first part is open-aperture Z-scan and the second part is the closed-aperture Z-scan.
Z-Scan Measurements
Z-scan experiments were performed using a continuous wave (CW) diode solid state laser at (457 nm) wavelength and (56mW) power, which was focused by (15mm) focal length lens. Where the radius of laser spot was (0.0353 cm) and the incident laser intensity on the sample of (30.270kWatt / cm2).There are two methods of Z-scan technique, closed aperture to obtain nonlinear refractive coefficient, and open aperture method to obtain nonlinear absorption coefficient. The far field intensity is measured as a function
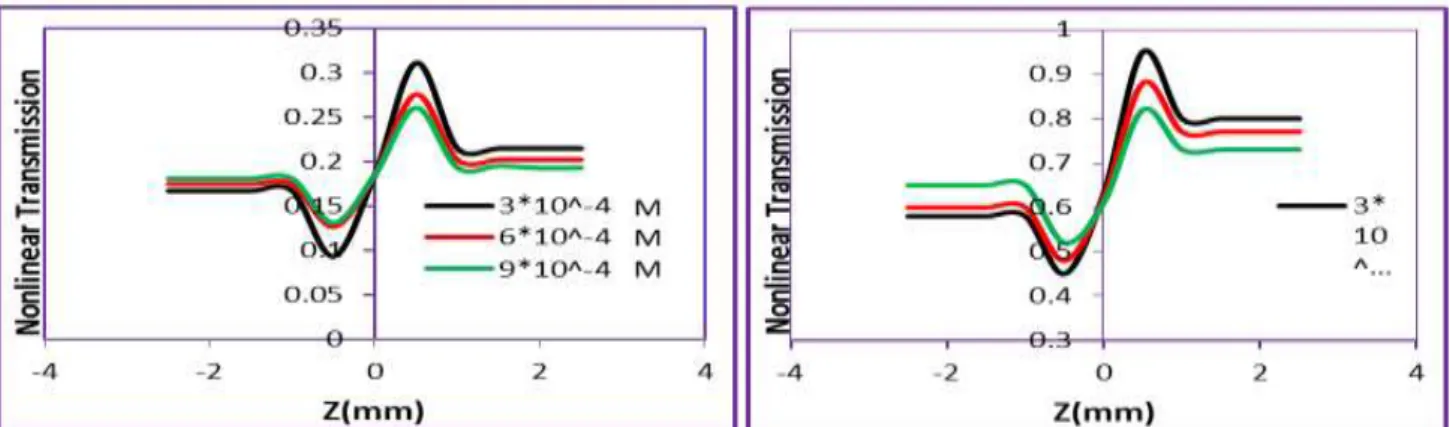
of the sample position by properly monitoring the transmittance change through a small aperture at the far field position (closed aperture).The third-order nonlinear refractive coefficient n2,and the nonlinear absorption coefficient, β, of all samples in DMSO solvent at different concentrations were evaluated by the measurements of Z-scan [12].Open-aperture Z-Z-scan of (H1, and H2) at 457nm, 84 mW in DMSO solvent are shown in Fig. 5 (a) and (b) .Its noticed (two photon absorption) phenomenon. The behavior of transmittance starts linearly at different distances from the far field of the sample position (-Z) [18].At the near field, the transmittance curve begins to decrease until it reaches the minimum value (T min) at the focal point, where (Z= 0 mm). The transmittance begins to increase towards the linear behavior at the far field of the sample position (Z). The change of intensity, in this case, is caused by two photon absorption when in the sample travels through beam waist. The open-aperture Z-scan defines variable transmittance values, which was used to determine absorption coefficient [19].
In order to describe the Z-scan behavior in the previous figures, when the sample moves far from the focus, the transmitted beam intensity is low and the transmittance remains relatively constant. As the sample approaches the beam focus, intensity increases, leading to self-lensing in the sample tend to collimate the beam on the aperture in the far field, increasing the measured transmittance at the iris position. If the beam experiences any nonlinear phase shift due to the sample as it is translated through the focal region, then the fraction of light falling on the detector will vary due to the self-lensing generated in the material by
the intense laser beam. In this case, the signal measured by detector will exhibit a peak and valley as the sample is translated [18-20]. The position of the peak and valley, relative to the Z-axis, depends on the sign of the nonlinear phase shift .Where the change in the normalized transmittance from the peak of the curve to the valley (∆Tp-v) is directly proportional to the nonlinear phase shift imparted on the beam [20]. Moreover, if the beam is transmitted through the nonlinear medium the induced phase shift can also be either negative or positive accordingly when the medium is self- defocusing or self-focusing, respectively.
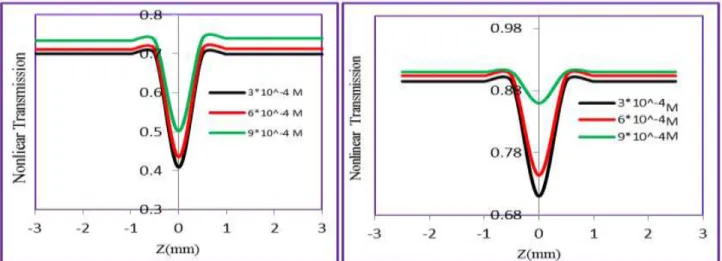
Figure 6: a and b. Closed-aperture Z-scan data for different concentrations of (H1 and mix of dyes) in (DMSO) solvent
The normalized transmittances of Z-scan measurements as a function of distance in DMSO solvent is shown in Figs 5a and 5b respectively, the nonlinear effect region is extended from -3 mm to 3 mm. The peak
followed by a valley transmittance curve obtained from the closed aperture Z-scan data indicates that the sign of the refraction nonlinearity is negative (n2 < 0), leading to self-defocusing lensing in these samples.
Table 1: The linear and nonlinear optical parameters for different concentrations of compound (H1) at λ=457nm
organic dye C
Mol/L T cmα◦-1
n◦ ΔTP-V Δφ◦ cmn2×10-11
2/mW T(z)
β×10-3 cm/mW
(H1)
3×10⁻⁴ 0.935933 0.066211 1.4441 0.20 0.2709 0.187 0.50 2.97
6×10⁻⁴ 0.912696 0.091352 1.543382 0.15 0.4236 0.234 0.43 2.32
9×10⁻⁴ 0.89948 0.105938 1.577546 0.12 0.5147 0.397 0.40 1.86
Conclusions
The linear refractive index (no) and linear absorption coefficient (αo) of all samples are increasing when the concentrations increases, as a result it can be used as resonator cavity in optical and photonic devices. The nonlinear refractive index of all samples increases when increasing concentrations but the nonlinear absorption coefficient of all samples decreases when the concentration increases.
optical limiting for mix are better than of the same samples of compound (H1and H2).
References
1. Aithal S, Aithal PS, Bhat G (2016) Characteristics of Ideal Optical Limiter and Realization Scenarios Using Nonlinear Organic Materials-A Review. Int. J. Adv. Trends Eng. Technol., 1(1):73-84.
2. Cai Y, Si W, Huang W, Chen P, Shao J, Dong X (2018) Organic dye based nanoparticles for cancer phototheranostics. Small, 14(25):1704247. 3. Parvin UM, Ahamed MB (2015) Nonlinear
optical properties of methyl blue dye by Z-scan technique. Optik (Stuttg), 126(5):551-3.
4. Kaur M, Choi DH (2015) Diketopyrrolopyrrole: brilliant red pigment dye-based fluorescent probes and their applications. Chem. Soc. Rev., 44(1):58-77.
5. Kubheka G, Sanusi K, Mack J, Nyokong T (2018) Optical limiting properties of 3, 5-dipyrenylvinyleneBODIPY dyes at 532 nm. Spectrochim Acta Part A Mol. Biomol. Spectrosc., 191: 357-64.
6. Abdel-Mottaleb MMA, Beduneau A, Pellequer Y, Lamprecht A (2015) Stability of fluorescent labels in PLGA polymeric nanoparticles: quantum dots versus organic dyes. Int. J. Pharm., 494(1):471-8. 7. Zhang Y, Wang Y (2017) Nonlinear optical
properties of metal nanoparticles: a review. RSC Adv., 7(71):45129-44.
8. Al-Saidi IA-DH, Abdulkareem SA-D (2015) Study of nonlinear optical properties and optical power limiting of Leishman dye using z-scan technique. Indian J. Phys., 89(11):1199-203.
9. Ali QM, Palanisamy PK (2006) Z-scan determination of the third-order optical nonlinearity of organic dye nile blue chloride, Mod. Phys. Lett. B., 20(11):623-32.
10.Penjweini R, Weber M, Sondermann M, Boyd RW, Leuchs G (2019) Nonlinear optics with full three-dimensional illumination. Optica., 6(7):878-83.
11.Gomez SL, Cuppo FLS, Figueiredo Neto AM (2003) Nonlinear optical properties of liquid crystals probed by Z-scan technique. Brazilian J. Phys., 33(4):813-20.
12.Mousa AO, Kadhim YH, Naser BA (2016) Study of Nonlinear Optical Properties of Nematic Liquid Crystal Material by Z-Scan Technique. World Sci. News, 52: 57-69.
13.Calloway D (1997) Beer-lambert law. J. Chem. Educ., 74(7):744.
14.Gemeda FT (2017) A Review on Effect of Solvents on Fluorescent Spectra. Chem. Sci. Int. J., 1-12.
15.Fang Y, Wei H, Dong Q, Huang J (2017) Quantification of absorption and re-emission processes to determine photon recycling efficiency in perovskite single crystals. Nat. Commun., 8:14417.
16.Renge I (2015) Solvent induced transformations of n-π* absorption in formaldehyde, acetaldehyde, and acetone. J. Phys. Chem. A., 119(32):8599-610. 17.Homocianu M (2016) Fluorescence
Spectroscopy: From Classical aspects to Current Trends. Encycl. Phys. Org. Chem., 1-47.
18.Babu KD, Murali K, Karthikeyan N, Karuppusamy S (2019) Investigation of optical limiting and third-order optical nonlinear properties of 2-Nitroaniline by Z-scan and f-scan techniques. Laser Phys., 29(9):95401.
19.Biswas S, Kole AK, Tiwary CS, Kumbhakar P (2016) Enhanced nonlinear optical properties of graphene oxide-silver nanocomposites measured by Z-scan technique. RSC Adv., 6(13):10319-25. 20.Choubey RK, Medhekar S, Kumar R,