1
ORGANIZATION CULTURE, COMPETENCY, COMPENSATION, JOB SATISFACTION AND LECTURER LOYALTY
Nyoman Surya Wijaya, I Made Darsana, I Wayan Pantiyasa, I Nyoman Gede Astina International Bali Institute of Tourism (STPBI)
Abstract
The synergy between tourism education institutions with the government which is important to equate the perception that tourism as an independent science, is a pride and a challenge for tourism college, including the International Bali Institute of Tourism (STPBI), which organizes vocational education programs. The role of the lecturer becomes very important at this stage. The problems in this research were 1). did the organizational culture, competence, and compensation affect the job satisfaction of lecturers at STPBI 2). did the job satisfaction, organizational culture, competence, and compensation affect the loyalty of lecturers at STPBI. This research used a quantitative approach with Partial Least Square (PLS) analysis tools. The result was, organizational culture, competence, and compensation have positive and significant impact on the job satisfaction of lecturers. Job satisfaction, organizational culture and compensation had positive and significant impact on lecturers' loyalty. However, competence had no significant effect on lecturer's loyalty.
Keywords: Organization Culture, Competency, Compensation, Job Satisfaction And Lecturer Loyalty
INTRODUCTION 1.1. BACKGROUND
Lecturers have an important role as one of the human resources in the education process. An experienced lecturer contributes to the quality of learning in the institution. Based on that, therefore, several points need to be considered in giving attention to lecturers are organizational culture, competence, compensation, lecturer satisfaction, and lecturer loyalty. The quality of human resources (lecturers) will be fulfilled if job satisfaction as the element that affects lecturers’ loyalty able to be created perfectly. The preparation and improvement human resources of tourism is the main task of tourism education and training institutions, ranging from vocational schools, training institutions, academies, especially for the higher education of tourism. In relation to the rise of qualification of human resources in tourism, it is necessary to synergize tourism education institutions with the government to equate the perception that tourism is an independent science that is as a pride of tourism and institution have to treat this as a challenge for tourism institution, including International Bali Institute of Tourism (STPBI).
2
attendance at various training and lecturers’ competence improvement, is very low. It also happens if there are seminars, in both national and international level that has a low participation rate. The average attendance of lecturers is less than 50% percent of the 41 permanent lecturers that already enrolled in pider dikti. Based on this phenomenon then this research studied about the satisfaction of loyalty of lecturers at International Bali Institute of Tourism.
Assessing about job satisfaction could not be separated from the factors that affect a person's job satisfaction. The role of organizational culture becomes very important at this point. Lecturer competence also could not be ignored in supporting job satisfaction. The standard of competence that required by lecturers in carrying out his work requires the lecturers to master the curriculum, mastering the subject matter, understanding the educational policies, understanding the characteristics and content of the learning materials, mastering the concept, understanding the context of the science with the community and the environment, understanding how the impact and realization science in the life of society and with other science (Suparno, 2004).
The problem of employees’ job satisfaction could not be separated from what is received by the employee itself. Compensation is a factor that able to affect employees’ job satisfaction. If the right of employees able to fulfill the employees’ performance, it also able to make the objectives of the company could be achieved. According to Yusnaena (2012: 2), compensation is the reward provided by the organization or company to the employees because the effort that has contributed in form of energy and mind for the progress of the organization or company to achieve the goal.
A good working compensation system is a system capable of ensuring employee satisfaction that ultimately enables companies to acquire, maintain and employ a number of people with positive attitudes and behaviors that will work productively for the benefit of the company (Putranto, 2012: 2). If a company was not able to provide compensation in accordance with what is expected of the employee, employees’ satisfaction will be low and can negatively affect the company.
Giving a better compensation will affect employees’ satisfaction in work because employees feel appreciated by the leadership. Giving compensation in accordance with what has been done by employees will encourage employees to work well and more responsible with what they do (Yulharsari, 2012: 2). A timely compensation system will have a considerable effect on employee satisfaction. Employees’ loyalty is a sense of loyalty or awareness of an employee to his company, which can be seen from aspects of work discipline, responsibility, and attitude during work in the company. According to Hasibuan (2005: 210), stated that the employees’ loyalty is in the various forms of participation in the use of personnel, mind and time in realizing organizational goals. There are 5 employees’ loyalty dimensions that proposed by Siswanto (2005), those are: (1) dimensions of obedience to the rules, (2) dimensions of job responsibility, (3) the sense of belonging, (4) dimensions of interpersonal relationships, (5) dimension of the liking to the work.
3
Based on the background that has been described, then the problem in this study could be formulated as follow:
1). Do the organizational culture, competence, and compensation affect the job satisfaction of lecturers at STPBI?
2). Does job satisfaction, organizational culture, competence, and compensation affect loyalty of lecturers at STPBI?
1.3. RESEARCH PURPOSES
The purpose of this study can be explained:
1). To know the influence of organizational culture, competence, and compensation on job satisfaction of lecturer at STPBI.
2). To know the influence of job satisfaction, organizational culture, competence, and compensation to the loyalty of lecturers at STPBI.
1.4. BENEFITS OF RESEARCH
This research is beneficial to gather an important information related to organizational culture, competence, compensation, job satisfaction, and loyalty of lecturer at STPBI. So the strategy and tactics of institution development related to the role of lecturers that be arranged later more effective and targeted and able to used as an input material for the stakeholders in STPBI, to make the improvements in the internal management, especially related to the campus management so that what is stated in the vision and mission of STPBI able to be realized continuously and comprehensively.
LITERATURE REVIEW
2.1. THEORETICAL FRAMEWORK 1. Organizational Culture
Luthans (1998), stated that organizational culture is the norms and values that direct the behavior of members of the organization. Each member will behave in accordance with the prevailing culture, to be accepted by the environment. The theory put forward by Schein (2009) that organizational culture could be found in 3 levels, namely the level of assumptions, values, and artifacts as in Figure 2.1 below:
Source: Schein (2009: 21)
Figure 2.1. Three Levels of Culture
Artifacts Process and organizational structure that can be seen (visible)
Espoused values Strategy, purpose, philosophy, justification that support
Assumptions
4
Researchers choose the theory of Denison (1990), based on theories of organizational culture as the basis for the preparation of organizational culture variables, the consideration of theoretical determination is based on consideration of organizational culture theory according to Denison (1990) because it brings interconnectivity between organizational culture and performance. This model highlights the importance of linking management practices with the basic assumptions and beliefs in assessing the effectiveness of organizational culture, so as to compatible with the variables used in the study. The organizational culture dimension used in the preparation of research questionnaires based on the four main properties (main culture traits) as follows:
a) Involvement (involvement). An effective organization is an organization that empowers and develops resource capabilities at all levels. In other, it relates to the ability (capability), ownership (ownership) and responsibilities (responsibility) of employees in realizing the mission of the organization. b) Consistency. Emphasize the positive impact of a strong culture on
organizational effectiveness. Systems of beliefs, values, and symbols that are shared and widely understood by members of the organization have a positive impact on their ability to reach consensus and co-ordinated actions.
c) Adaptability (adaptability). It is an elaboration of a system of norms and beliefs that able to support the capacity of an organization to receive and interpret the signs from the environment in order to change internal behavioral to survive, grow and develop.
d) Mission (mission). Determine benefits and meanings by defining social roles and external goals for the institution and defining the role of the individual with respect about the role of the institution. The awareness of the mission provides the clear directions and objectives to define the right set of actions for the organization and its members.
2. Competence
According to Spencer (1993) competency is an underlying characteristic which casually related to criteria that referenced as effective and superior performance in a job or situation. (competence is a deep and embedded personality characteristic of an individual who causes or predicts a good performance against a standard use or high performance in a job). According to Boyatzis (1982) competencies are distinguished between threshold and differentiating. The threshold competence is the basic competence required (knowledge and skills) to do the job but not to distinguish between high and low performance. Differentiating competencies are behavioral characteristics that exhibit high performance, the type of competence that differs from less effective people. Competence can also be categorized by soft competency and hard competency. Soft competencies are related to motivation, behavior, and attitudes, while hard competencies are related to knowledge and skills. Spencer (1993) suggests that there are 5 (five) characteristics as a measurement of competence, those are:
1. Motive (Motive) is something where a person is consistently thinking so as to perform an action.
5
self-confidence confidence), self-control control), hardiness (self-hardiness), endurance (self-resistance).
3. Self Concept (Self-concept/ attitude) is the attitudes and values that a person has. Attitudes and values are measured through tests to respondents to find out how the value (value) a person has, what appeals to someone to do something. A person who is considered to be a leader must have leadership. 4. Knowledge is the information that a person has for a particular field in which
knowledge is a complex competency. Scores on knowledge tests often fail to predict HR performance because the scores do not successfully measure the knowledge and expertise as to what should be done in the job.
5. Skill (Skill) is the ability to perform certain tasks both physically and mentally.
3. Compensation
Mutiara S. Panggabean (2004: 75) stated that: "Compensation can be defined as any form of reward given to employees in return for their contributions to the organization". According to Veithzal Rivai (2004: 357) stated that: "Compensation is something that employees receive in the return of their service contribution to the company".
To measure the compensation given to employees, it is necessary to know the indicators for the measurement of the compensation. According to Wibowo (2013: 348), compensation when viewed from the way the giving is differentiated into direct compensation and indirect compensation. Direct compensation is the compensation provided in the form of wages or salaries, whereas indirect compensation is provided in the form of benefits, such as health insurance or security guarantees.
According to Mondy (2008:5), compensation is distinguished for financial compensation and non-financial compensation. Financial compensation consists of direct financial compensation and indirect financial compensation. Direct financial compensation can be wages, salaries, commissions and bonuses, while indirect financial compensation is all indirectly received financial rewards, which can be health insurance, old-age benefits, insurance.
4. Employee Job Satisfaction Job satisfaction
Job satisfaction is an individual matter. Each individual has different levels of satisfaction, as defined by Kreitner & Kinicki (2005), that define job satisfaction as an effectiveness or emotional response to various aspects of work. This definition implies that job satisfaction is not a single concept, otherwise, one can be relatively satisfied with an aspect of his job and is dissatisfied with one or several other aspects. Handoko (2009) stated that job satisfaction as an emotional response that shows a pleasant feeling of employee's view of his work. Wexley and Yukl (2005) argue that job satisfaction is a generalization of employee attitudes toward work based on the assessment of various aspects of the job.
6
a. Workload, it is a set or a number of activities to be completed by employees, in this study measured from the opinions of respondents about the activities to be completed.
b. Salary, it is giving reward to the work of employees, in this study measured from the opinions of respondents about the rewards as the results of his work. c. Increase in position, it is an opportunity for employees to continue to advance and develop as a form of self-actualization, in this study measured from the opinions of respondents about the opportunity for employees to continue to grow and develop in the company.
d. Supervisors, it is the ability of superiors to show attention and provide assistance when employees have difficulty working, in this study measured from the opinions of respondents about the ability of superiors in helping employee difficulties in work.
e. Coworkers, it is the conformity of work with company standards and targets.
5. Lecturer's Loyalty
Hasibuan (2013) argued that loyalty is one of the elements used in employees’ appraisals that include loyalty to work, positions and organizations. This loyalty is reflected by the willingness of employees to maintain and defend the organization within and outside the work of irresponsible people. Steers and Porter (in Kusumo, 2006) look at work loyalty as a process that makes the organization's goals and individual goals grow fused and aligned. Steers and Porter (in Kusumo, 2006) prefer work loyalty as a condition in which individuals become bound by their activities, and through these activities grow beliefs that able to sustain their activities and involvement in groups. Moreover, Poerwopoespito (2004) explained that employee loyalty as the most important company. This attitude is reflected in the creation of a pleasant and supportive atmosphere in the workplace, maintaining the company's image and the willingness to work for a longer period of time.
According to Utomo in Sthefanus, et al (2010), there are several indicators used in measuring employees’ loyalty, those are:
a. The existence of employees, such as the length of time of them become a member of the company
b. Introduction, the introduction of employees to the ins and outs of the company c. Assets of the organization, the employee is an asset to the organization that will
support the existence of the company
d. The role of employees, the role of employees in every activity in the company. e. Employees’ pride, it is the pride of employees in the company where they work.
2.2 PREVIOUS RESEARCH
7
The Effectiveness of competence process through the improvement of skills and expertise of lecturers or competences’ improvement will provide an opportunity for lecturers to improve work performance and advanced, if the competence is given appropriately and the improvement of the competency is adjusted with the education held by the lecturer, the lecturer is expected to do a good job, the productivity increases and provide the best service to the students then this will consider the tendency of high morale and also increase the loyalty of lecturer to his/her institution (Wicaksono, 2014). Research conducted by Thoyib (2012) to an educational institution, suggests that the loyalty desired by the organization should be based on the competence of lecturers and services given lecturers to the organization (Higher Education).
The related research to the effect of compensation on job satisfaction could be seen from the research that conducted by Himawan Chandra Hadinata (2014) in his research entitled “Pengaruh Lingkungan Kerja Dan Kompensasi Terhadap
Kepuasan Kerja Karyawan Pabrik Genteng Massokka Kebumen, Jawa Tengah” or
the influence of work environment and compensation to job satisfaction of factory employees of massokka tile kebumen, Central of Java found that, based on this study compensation could explain the factors that affect employees’ job satisfaction of 42.9% and the remaining 57.1% influenced by variables outside the study.
The study that examined the influence of job satisfaction on lecturer loyalty conducted by Arifin and Mutamimah (2009) with the title “Model Peningkatan
Loyalitas Dosen Melalui Kepuasan Kerja Dosen” or lecturers’ loyalty
improvement model through lecturers’ work satisfaction. The variables in this study Competence (X1), Leadership transformation (X2), Promotion position (X3), Motivation (X4) were as exogenous variables, whereas Satisfaction (Y1) was intervening variable and Loyalty (Y2) was Endogen variable. The method used in this research was multiple linear regression statistic tests. The result of the research showed that Competence, Transformation Leadership, Promotion, and Motivation had the positive and significant influence to lecturers' satisfaction and loyalty, and lecturer's satisfaction has a positive and significant effect on lecturer's loyalty.
2.3. CONCEPTUAL FRAMEWORK
8 Figure 2.2
2.4. RESEARCH HYPOTHESES
Based on empirical studies and phenomenon that have been described, the hypotheses in this study could be formulated as follows:
1. Organizational culture, competence, and compensation affect the job satisfaction of lecturers at STPBI?
2. Job satisfaction, organizational culture, competence, and compensation affect the loyalty of lecturers at STPBI?
METHODOLOGY 3.1. The Research Setting
This research was conducted at International Bali Institute of Tourism (STPBI) located on Kecak Street, Denpasar.
3.2. Research Design
This research used the paradigm of positivism (Hypothesis test), building a model based on previous research that consisting of three independent variables (organizational culture, competence, compensation), one mediation variable (job satisfaction) and one dependent variable (Loyalty).
Organizatio nal Culture
( X1 )
Job satisfaction
( Y 1 ) Competence
( X2 )
Compensation ( X3 )
Lectures’ Loyalty
9 3.3. Types and Sources of Data
The type of data used in this study consisted of, 1). Quantitative data which is a type of data expressed in the form of numbers, such as respondent profile data by age, gender, education and years of employment, and the score of questionnaire answers. 2). Qualitative data which is a type of data that is not in the form of numbers, such as organizational structure, job descriptions, and responsibilities.
The Sources of data used in this research is, primary data and secondary data 3.4. Population and Sample
In this study, the population was 41 permanent lecturers that had worked at the International Bali Institute of Tourism (STPBI). The population (41 lectures) was chosen as research sample (census method).
3.5. The Technique of Data Collection
The method used in collecting data in this study was spreading questionnaires. This study used a closed questionnaire, a questionnaire in which its questions or statements do not give freedom to respondents to provide answers and opinions to their liking (Hasan, 2002).
3.6. Research Instrument and Testing 1. Validity test
Validity test is used to measure the validity of a questionnaire.
2. Reliability test
Reliability test is a tool used to measure a questionnaire that has indicators of variables or constructs.
3.7. Data analysis technique
10 RESULTS
4.1 Profile of Respondents
There are four aspects that could be described from the characteristics of respondents, those are position, employment, age, and education level.
Table 1. The Description of Respondent Profile Respondents’
Profile Informations
Frequency (person)
Percentage (%)
Position
Lectures 13 31.7
Permanent Lectures 3 7.30
Public Relations 1 2.40
Instructors 5 12.2
Head of the Study Program 3 7.30
Chairman of the section 4 9.80
Chairman of the laboratory 2 4.90
Head of IT center 1 2.40
Chairman of the sub-section 1 2.40
Secretary 2 4.90
The staff of Research and
Community Service Section 1 2.40
Lecture/ Staff of TH Lab 1 2.40
Lecture/ Chairman of Adum
section 1 2.40
Lecture/ Head of Administration
Foundation 1 2.40
Lecture/ Head of Adak 1 2.40
Lecture/ Secretary of LPM 1 2.40
Education Level
Bachelor Degree 9 22.0
Magister Degree 28 68.3
Doctoral Degree 4 9.80
Age
20 - 30 years old 14 34.1
31 - 40 years old 16 39.0
41 - 50 years old 6 14.6
> 50 years old 5 12.2
Employment
< 1 year 4 9.80
1 - 5 years 16 39.0
6 - 10 years 10 24.4
> 10 years 11 26.8
4.2. Answers Distribution of Respondents
11
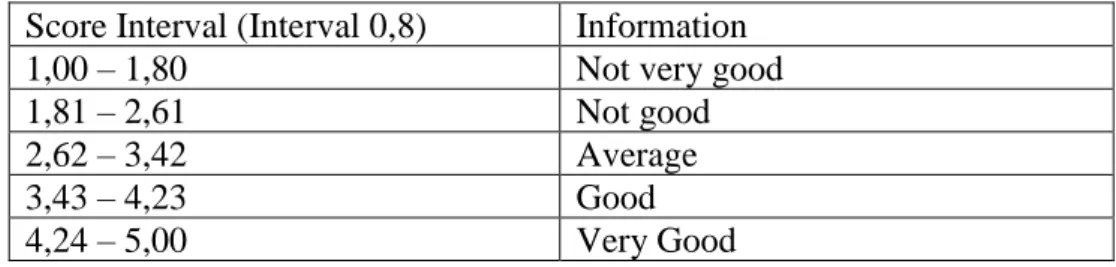
Competence, Compensation, Job Satisfaction and Loyalty. Furthermore, the answers of all respondents were averaged, with the provisions as described in Table 2 below:
Table 2. Respondents Response Criteria Score Interval (Interval 0,8) Information
1,00 – 1,80 Not very good
1,81 – 2,61 Not good
2,62 – 3,42 Average
3,43 – 4,23 Good
4,24 – 5,00 Very Good
Through the results of the analysis that has been done, the perceptions of respondents on the questionnaire that being presented in Table Description of Variables. In the table, the percentage of respondents' responses was in a total of 100%. The total score is the total number of scores from the response of respondents’ answers, meanwhile, the average score is the division between the total score with the total number of respondents. The following table is the distribution of respondents' answers on each variables’ type that selected as respondents in this study:
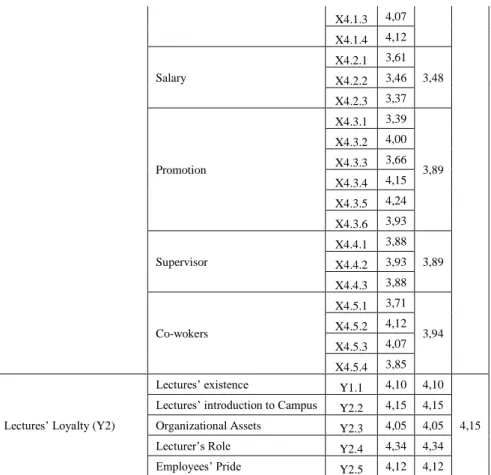
Table: 3. Description of Research Variables and Indicators
VARIABLES INDICATORS ITEMS MEAN
Organizational Culture (X1)
Involvement X1.1.1 4,07 4,12
4,15 X1.1.2 4,17
Consistency
X1.2.1 4,24 4,15 X1.2.2 4,29
X1.2.3 3,90
Adaptability
X1.3.1 4,22 4,24 X1.3.2 3,90
X1.3.3 4,59
Mission X1.4.1 4,12 4,10
X1.4.2 4,07
Competence (X2)
Knowledge X2.1 3,24 3,24
3,14
Skill X2.2 2,80 2,80
Attitude X2.3 3,37 3,37
Compensation (X3)
Financial Compensation
X3.1.1 3,44
3,50
3,55 X3.1.2 3,63
X3.1.3 3,24
X3.1.4 3,68
Non-financial Compensation
X3.2.1 3,68
3,59 X3.2.2 3,59
X3.2.3 3,59
X3.2.4 3,51
12
X4.1.3 4,07
X4.1.4 4,12
Salary
X4.2.1 3,61 3,48 X4.2.2 3,46
X4.2.3 3,37
Promotion
X4.3.1 3,39
3,89 X4.3.2 4,00
X4.3.3 3,66
X4.3.4 4,15
X4.3.5 4,24
X4.3.6 3,93
Supervisor
X4.4.1 3,88 3,89 X4.4.2 3,93
X4.4.3 3,88
Co-wokers
X4.5.1 3,71
3,94 X4.5.2 4,12
X4.5.3 4,07
X4.5.4 3,85
Lectures’ Loyalty (Y2)
Lectures’ existence Y1.1 4,10 4,10
4,15 Lectures’ introduction to Campus Y2.2 4,15 4,15
Organizational Assets Y2.3 4,05 4,05 Lecturer’s Role Y2.4 4,34 4,34 Employees’ Pride Y2.5 4,12 4,12
4.3. Structural Equations Modeling of PLS Approach
This research used structural equation model of Partial Least Square (PLS) approach. Before the analysis, prior testing or evaluation of empirical research model was done first. The results of this test are as follows:
Figure 2. Outer Model
4.4. Loading Factor (outer weight / outer Loading)
13
Table 4. Outer Loadings
Indicators Outer
Loading Results
X1.1.1 0.8729 > 0.50
X1.1.2 0.8577 > 0.50
X1.2.1 0.8191 > 0.50
X1.2.2 0.8533 > 0.50
X1.2.3 0.8413 > 0.50
X1.3.1 0.8531 > 0.50
X1.3.2 0.8429 > 0.50
X1.3.3 0.9168 > 0.50
X1.4.1 0.9055 > 0.50
X1.4.2 0.9074 > 0.50
X2.1 0.8818 > 0.50
X2.2 0.9498 > 0.50
X2.3 0.9268 > 0.50
X3.1.1 0.8300 > 0.50
X3.1.2 0.8601 > 0.50
X3.1.3 0.8629 > 0.50
X3.1.4 0.7857 > 0.50
X3.2.1 0.8465 > 0.50
X3.2.2 0.8254 > 0.50
X3.2.3 0.9012 > 0.50
X3.2.4 0.8837 > 0.50
Y1.1 1.0000 > 0.50
Y2.2 0.9426 > 0.50
Y2.3 0.9465 > 0.50
Y2.4 0.8450 > 0.50
Y2.5 0.9157 > 0.50
Based on Table 4, the value of outer loading for each indicator towards its construct has value more than 0.5. Therefore, the convergent validity of this model has been fulfilled.
Table 5. Cross Loadings
X1.1 X1.2 X1.3 X1.4 X2 X3.1 X3.2 Y1 Y2
14 X1.3. 1 0.551 0 0.648 9 0.853 1 0.583 6 0.571 2 0.549 3 0.507 2 0.618 0 0.591 6 X1.3. 2 0.648 4 0.812 1 0.842 9 0.656 0 0.765 4 0.770 0 0.746 6 0.791 8 0.769 3 X1.3. 3 0.640 4 0.844 0 0.916 8 0.690 2 0.733 6 0.619 0 0.601 8 0.738 0 0.709 9 X1.4. 1 0.696 2 0.688 2 0.652 0 0.905 5 0.670 1 0.646 5 0.708 7 0.681 6 0.694 6 X1.4. 2 0.709 6 0.662 4 0.690 8 0.907 4 0.620 9 0.716 9 0.620 9 0.700 4 0.678 8
X2.1 0.611
7 0.752 8 0.726 0 0.651 4 0.881 8 0.722 5 0.720 7 0.782 5 0.787 7
X2.2 0.624
1 0.761 2 0.763 8 0.688 8 0.949 8 0.843 6 0.849 7 0.868 6 0.856 9
X2.3 0.535
5 0.710 0 0.707 3 0.622 2 0.926 8 0.811 7 0.786 9 0.794 5 0.765 0 X3.1. 1 0.604 1 0.649 9 0.696 1 0.668 1 0.747 0 0.830 0 0.732 8 0.701 3 0.693 6 X3.1. 2 0.596 7 0.633 4 0.626 7 0.680 2 0.742 3 0.860 1 0.800 5 0.756 1 0.782 9 X3.1. 3 0.515 6 0.643 5 0.658 0 0.559 2 0.777 7 0.862 9 0.710 3 0.694 1 0.737 2 X3.1. 4 0.496 5 0.484 5 0.500 6 0.603 1 0.610 4 0.785 7 0.700 6 0.727 0 0.722 8 X3.2. 1 0.534 7 0.544 5 0.638 4 0.543 2 0.686 4 0.796 7 0.846 5 0.753 1 0.747 2 X3.2. 2 0.570 6 0.535 2 0.531 6 0.680 0 0.720 5 0.709 8 0.825 4 0.712 6 0.705 9 X3.2. 3 0.666 5 0.741 6 0.755 4 0.638 5 0.853 4 0.836 6 0.901 2 0.815 3 0.817 1 X3.2. 4 0.668 0 0.556 3 0.527 2 0.679 8 0.692 6 0.701 2 0.883 7 0.740 7 0.756 3
Y1.1 0.752
7 0.801 2 0.825 2 0.762 4 0.887 6 0.861 7 0.875 1 1.000 0 0.946 9
Y2.2 0.675
6 0.730 4 0.735 5 0.676 7 0.842 4 0.844 8 0.870 0 0.886 3 0.942 6
Y2.3 0.702
9 0.747 3 0.740 9 0.697 1 0.828 4 0.826 9 0.845 4 0.892 2 0.946 5
Y2.4 0.700
4 0.725 1 0.707 3 0.641 9 0.769 7 0.717 7 0.683 6 0.790 2 0.845 0
Y2.5 0.771
9 0.743 0 0.724 6 0.750 1 0.754 8 0.818 2 0.793 1 0.886 6 0.915 7
Based on Table 5, the largest outer loading value from the result of cross loading on each variable and dimension resulted in the highest value on each variable that was measured by itself. These results indicate that the indicators in this study have good discriminant validity.
4.5. Composite Reliability
15
aims to test the validity of the instrument in a specific research model for reflexive indicators. The results of composite reliability were presented in Table 6 below:
Table 6. Composite Reliability
Variables Composite Reliability Organizational
Culture 0.9531
Competence 0.8627 Compensation 0.9355 Job Satisfaction 1.0000 Lectures’
Loyalty 0.9539
From table 6, it could be seen that the value of composite reliability for each dimension of organizational culture variables, competence, compensation, job satisfaction and lecturers' loyalty are more than 0.70. Therefore, each research variable in the research model has met the composite reliability.
4.6. The Goodness of Fit Model
The test of a structural model of Goodness of Fit (GoF) in the inner model by using the value of Q2 predictive-relevance (Q2) to test the variables used in the model, therefore it could be clear about the numbers of exogenous variable able to predict its endogenous variable. The value of R2 for each endogenous variable (numbers of endogenous variables could be explained by exogenous variables) in this study could be seen in Table 7 below.
Table 7. R-Square
R Square
Job Satisfaction 0.873578 Lectures’ Loyalty 0.917524
Based on Table 7, the relationship between organizational culture, competence, and compensation on job satisfaction resulted in the value of R-Square of 0.874, it indicated that the diversity of perceptions of lecturers in doing their jobs at the International Bali Institute of Tourism (STPBI) on job satisfaction variables that could be explained by organizational culture, competence, and compensation was 87.4%, meanwhile the remaining 12.6% was explained by other variables other than organizational culture, competence, and compensation.
16
0.918 which indicates that the diversity of perceptions of lecturers in working at the International Bali Institute of Tourism (STPBI) on lecturers’ loyalty variables that could be explained by organizational culture, competence, compensation, and satisfaction is 91.8%, meanwhile the remaining 8.2% is explained by other variables other than organizational culture, competence, and compensation.
Next is the coefficient of total determination calculation by using the following formula.
Q2= 1 – (Pe12 x Pe22 x Pe32) with Pei = 1−Ri2 = (1 – Ri2)0.5
The results of calculation obtained by the coefficient of total determination was 0.99, which means that the developed PLS model able to explain the phenomenon of lecturers’ activities at International Bali Institute of Tourism (STPBI) toward the variable of organizational culture, competence, compensation, job satisfaction and loyalty was 99%, while the remaining 1% was explained by other variables that not used in the model.
4.7. The Result of Hypothesis Test
The result of hypothesis test by using Partial Least Square showed that there were six significant hypotheses and one hypothesis was not significant. The hypothesis test was done by using t-test (t-test) on each influencing lane between independent variable with the dependent variable. The results of hypothesis test were shown in Table 8 below:
Table 8. Path Coefficients (Mean, STDEV, T-Values)
Lanes Original
Sample (O)
Sample Mean (M)
Standard Error (STERR)
T Statistics
(|O/STERR|) Information
Organizational Culture -> Job Satisfaction 0.319 0.319 0.048 6.614 Significant
Organizational Culture -> Lectures’ Loyality 0.129 0.136 0.039 3.347 Significant
Competence -> Job Satisfaction 0.281 0.280 0.079 3.552 Significant
Competence -> Lectures’ Loyality 0.018 0.044 0.034 0.517 Not Significant
Competence -> Job Satisfaction 0.389 0.392 0.068 5.686 Significant
Competence -> Lectures’ Loyality 0.258 0.270 0.076 3.389 Significant
Job Satisfaction -> Lectures’ Loyality 0.588 0.578 0.069 8.571 Significant
17
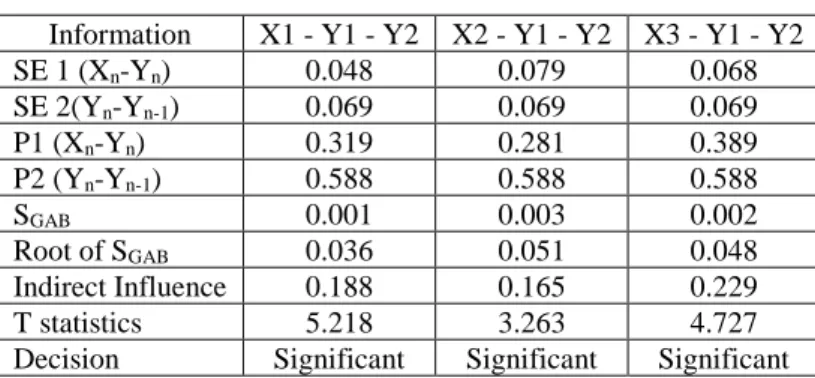
Table 9. Sobel Test Calculations
Information X1 - Y1 - Y2 X2 - Y1 - Y2 X3 - Y1 - Y2 SE 1 (Xn-Yn) 0.048 0.079 0.068
SE 2(Yn-Yn-1) 0.069 0.069 0.069
P1 (Xn-Yn) 0.319 0.281 0.389
P2 (Yn-Yn-1) 0.588 0.588 0.588
SGAB 0.001 0.003 0.002
Root of SGAB 0.036 0.051 0.048
Indirect Influence 0.188 0.165 0.229 T statistics 5.218 3.263 4.727 Decision Significant Significant Significant
There was a significant indirect influence between the compensation of organizational culture variable and loyalty variable of lecturer through job satisfaction variable (partial mediation). Meanwhile, the indirect influence of competence on lecturers’ loyalty was also concluded as significant through job satisfaction variable (full mediation).
CLOSURE
5.1. CONCLUSION
Based on the formulation of the problem, the purpose of the study, and the results of hypothesis testing that have been described in the previous chapters, then the following conclusions can be drawn:
1. Organizational culture has a positive and significant impact on job satisfaction of STPBI’s lecturers.
2. Competence has a positive and significant impact on job satisfaction of STPBI’s lecturers.
3. Compensation has a positive and significant effect on job satisfaction of STPBI’s lecturers.
4. Job satisfaction has a positive and significant impact on the loyalty of STPBI’s lecturers.
5. Organizational culture has a positive and significant impact on the loyalty of STPBI’s lecturers.
6. Competence has a positive and insignificant effect on lecturer's loyalty of STPBI. 7. Working compensation has a positive and significant impact on lecturer's loyalty
of STPBI.
5.2. SUGGESTIONS
18
1. This research used a pure quantitative (hypothetical deductive) approach to examine how is the causality relation between the variable of organizational culture, competence, and compensation (exogenous variable) to lecturer loyalty (endogenous variable) with job satisfaction variable as the intervening variable at Sekolah Tinggi Pariwisata Bali International.
2. Moreover, research should be mixed of the mixes so that the results of the analysis can be deeper and comprehensive, and able to describe the real condition of the object that being studied, and could be used as a reference by the stakeholders in STPBI, especially the management, to keep doing improvements based on STPBI's vision and mission.
REFERENCES
Arikunto, S. (2006). Prosedur Penelitian Suatu Pendekatan Praktik. Jakarta: Rineka Cipta.
Denison. 1990. Cooporate Culture And Organizational Effectiveness, Willey. Newyork.
Denison, R.D. And Mishra K.A. 1995. Toward A Theory Of Organizational Culture And Effectivenes. Journal Organization Science. Vol.6 No. 2, March-April 1995.
Ghozali, Imam.2006.Aplikasi Analisis Multivariate dengan program SPSS, Badan. Penerbit Universitas Diponegoro, Semarang.
Ghozali, Imam. 2008. Model Persamaan Struktural Konsep dan Aplikasi dengan
Program Amos 16.0, Badan Penerbit UNDIP, Semarang
Hasibuan, Malayu S.P. 2005. Manajemen Sumber Daya Manusia, Edisi Revisi. Bumi Aksara, Jakarta.
Hasan, M. Iqbal. (2002). Pokok-Pokok Materi Statistik II :Statistik Inferensial. Jakarta: Bumi Aksara.
Hasan, M. Iqbal. (2002). Pokok-Pokok Materi Statistik II :Statistik Inferensial. Jakarta: Bumi Aksara.
Nazir, 2005, Metode Penelitian, Jakarta; Ghalia Indonesia. Palan, 2007. Competency Management. PPM Indonesia : Jakarta
Putranto, 2012. Kompetensi, Kompensasi dan Kepemimpinan Pengaruhnya Terhadap Kinerja Karyawan Pada Rumah Sakit Ratumbuysang Manado.
Jurnal Ekonomi, Bisnis, Manajemen dan Akuntansi Vol. 1 No. 4
Desember:646-656.
Rahayu, V. T., dkk. 2013. Pengaruh Kepemimpinan, Lingkungan Kerja Fisik, Kompetensi Terhadap Kinerja Karyawan. Jurnal Riset Manajemen dan Akuntansi Vol. 1 No. 1 Februari: 89 – 95.
Suharsimi, Arikunto. 2010. Prosedur Penelitian Suatu Pendekatan Praktik Edisi ke-12. Jakarta: Rineka Cipta.
Sugiyono, 2004, Metode Penelitian Bisnis, Alfabeta, Bandung.
19
Stefanus, Tommy., S. Saputra dan E. M Sutanto. 2010. Analisis Pemotivasian dan Loyalitas Karyawan Bagian Pemasaran PT. Palma Abadi Sentosa di Palangkaraya. Jurnal Mitra Ekonomi dan Manajemen Bisnis Vol. 1 No. 2 p. 176 – 193.