Pesticide Toxicity Classification using Data Mining Techniques
Issac Syam Sundar Palli
#1#1PG Research Scholar, Department of Computer
Science Technology
V.R.Siddhartha Engineering College, India
1
Sandeep Yelisetti
*2*2Assistant Professor at Department of Computer
Science Technology
V.R.Siddhartha Engineering College, India
2
Abstract
Agriculture is the main occupation of our working population in India. The techniques and strategies used in agriculture since ancient times varied with many different civilizations. As time varied, the attitude towards production of crops changed according to the necessities. Pesticide is considered as an integral input for crop production during the green revolution regime. The application of pesticides was justified due to social and economic consideration, when food security was the major concern. However, these estimates were made without any regard for the environmental and human health effects of pesticide use. Chemical exposure may contribute to the increasing occurrence of the health disorders and various serious unrecoverable diseases. Many are the victims who are prone to these affects due to lack of awareness. To bring such awareness, some study on agricultural data, some of the data mining techniques can be used. We can classify the pesticides based on their usage and nature using some of the classification algorithms which are available. Probabilistic methods like NaiveBayes and TAN are considered for the classification. Based on these probabilities, data classification helps to indicate the less usage of highly toxic pesticides and adopt alternative solutions to avoid human health hazards. A comparative analysis is made between these two data classification algorithms for the given data, so that to determine which algorithm is performing well with the classification of pesticide toxicity.
Keywords— Data mining, Data Classification, Naive Bayes, TAN, LD50, Pesticide Toxicity, Agriculture
I. INTRODUCTION
Almost 70 to 80 percent of population in India has their occupation as agriculture. To gain profit in this field of occupation, the main objective is to yield more crop by any means [1]. To achieve the result, people go for using pesticides which help them to get a good crop. In ancient times people used natural fertilizers which gave them a good handful yield. But, in recent days people go for fertilizers which are made of chemicals. In the science side of view, the usage of these chemical fertilizers gives better result. For everything there exist both pros and cons. Therefore on the other side upon
consumption of the food obtained with the usage of chemical fertilizers ruins the health of many people. The Agricultural yield is primarily dependent on several conditions like weather conditions, diseases and pests, pesticides usage etc.
A. Data mining in Agriculture
Data Mining is defined simply as mining of data from a data warehouse or some number of databases. It can also be considered as a new evolution in information technology.
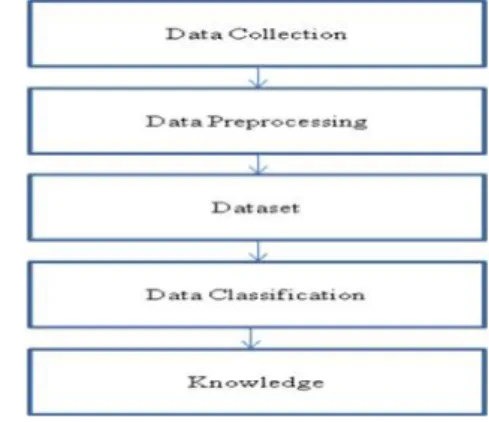
Data Mining played a very important role in the field of agriculture. Agriculture is purely dependant on some features like soil, climate, crop yield, pest types, pesticides etc. By using data mining, many issues related to soil like soil classification and soil prediction and for crop yield also the techniques are used and analysis is done. Thus data mining is used efficiently in the field of agriculture and always been on the same side for those who rely on these techniques [7]. Many decisions like which crop to be cultivated in which season, which soil to be considered for a particular crop etc are taken by only considering the results obtained using data mining techniques. Data mining techniques are frequently used to study the soil properties, crop yield properties, climatic change conditions etc. Data mining is involved in agriculture like:
Fig. 1 Data Mining in Agriculture
2) Data mining in Climate variation: In the field of agriculture, one more aspect named Climate or weather is mainly considered for the study in agriculture. If the weather can be forecasted before, then for the farmers it would be easy to decide whether to go for sowing seeds or not. Weather forecasting became a challenging task for the last decade. Sometimes due to lack of weather forecast, crops which are at the brink of reaping get damaged. In such situation data mining techniques use some parameters related to weather and thus forecast based on data available.
3) Data mining in Crop yield: In agriculture, one more aspect is given more importance and that aspect is the yield of crop. Many farmers expect to have a high yield and start to cultivate the crop, but due to some conditions like rainfall predictions or weather predictions the yield which is obtained may not be the expected one. So some data from past few years is considered and some techniques are applied to suggestions to the farmers when to start the crop and also give a analysis of how much yield a crop can get based on these data mining techniques. Some research is also done on how to increase yield of some crops like rice [5], wheat [3] [5], sugarcane [5], cotton [5], maize etc.
B. Pesticides and their toxicity
Pesticides are the chemical fertilizers which are used by a naïve farmer to get a good yield in less time with less investment. The promotion of High Yielding Varieties that marked the green revolution has led to large scale use of chemicals as pesticides. Increase in the use of chemicals as pesticides resulted in various ways like pesticides poisoning of farmers and farm workers, consumers etc.
The toxicity of the chemicals present in the pesticides can be basically divided into two types like acute toxicity and chronic toxicity. Both of these are calculated based on the important parameter named as LD50 or lethal dose 50. This LD50 gives the composition of that particular chemical present in the pesticide. If the value of LD50 is low, then the pesticide is said to be high toxic. If the value of LD50 is high,
then the pesticide is said to be less toxic. A basic categorizing is done on pesticides by WHO. This is used to educate the farmers who are not aware of these pesticides and still use them for cultivation.
C. Data classification
The procedure of ordering data acquired from a database by method for data extraction is called as data arrangement. This is likewise called managed learning. On account of order, we are given a database of articles that are marked with predefined classifications or classes. We are obliged to gaining from these articles a model that isolates them into the predefined classifications or classes. At that point, given another item, we apply the scholarly model to appoint this new question one of the classes. Arrangement system is fit for handling a more extensive mixed bag of information than relapse and is developing in notoriety.
Fig. 2 Architecture of Data classification
Data classification is applied on the available data using many classification techniques which work with different formulae. One of the best classification approach which work with better formulae is Probabilistic approach.
II. LITERATUREREVIEW
Literature review is the most important concept while doing any research. It allows knowing about the concepts in the research in detail. A vast study is done under this literature study to know about the possibilities of happening. A deep understanding and determination can be achieved by means of the literature study. For this project, many papers are studied and a brief report is given on the work done previously by other authors in the same background.
The authors Jyothy S.T, Deepu Kumar T L, and Dr.Andhe Pallavi made a comparative analysis of some discriminant algorithms on a data set of pesticides. They used two discriminant analysis algorithms to classify the pesticides toxicity based on some descriptors of their choice in the considered dataset. The discriminate analysis algorithms named Linear
Discriminant Analysis(QDA) [1]. Based on the comparison of these algorithms on the same dataset they analysed and concluded that only LDA algorithm is giving a better result of pesticide classification with a success rate greater than that of QDA algorithm. For these statistics Matlab IDE is used. The classification is done on the main attribute which is having values as “HIGH, MEDIUM, LOW, and NON TOXIC”. They finally concluded that LDA is giving better output than the latter one.
While this is in one way, some new type of pesticide classes are recommended by authors Francisco Prieto Garcia, Sandra Y. Cortés Ascencio with their colleagues based on the genetic disorders. The classifications and uses of pesticides is discussed throughout the paper for some synthesized pesticides [10]. They considered the pesticides can come under the classification based on the standards given by WHO. Standards like Class IA being extremely dangerous, Class IB being highly dangerous, Class II being moderately hazardeous, Class III being Slightly hazardeous.. They considered the main label to distinguish this difference is based on LD50 which is a metric measure in terms of mg/kg.
According to Rabia Imitiaz, Dr. Malik Sikandar, Hayat Khihal and some of his team members , pesticide classification can also be done by means of visual concepts. For this, they collected some the field areas which come under cultivation for some consecutive years 2001,2002 and 2003. The data mining is done by taking visually input as maps from of the crop area [11]. They analysed all the data and thus classified by converting the data to faces. This comes completely under visual data mining concept.
In another paper, the authors tried to predict the acute toxicity of pesticide residues on the remaining of plants or consumed food. They considered the main value as LC50 which is used as main attribute to classify and predict the acute toxicity of pesticides residues. Some modeling is also done in this paper. The algorithm like QSAR modeling method is used to model the data and further classify and predict the data whether toxic or non toxic [12]. The data sets used in this paper are from the official DEMETRA project.
According to Gongde Guo, Daniel Neagu , Xuming Huang and Yaxin Bi many types of classifiers are used for toxicity predictions. Using multiple classifiers will give an effective combination for predicting the toxicity of any chemical given in the dataset. In this paper, data sets from official DEMETRA project are taken to note down the data [15].The classifiers used in this paper are Instance based learners, Decision trees, Repeated incremental pruning to produce error reduction, SVMs, Multi layer perceptrons.
The same concept of combining of multiple classifiers for classifying pesticides for their toxic values with some extension is proposed by Emilio Benfenati, Paolo Mazzatorta and their colleagues in their research. The extension is addition of neuro-fuzzy approach. The data set which is considered as input for this approach contains 57 common chemical compounds. The t oxicity of the pesticides is based on the value of formula as Log(1/LC50). For classifying the chemicals, not only the formula is used but also a wide variety of attributes are used. Almost 150 attributes are considered in the dataset which acts as input in the above paper. The attributes are almost related to the chemical description of that particular pesticide [18]. Some algorithms like SIMCA, CART, KNN and discriminant analysis are compared.
Many authors did comparison of various algorithms for classifying the pesticide data within their dataset range, where some datasets are assumed and some are collected from other third parties.
III. DATASET
The collection of various data items into a single data table is called data set. The dataset is to be obtained based on the given raw data. It can be derived by pre-processing the data. The data which is required for the classification can be of two types. It can either be some data which is used to work in simulator mode where as the other type of data is collected from some real time environment. Such data is called real time data. In this area, the data is collected in second way so that not to miss with real time as well as not to deviate from actual technique of using pesticides.
A. Data collection
The data collected from farmers is in the form of a questionnaire. This questionnaire consists of some questions which are related to the agriculture farming data. The questionnaire is given in the table as follows:
TABLE I
PESTICIDEDATASETQUESTIONNAIRE Serial no Attribute
1 What is the Crop Name
2 In which Season
3 What is the Stage of Crop
4 What is the PestName
5 What is the Pest Severity
6 What is the Pesticide Type
7 LD50
8 Farmer Age
10 Toxic Level
A. Data attributes
Some of the data attributes which are considered for data classification are explained in detail as follows:
1) LD50: The LD50 attribute here means the amount of pesticide that is required to be used for eradication of pests for a particular crop. Here in the data set, the crop which is considered is ‘paddy’. The LD50 is the lethal dose quantity for a pesticide. It is expressed in terms of mg/kg.
If the value of LD50 is high, toxicity of pesticide is less. Here in this paper, the range is mentioned with the toxic level or predefined LD50 classes which is abstracted from WHO standards. Formula for calculating LD50 for an unknown compound:
Calculated LD50 =
2) Toxic Level: This attribute gives the toxic level of the used pesticide. The values that can be used in this attribute are as follows: HIGH, MODERATE, and LOW which describes the toxic level of the pesticide.
3) Season: This attribute contains the names of the season in which the crop is being cultivated. The seasons in terms of cultivation can be only two types. They are khariff and rabi.
4) Pest Name:This attribute contains the names of the pests which attack the crop during any of the life cycle of the crop.
There are many other attributes which are collected while collecting the data from the farmers. But only some attributes play pivot role in classifying the pesticide data. The main attributes which are used for classifying can also be known as key attributes or key descriptors for a given considered dataset of pesticides.
IV. PROPOSEDMETHOD
In this paper, the classification of available dataset is done by using some basic methods and is also known for their estimation called as probabilistic methods. Some of the probabilistic methods are Naive Bayes and TAN. Both of these algorithms are compared while classifying the same dataset.
A. Bayes Theorem
The probabilistic methods are mainly based on bayes theorem. This bayes theorem works based on the probability. It is a hypothesis depicting how the
conditional probability of each of an arrangement of conceivable foundations for a given watched result can be registered from learning of the likelihood of every reason and the contingent probability of the result of every reason. Bayes rule is the foundation rock on which any Bayesian method can be constructed. In bayes theorem, the conditional probability can be estimated based on two more possibilities like probabilities related to either of the prior and posterior values.
Prior Probability: It is said to be the first probability based value top to any of data is provided.
Posterior Probability: It is the probability value obtained after the information is provided.
B. Naive Bayes
It is one of the best classification techniques available among several techniques available in Bayesian networks. It is very famous for its working based on high independence assumptions. NB assumes each attributes are independent to each other [11]. It works based on the Bayes theorem proven for conditional probability. Structure of Naïve Bayes is as follows:
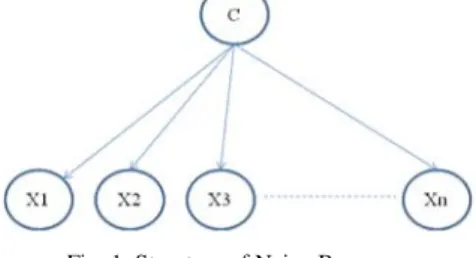
Fig. 1 Structure of Naive Bayes
Fig. 1 shows the basic form for naïve bayes is given as the model. The node C stands as the class attribute which is the main attribute reason behind for every instance classification. It can be a limited set of class labels like {C1,C2,…..Cn} and X1,X2,….Xn are some distinct variables in the data set which can be considered for classification. Here in this structure given X1, X2,…Xn are independent to each other and this the assumption made and it is very true when comes to reality. Actually these random variables can also act as evidences for classifying when the class labels cannot make a sure decision. Naive bayes algorithm actually consists of three major steps. They are as follows:
Data initialization Training
Testing
store the size of the records in the dataset. One more array is initialized to store test data.
2) Training: During this module, training phase is done. Some basic execution like calculating of prior probability and conditional probability for each attribute is done here.
3) Testing: In testing phase, the posterior probability for each attribute is calculated. Based on the prior probability of that particular attribute in the training data, this test data is classified.
PostProb(c|[f1,....fn])=log(PriorProb[c])+∑log(CP[fi|c
])n1
C. TAN
TAN is the extended version of Naïve Bayes. Here a tree based on the probability distributions is appended to the Naive Bayes, so that in order to get more accurate result on given dataset. The structure of TAN has different nodes in which if C is considered as the main class attribute and X1,X2,X3….Xn are considered as different level random attributes for a given dataset then the structure will be as follows:
Fig. 2 Structure of TAN
Fig. 2 shows the basic structure of tree augmented naive bayes classification. Here the random variables are correlated or dependent on each other. So probability of occurring of any event can be based on the occurrence of the other two or more attributes in common.
This classification algorithm is as said an extended version of naive bayes contains all the steps involved in the naive bayes algorithm. To it a tree structure is added followed by each probability and it is called as pair wise probability.
D. Measures for Comparative Analysis
Both algorithms are functioned based on one base rule and this is counted using probability concepts. Since these two algorithms are being applied on the same dataset, a comparison is required so that to identify the best classification process. For such comparison, some factors are considered. Those factors are as follows:
Precision
F-Measure
Recall
Accuracy of classification
1) Precision: It is the ration of count of specified records to the total number of records.
2) Recall: It is the ratio of count of specific records recovered to that of the total count of specific records.
3) F-Measure: It is the measure of accuracy by finding the ratio of doubling the sum of precision and recall to the product of those two terms.
V. RESULTS
The results obtained by using both the algorithms Naïve Bayes and TAN are sketched to graphs and other forms of data representations.
Fig. 3 Dataset of pesticides
Fig. 3 shows the dataset which contains the data of pesticides. This can be imported either in excel file format or from a database using a query.
Fig. 4 shows the calculation part which is done for finding the prior probability of each value in the main attribute. This is done on the training data.
Fig. 5 Construction of Nodes using pair wise probability
Fig. 5 shows the construction of a tree based on the pair wise probability between two attributes. An edge is drawn between such nodes if any path exists between them or such pair is ignored.
Naïve Bayes TAN Percentage of
Correct Classification
88 74
65 70 75 80 85 90
A
c
c
u
r
a
c
y
S
c
a
le
Acuracy of Classification on Pesticide data
Fig. 6 Graph for classification accuracy
Fig. 6 shows the classification accuracy of both algorithms which are performed on the same pesticide dataset. When compared, the NB algorithm with its 88 percent accuracy of correct classification is said to be the best classification algorithm than TAN.
500-5000 50-500 <50
<50 0 1 8
50-500 1 12 2
500-5000 24 2 0 0
5 10 15 20 25 30
Pr
ed
ic
te
d
v
a
lu
es
Classification of Test data using NB
Fig. 7 Graph for classifying test data with NB
The graph is derived for the classifying of test data using naive bayes algorithm and this is shown in the Fig. 7. The actual class can be varied with predicted class.
500-5000 50-500 <50
<50 0 0 5
50-500 3 10 3
500-5000 22 5 2 0
5 10 15 20 25 30
Pr
ed
ic
te
d
v
a
lu
es
Classification of Test data using TAN
Fig. 8 Graph for classifying test data with TAN
Fig. 8 shows the graph for classifying test data using TAN algorithm. The correct classified values are said to be more than the incorrect values.
Precision Recall F-Measure 500-5000 0.923 0.96 0.941 50-500 0.8 0.8 0.8 <50 0.889 0.8 0.842
0.7 0.75 0.8 0.85 0.9 0.95 1
Measures in Naive Bayes Technique
Fig. 9 Graph for measures in NB
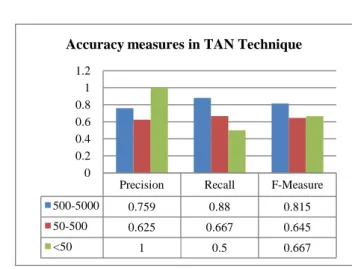
Precision Recall F-Measure 500-5000 0.759 0.88 0.815 50-500 0.625 0.667 0.645 <50 1 0.5 0.667
0 0.2 0.4 0.6 0.8 1 1.2
Accuracy measures in TAN Technique
Fig. 10 Graph for measures in TAN
Fig. 10 shows the graph drawn for the measures like precision, recall and F-measure for NB algorithm classification.
VI. CONCLUSIONS
The Pesticide Classification using some probabilistic methods like Naive bayes, Bayesian network are done. It is proved that based on the given pesticides data set the algorithms like Naive bayes and TAN are implemented, where NB is said to be efficient performer compared to that of TAN with 88 percent accuracy of correct classification. Some other
comparisons are made and diagrammatical
representations are given with the available measures like precision, time to classify, recall, F-measure etc. The toxicity level of given compounds can be predicted by using different classification algorithms. With all the comparisons made on the same data with different algorithms can give an exact result of Classification of data.
These classification algorithms give different outputs with different accuracy rates for various distinguished datasets. The data sets may be small or large but the algorithms applied can give different outputs for different data sets. For the considered dataset in this paper, various numbers of pesticides with different combinations are considered and same numbers of records are considered for both training and testing data. Many more classification algorithms can be implemented on this data set with some other random variables are main class labels.
It can be implemented using other classification algorithms available within data mining such as Decision trees, Support Vector machines (SVM), Logistic regression analysis etc.
ACKNOWLEDGMENT
First and foremost, I sincerely salute our
esteemed institution V.R SIDDHARTHA
ENGINEERING COLLEGE for giving me this
opportunity for fulfilling my project. I am thankful to our Director Dr. K.MOHANA RAO, who inspired with his words filled with dedication and discipline towards work. I am grateful to our principal Dr. A.V.RATNA PRASAD, for his encouragement and support all through the way of my project. On the submission of this Project report, I would like to extend my honor to Dr.M.SUNEETHA, Head, of the Department of IT for her constant motivation and support during the course of my work. I feel glad to express my deep sense of gratefulness to Mr. Y.SANDEEP, M.Tech Assistant professor, my guide, for his guidance and assistance in completing this project successfully. I would also like to convey my sincere indebtedness to all faculty members, including supporting staff of the Department, friends and family members who bestowed their great effort and guidance at appropriate times without which it would have been very difficult on my part to finish the project work.
REFERENCES
[1] S T, Deepu Kumar T L, Dr. Andhe Pallavi.“Comparison of two discriminant analysis algorithms in Pesticides toxicity
classification”-International Journal of Innovative Research in Technology & Science(IJIRTS).
[2] Emilio Benfenati1 , Paolo Mazzatorta1 , Daniel Neagu2 , and
Giuseppina Gini2. “Combining classifiers of pesticides toxicity
through a neuro-fuzzy approach”.
[3] FrankLemke,Emilio Benfenati,Johann-Adolf Müller.-“Data -driven Modeling and Prediction of Acute Toxicity of Pesticide
Residues” SIGKDD Explorations Vol-8.
[4] “Review- Role of Data Mining in Agriculture”, Raorane
A.A,Kulkarni R.V, Raorane A.A. et al, / (IJCSIT) International Journal of Computer Science and Information Technologies, Vol. 4 (2) , 2013, 270–272.
[5] Yethiraj N G. “Applying Data Mining Techniques in the field of agriculture and allied sciences”, International Journal of Business Intelligents - Vol 01, Issue 02, December 2012.
[6] M Trnka, “Projections of Uncertainties in Climate Change Scenarios into Expected Winter Wheat Yields”, Theoretical
and Applied Climatology, vol. 77, 2004, pages : 229-249.
[7] Mardiana Idayu Ahmada, Nur Anis Ahmada , Syahidah Akmal Muhammada,c, Norizan Esab.– “A Survey on Use, Hazards and Potential Risks of Rice Farming Pesticides in Permatang
Keriang, Pulau Pinang (Malaysia)”, International Journal of
Scientific and Research Publications, Volume 4, Issue 10, October 2014 1 ISSN 2250-3153
[8] Verheyen K, Adriaens D, Hermy M, Deckers S, "High-resolution continuous soil classification using morphological soil profile descriptions", Geoderma Vol.101, 2001, pages : 31-48.
[9] Kulwant Kaur , Maninderpal Singh. “Knowledge Discovery and Data Mining to Identify Agricultural Patterns” -International Journal of engineering sciences & research technology.2014.
[10] Francisco Prieto Garcia1,Sandra Y. Cortés Ascencio, John C. Gaytan Oyarzun, Alejandra Ceruelo Hernandez and Patricia Vazquez Alavarado – “Pesticides: classification, uses and
Research in Environmental Science and Toxicology (ISSN: 2315-5698) Vol. 1(11) pp. 279-293, December 2012.
[11] Rabia Imtiaz, Dr. Malik Sikandar Hayat Khiyal, Dr.Shahid Khalil, Aihab khan, Dr. Ahsan abdullah. “Effect of Pesticides on human life through Visual Data Mining”, Journal of Theoretical and Applied Information Technology © 2005 -2010 JATIT& LLS.
[12] Benfenati, E., Pelagatti, S., Grasso, P., Gini, G.: COMET: the approach of a project in evaluating toxicity. In: Gini, G. C.; Katritzky, A. R. (eds.): Predictive Toxicology of Chemicals: Experiences and Impact of AI Tools. AAAI 1999 Spring Symposium Series. AAAI Press, Menlo Park, CA (1999) 40-43.
[13] Benfenati, E., Piclin, N., Roncaglioni, A., Varì, M.R.: Factors Influencing Predictive Models For Toxicology. SAR and QSAR in environmental research, 12 (2001) 593-603.
[14] Lemke, F., Müller, J.-A.: Benfenati, E.: Modelling and Prediction of Toxicity of Environmental Pollutants. LNAI 3303 (Eds. J. A. Lopez et al.), Springer, Berlin, Heidelberg 2004, pp. 221-234.
[15] Lemke, F., Benfenati, E., Müller, J.-A.: Data-driven Modeling of Acute Toxicity of Pesticide Residues as Alternative Tool within Official Registration, Evaluation and Authorization Procedures, Data Mining Case Study Workshop, 5th IEEE ICDM, Houston, Texas, 2005.
[16] Roncaglioni, A., Benfenati, E., Boriani, E., Clook, M.: A Protocol to Select High Quality Datasets of Ecotoxicity Values for Pesticides. Journal of Environmental Science and Health, Part B, B39, 641- 652, 2004.
[17] Hernández, A. F., Parrón, T., Tsatsakis, A. M., Requena, M., Alarcón, R. & López-Guarnido, O. Toxic effects of pesticide mixtures at a molecular level: Their relevance to human health. Toxicology. 2012.
[18] Aktar, M. W., Sengupta, D. & Chowdhury, A. 2009. Impact of pesticides use in agriculture: their benefits and hazards. Interdisciplinary Toxicology, 2, 1–12.
[19] Ecobichon, D. J. 2001. Pesticide use in developing countries. Toxicology, 160, 27-33.
[20] Snelder, D. J., Masipiqueña, M. D. & De Snoo, G. R. 2008. Risk assessment of pesticide usage by smallholder farmers in the Cagayan Valley (Philippines). Crop Protection, 27, 747-762.
[21] Igbedioh S.O. Effects of agricultural pesticides on humans, animals and higher plants in developing countries.Arch Environ Health. 1991;46:218.
[22] FAO, http://www.fao.org/agriculture [Accessed May, 17th 2014].
[23] Pepijn Schreinemachers, Prasnee Tipraqsa Agricultural pesticides and land use intensification in high, middle and low income countries. Food Policy, Volume 37, Issue 6, December 2012, 616-626.