140
MEAT PRODUCTION IN COMMON BUCOVĂ
Ț
, DOLJ COUNTY
MEDELETE D.M., PÂNZARU R.L., Faculty of Agriculture and Hoticulture, University of Craiova
Key words: meat, cattle, sheep, goats, structure, effective, total production
ABSTRACT
This paper aims to highlight the fact that for Bucovăț, suburban village (located near
Craiova), livestock production and in particular meat production can be a alternative to diversify farmers' incomes. The existing local potential (nearly 1,400 ha of natural grassland) can exploit the opportunity to diversify agricultural production due to meat production, which aims suppliers cattle, sheep, goats and pigs.
INTRODUCTION
The first mention of the village dates from 1897, it having in the territory, following neighbors: Predesti Breasta villages north, east Craiova (the border is formed by the river Jiu) and Podari villages south of Vârvoru de Jos, in the west village Terpeziţa.
Specific activities of the area are: industry and agriculture.
Villages of the commune are: Bucovăț, Leamna de Jos, Leamna de Sus, Sărbătoarea, Cârligei and Palilula.
The village is characterized by a total area of 8264 ha, of which 111.50 ha urban and 8152.50 ha extravilan.
The number of inhabitants is 4224 people, who inhabit the 1544 households, or the 1780.
METHOD AND MATERIAL
The paper was accomplished for the 2010-2012 period. The documentation included consultation of inventory book for agricultural statistical data and the selection of data as needed. Bureau phase was accomplished through data ordering and usage – as working method – of time comparison.
RESULTS AND DISCUSSIONS
Table 1 shows the production of meat for the main species that are found in the commune of Bucovăț, analyzing the total livestock slaughtered (fig. 1), total meat production which was obtained (fig. 2) and average weight on slaughter (fig. 3).
In the case of meat production were slaughtered between 100 and 329 head of cattle (2012 and 2011), the average period being 226 heads (-9.5% compared to the first term in dynamics and 126.0% compared to the previous term in dynamic series). Indicator falls on uneven trend, the increases reporting to first base being 31.6% in 2011, then in 2012 indexes represented only 40 and 30.4% to the terms of comparison.
The number of pigs slaughtered for meat ranged from 1020 heads in 2010 to 2500 heads at the level of 2012, so that the average period reached 1543 heads. Indicator evolved strictly upward, the dynamics being dominated by the above par component index levels - except for the mobile base for period average (61.7%). Outruns reporting in 2011 was 1.08 times, 2.45 times and 2.25 in 2012, 1.51 times average period respectively.
141
followed by sharp increases in 2012 (demotions of 3.88 times the specific situation of 2011).
Table 1.
Meat production 2010–2012
Nr. Specifi.
Year Average
2010-2012
2010 2011 2012
Eff. Dynamics Eff. Dynamics Eff. Dynamics Eff. Dynamics
Fbi Mbi Fbi Mbi Fbi Mbi Fbi Mbi
1 Effective in exploitation (hwads)
1.1. - cattle 250 100 100 329 131,6 131,6 100 40,0 30,4 226 90,5 226,0 1.2. - swine 1020 100 100 1108 108,6 108,6 2500 245,1 225,6 1543 151,2 61,7 1.3. - sheep 350 100 100 180 51,4 51,4 700 200,0 388,9 410 117,1 58,6 1.4. - goats 425 100 100 1236 290,8 290,8 500 117,6 40,5 720 169,5 144,0
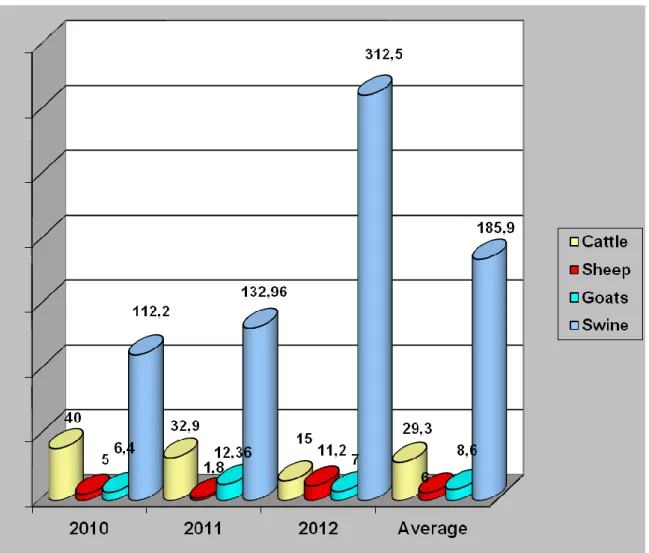
2 Total production (t)
2.1. - cattle 40 100 100 32,9 82,3 82,3 15 45,6 37,5 29,3 73,3 195,3 2.2. - swine 112,2 100 100 132,96 118,5 118,5 312,5 278,5 235,0 185,9 165,7 59,5 2.3. - sheep 5 100 100 1,8 36,0 36,0 11,2 224,0 622,2 6 120,0 53,6 2.4. - goats 6,4 100 100 12,36 193,1 193,1 7,0 109,4 56,6 8,6 134,2 122,9
3. Weight at slaughter (kg/head)
3.1. - cattle 160 100 100 100 62,5 62,5 150 93,8 150,0 130 81,3 86,7 3.2. - swine 110 100 100 120 109,1 109,1 125 113,6 104,2 120 109,1 96,0 3.3. - sheep 14 100 100 10 71,4 71,4 16 114,3 160,0 15 107,1 93,8 3.4. - goats 15 100 100 10 66,7 66,7 14 93,3 140,0 12 80,0 85,7
Goats used for meat production ranged from 425 to 1236 heads (first specific amount of 2010 the second specifies 2011). The average period was 720 heads (demotions of 1.69 and 1.44 times respectively the reporting bases - in dynamics). The dynamics is one uneven spectacular growth in 2011 (2.90 times the first term of the series dynamic), followed by reductions of 59.5% for 2012 compared with the previous term of the dynamic series.
Meat products, comes from the four species as follows:
a. cattle have provided (on average) 29.3 t of meat (-26.7 and 95.3% to the terms of comparison). The limits of variation of the indicator were 15 t in 2012 and 40 t in 2010. Indicator evolved strictly descending successive annual declines of 17.7% in the years 2011 and 62.5% in 2012;
b. amount of pig meat ranged from 112.2 t in 2010 to 312.5 t in the case of 2012. Average for the period was 189.5 t, which in dynamic was 65.7 and -40.5% compared to the reference basis. The dynamics is strictly upward;
c. for sheep there is an average of 6 t meat, with a range of variation from 1.8 to 11.2 t - in the case of 2011 and 2012 respectively. The dynamics reveals its uneven evolution (-64.0% in 2011, outruns by 2.24 and 6.22 times the terms of reference for 2012, 20.0 and -46.4% respectively for the period average - to the terms of comparison);
142
Figure 1. Total livestock used for meat production (heads)
143
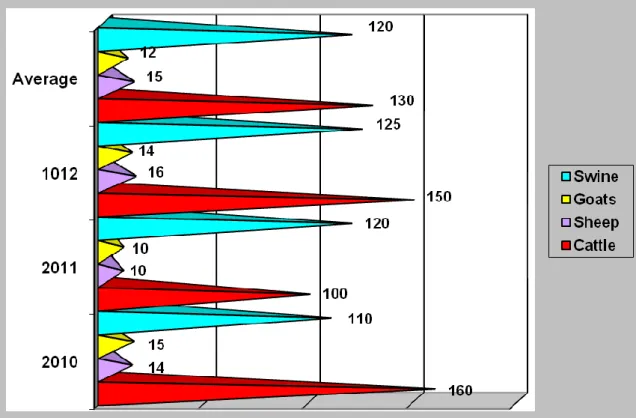
Slaughter weight used in meat production was presented - on species - as follows: 1. cattle average weights were recorded from 100 to 160 kg (2011 and 2010), the average period of 130 kg - Fig. 3.28. The evolution of this indicator is uneven decreases from 2011 (-37.5% compared to 2010), followed by increases in 2012;
2. average weight at slaughtering for pigs ranged from 110 kg in 2010 to 125 kg in the year 2012, the average period reaching 120 kg (+9.1% compared to 2010, -4.0% compared to the previous term of the series dynamic) - fig. 3. Indicator increased by 9.1% in 2011 compared to the first term of the series dynamic growth was maintained in 2012 (+13.6 and +4.2% to the terms of reference);
3. for the sheep the average weight of slaughtered were 15 kg, with limits from variation from 10 to 16 kg (2011 or 2012) - Fig. 3. Evolution of the indicator is one uneven decreases of 28.6% from 2011 (compared to the first term of the series dynamic), followed by increases of 14.3 and 60.0% respectively in 2012. The average period exceeds by 7.1% the first term of dynamic series, but is lower than the previous one 6.2%;
4. for goats there is a fluctuation for average slaughtering weight from 10 to 15 kg (2011 and 2010), the average period reaching 12 kg - fig. 3. The indicator evolved irregularly during the period analyzed, specific decreases of 2011 (-33.3%) followed by increases of 40% in 2012. For average there is a subunit level of the indicator for both indices: 80.0 and 85.7% respectively.
Figure 3. Average weight on slaughter (kg / head)
CONCLUSIONS
144
Reporting the total output for the livestock sector to the county situation, highlights the following weights: 0.71% of the total county of sheep and goats (14.6 to 2063 t), 1.42% of the total production of beef (29.3 to 2070 t), 1.44% from pork meat production (185.9 versus 12948 t).
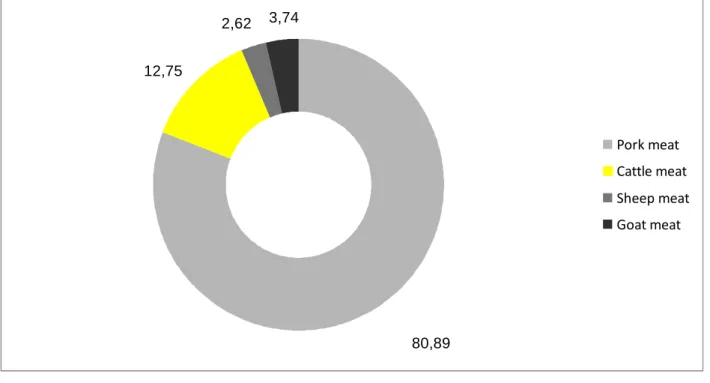
For meat production - 229.8 t - the highest rate is found for pork meat (80.89%), the remaining species having low weights as follows: 12.75% cattle, goats 3.74%, 2 , 62% sheep - fig. 4.
It can properly exploit the potential of honey in the area, especially in the context of support measures that exist in the sector of production. The same phenomenon would be highlighted for sheep and goats that can properly exploit easier than cattle and pigs, the local potential. Along with these issues would be highlighted the potential that commune have in terms of its suburban settlement, something which creates higher meanings in terms of investment objectives that can be achieved, but also in terms of market opportunities in a market adjacent significant - Craiova.
80,89 12,75
2,62 3,74
Pork meat Cattle meat Sheep meat Goat meat
Figure 4. The structure of the total production of meat (period average -%)
BIBLIOGRAPHY
1. Barbu C., Pânzaru R.L., 2000, Agrarian Economy, Hyperion Publishing House, Craiova
2. Dona, I., Rural economy, 2000, Economic Publishing House, Bucharest
3.Gavrilescu D. contributors, 2000, Agro food economy, Expert Publishing House, Bucharest ,
4. Ştefan G., 2006, Agrarian Economy, Junimea Publishing House, Iaşi
5. Ştefan G., Toma A.D., Pânzaru R.L., 2006, Economy and agro food policies, Alfa Publishing House, Iaşi
6. X X X . 2010, Statistical data, Bucovăț town hall, Dolj County 7. http://www.cjdolj.ro