Climate Action
facebook.com/
EUClimateAction EUClimateActiontwitter.com/ EUClimateActionpinterest.com/ ec.europa.eu/
clima/
IACS data: making it work for climate policy
Simon Kay
Directorate General for Climate Action
European Commission
Email: simon.kay @ec.europa.eu
Global goals
Mitigation (reducing emissions)
▶
Well below +2deg C, and efforts to limit increase to +1.5deg C
▶
Balance between emissions and removals of greenhouse gases
by the 2
nd½ of this century
Adaptation
Enhancing adaptive capacity, strengthening resilience and
reducing vulnerability to climate change
https://www.ipcc.ch/srccl-report-download-page/
Land use – a key factor in climate change
Our Vision* for a Clean Planet by 2050
M tC O2eq M tC O2eq Non-CO2 other Non-CO2 Agriculture Residential Tertiary Transport Industry PowerCarbon Removal Technologies LULUCF
Net emissions
Different zero GHG pathways lead to different levels of remaining emissions and absorption of GHG emissions
Commission vision for EU long-term strategy:
climate-neutral EU by 2050 (net zero GHG
emissions)
Substantial transformations: energy system,
buildings, transport, industry, agriculture
A number of pathways – challenging but
feasible from technological, economic,
environmental and social perspective
*Commission Communication on the proposed “Long Term Strategy”, 2018 https://europa.eu/!uJ83HG
Vision 2050:
A climate neutral EU to net zero greenhouse gas
M tC O2eq M tC O2eq Non-CO2 other Non-CO2 Agriculture Residential Tertiary Transport Industry Power
Carbon Removal Technologies LULUCF
Net emissions
Different zero GHG pathways lead to different levels of remaining emissions and absorption of GHG emissions
LULUCF includes all impacts on GHG of
human management of vegetation and
soils
cropland, grassland, forests, wetlands
Both emissions and removals
LULUCF today is approx. 11% removal of
the EU’s total GHG budget
The forest sink, however, is projected to
decline in some Member States and the EU
Additional effort can maintain these
removals
Sink –
absorbing
CO
2in
forestry,
soils
Source: Long Term Strategy, EC 2018
The LULUCF Regulation (EU)2018/841
1.
Brings a LULUCF target into EU climate policy for the first time
– Why?
Importance of natural carbon sinks for reaching carbon neutrality
“No-debit rule” = a threshold to create carbon credits, ensures that only additional action provides "credits" to meet reduction target
LULUCF credits can be used to meet
reduction targets in other sectors (to a certain extent)
ADAPT
to climate change
Water retention Choice of resilientcrops
Enhance soil quality Agro-forestry
REDUCE GHG
emissions
Precision farming Breeding Nitrification inhibitors Anaerobic digestors Energy efficiencyENHANCE carbon
removals
Afforestation Limit deforestation Enhance forest carbon sink Sustainable soil management Wetland managementPROMOTE the
bioeconomy
Bio-feedstocks for industry and powersectors
Advanced biofuels Substituting building
materials
EU Adaptation
Strategy Effort Sharing
Land Use, Land Use
Change and Forestry Emission Trading(substitution effect)
EU 2030 Climate framework EU Governance Regulation 2018/1999
The LULUCF Regulation (EU)2018/841
2.
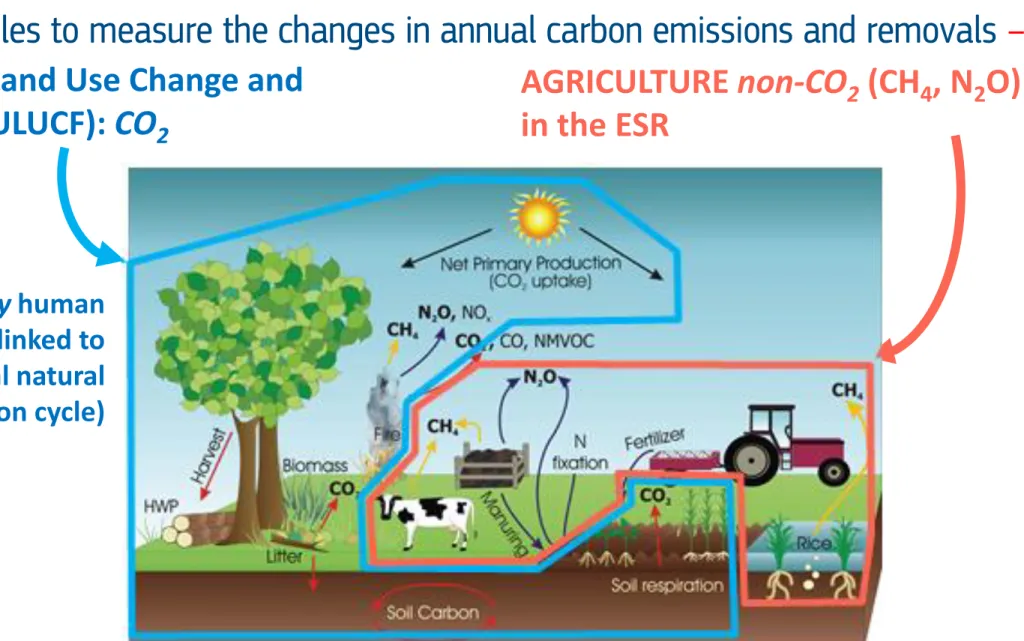
Establishes rules to measure the changes in annual carbon emissions and removals
– Why?
Unlike non-CO2 agricultural emissions (from livestock, fertiliser use, etc), which are entirely human induced, CO2 emissions and removals from land use are partly linked to the natural carbon cycle
Need for accounting rules to identify the human-induced emissions / removals (like other sectors) & incentivize additional action
Accounting rule = change vs a baseline, to cancel out the effect of natural cycle
Partly human induced (linked to global natural carbon cycle)
Land Use, Land Use Change and
Forestry (LULUCF): CO
2AGRICULTURE
non-CO
2(CH
4, N
2O)
in the ESR
Figure source: IPCC 2006. Data: EEA 2019 (2017 GHG inventory)
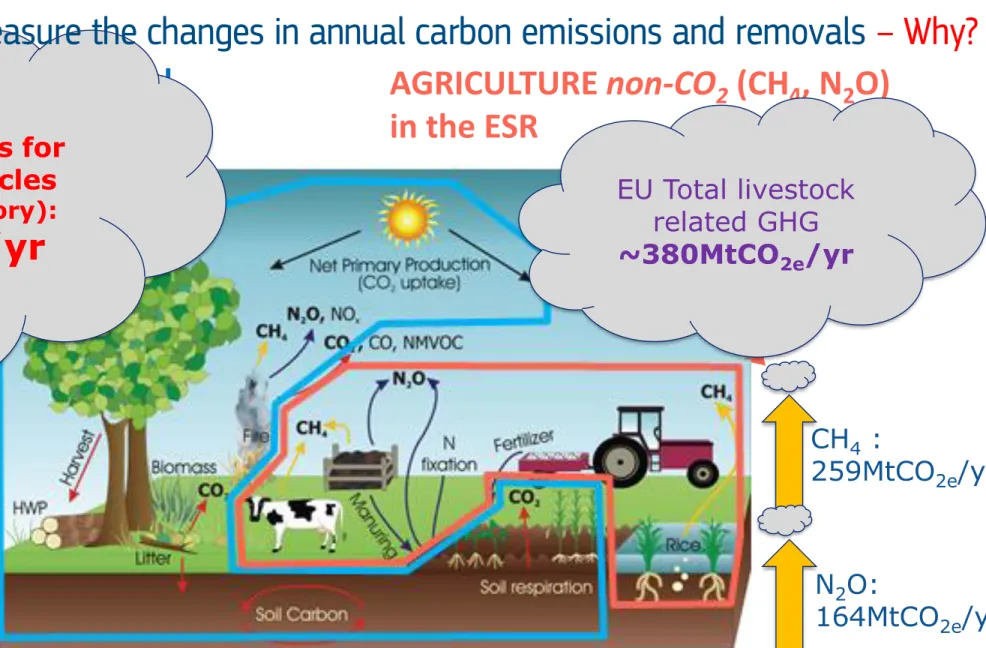
The LULUCF Regulation (EU)2018/841
Partly human induced (linked to global natural carbon cycle)
Land Use, Land Use Change and
Forestry (LULUCF): CO
2AGRICULTURE
non-CO
2(CH
4, N
2O)
in the ESR
CO2: Grassland + Cropland related to livestock
~40MtCO2/yr
CH4 :
259MtCO2e/yr
N2O:
164MtCO2e/yr
Figure source: IPCC 2006. Data: EEA 2019 (2017 GHG inventory) EU CO2 emissions for
cars + light vehicles (2017 GHG inventory):
543MtCO
2e/yr
EU Total livestock related GHG
~380MtCO2e/yr
The LULUCF Regulation (EU)2018/841
The LULUCF Regulation (EU)2018/841
3.
Requires an improvement in the accuracy of the LULUCF inventories
– Why?
Need a level of accuracy comparable with other sectors: no accuracy, no flexibility!
Reduced uncertainty = ability to better design policies in a more cost-effective way
Spatially-explicit + better data = inventories become more apt to pick up farmers’ and foresters’ climate action on the ground
Investment in climate-friendly agricultural / forestry policies should “pay off” in terms of achieving
EU Gov. Reg. 2018/1999: what does
it do?
•
Sets out national GHG inventory reporting
• Implemented acts under development; based upon existing framework (Arts. 26, 37, plus annexes)
•
Provides framework for policy development
• National Energy and Climate Plan (revision due by end 2019) • Long Term Strategy (Art. 15, 1/1/2019)
• National policies and measures, projections (Art. 39) • Links to sector policies => CAP Strategic plan (2021?)
The greenhouse gas inventory:
see Regulations 2018/841 & 2018/1999
• Paris Agreement: The inventory should be designed to apply the basic
principles of transparency, accuracy, completeness, consistency and comparability
• Methods and approaches from the 2006 IPCC Guidelines for National Greenhouse Gas Inventories for land
• The GHG inventory should be comparable in its use of definitions, categories and subcategories with national processes
• Regulation “nudge”: The GHG inventory should use “best available
methods and data” and
• Land cover categories and land use conversions
• Be geographically explicit (Reg 2018/1999 Annex V)
• Re-use existing datasets, INSPIRE (Recital 32)
• Provide synergies with other policies (e.g. CAP/IACS/LPIS, biodiversity, forest policy)
• May use Copernicus, remotely sensed data, etc. (Recital 32)
Plans in
Member States
(draft NECP
submissions)
Policy for GHG emission reduction in agriculture: • Precise mineral fertilizer use
• Direct application of organic fertilizers in soil • Liquid manure separation
• Feed Dosage Planning • Improving nutritional quality
• Maintenance of melioration systems • Fertilizer Planning
• Promotion of biogas production • Nitrogen removal
• Reconstruction and restoration of land amelioration systems in arable land • Improving the sustainability and ecological value of forest ecosystems • Restoring forest stands destroyed by natural disasters
• Creation of new orchards
• Reconstruction and restoration of land amelioration systems in arable land • Pasture in winter sowing