journal homepage: http://civiljournal.semnan.ac.ir/
Comparative Review of the Performance Based Design
of Building Structures Using Static Non-Linear
Analysis, Part B: R/C Frames
R. C. Barros 1, M.T. Braz-César 2, H. Naderpour3* and S.M. Khatami4
1. Associate Professor, Faculty of Engineering, Civil Engng Dept, University of Porto (FEUP), Porto, Portugal. 2. Ph.D. Student, Faculty of Engineering, Civil Engng Dept, University of Porto (FEUP), Porto, Portugal. 3. Assistant Professor, Faculty of Civil Engineering, Semnan University, Semnan, Iran.
4. Ph.D. Student, Faculty of Civil Engineering, Semnan University, Semnan, Iran.
*Corresponding author: [email protected]
ARTICLE INFO ABSTRACT
Article history:
Received: 14 October 2013 Accepted: 24 November 2013
The objective of this review to be submitted in two independent parts, for steel frames and for RC frames, is to compare their structural performance with respect to the proposed N2-method, and so also of the consequent convenience of using pushover methodology for the seismic analysis of these structures. A preliminary investigation is presented on a pushover analysis used for the seismic performance of metallic braced frames equipped with diagonal X-bracing and K-bracing systems. Three steel frames are analysed corresponding to 3, 6 and 10 floor regular buildings that were modelled in the MIDAS/Civil finite element software. To obtain the pushover curve a non-linear static methodology is used. For the RC frames three commercial programs (SAP 2000, SeismoStruck and MIDAS/Civil) are used in order to perform a parametric study based on pushover analyses. The equivalent strut method is applied to simulate the influence of the masonry infill panels; to evaluate the influence of these on the capacity curves, several strut width values are considered. The parametric study also addresses the influence of other parameters on the structural behaviour and non-linear capacity curves of the RC frame, namely: length and position of the plastic hinges and different loading patterns (uniform, modal and triangular distributions).
Keywords:
Performance based design, Static non-linear analysis, Pushover,
Bracing system, Dynamic analysis.
3.
Comparative
PUSHOVER
ANALYSES OF R/C FRAMES
3.1. Introduction
R/C buildings under seismic actions. In this case, the sequence of component cracking, yielding and failure, as well as the deformation pattern and shear evolution in the structure, can be traced as the lateral loads or displacements are increased. The main difference between the steel and R/C analysis is obviously related with the material behaviour and therefore the plas-tic hinge properties. The R/C hinge model must consider the nonlinear behaviour of structure, quantified by strength and deformation capacities. The assessment of these plastic hinge con-stitutive laws is the central difficulty to use a nonlinear procedure. However, when accurate plastic hinge behaviour is obtained then an analogous to the previous pushover procedure can be performed to evaluate the response of the structural system.
This section addresses some of the relevant issues regarding the use of a nonlinear static procedure to study the response of R/C buildings. Finally, to exemplify the relevance of this analysis several simplified R/C frames were studied.
3.2. R/C Plastic Hinges
Lumped plasticity is a common approach to estimate the deformation capacity of R/C
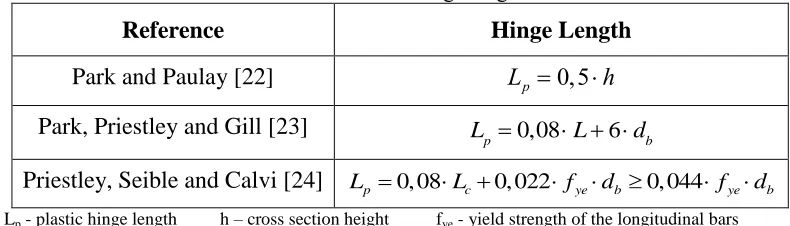
ele-ments. The ultimate deformation capacity of an element depends on the curvature and plastic hinge length and the use of different criteria for these parameters may result in different de-formation capacities. In the past years, several plastic hinge lengths have been proposed and also several plastic hinge nature. Some authors have proposed a number of expressions in order to establish the correct hinge length (Table 2).
The plastic hinges are usually located near to the elements ends where the cracking process begins due to bending moment. However, to correctly simulate the hinge behaviour it is nec-essary to consider the structural function of each element. To characterize the hinges located in the columns it is necessary to compute the axial force and bending moments interaction (P-My-Mz), therefore is fundamental to obtain the interaction curves. By other hand, beams can be simulated only with the bending moments (My-Mz) contribution and finally, the masonry walls can be simulated considering only the axial force (P) because masonry panels are accu-rately simulated with equivalent ties with compression behaviour only.
Table 2. Plastic hinge length.
Reference Hinge Length
Park and Paulay [22] Lp 0,5h
Park, Priestley and Gill [23] Lp 0,08L6db
3.3. Masonry Infill Panels
Masonry panels are normally neglected during the design procedure; however the use of their resistance capacity in this process can considerably improve the structural seismic be-haviour. Furthermore, the failure mode of a masonry filled frame is normally difficult to pre-dict since the collapse of the frame-masonry system can occur in the masonry infill as well as in the frame depending on several factors as the frame and infill panel stiffness ratio, the strength of their components and the dimensions of the structure.
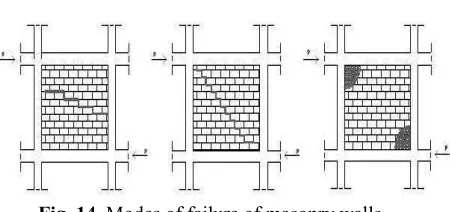
Figure 14 illustrates the some of the most significant masonry failure mechanisms: de-bonding of the mortar joints, cracking or crushing of the masonry units (or a combination of these modes). The importance of each failure mechanism depends on the material properties and the stress state induced in the panel and the filled frame collapse usually results from a combination of these mechanisms. However, the local failure of one component does not
rep-resent the failure of the whole system and should be regarded only as a serviceability state.
Fig. 14. Modes of failure of masonry walls
Among the frequent failure modes (Table 3) the shear cracking in masonry panels due to shear stresses is the most common failure mode observed in the experimental research. This mode is mainly controlled by the shear strength of the mortar joints (bond strength and coeffi-cient of friction), the tensile strength of the masonry units and the shear and normal stresses ratios.
Depending on these parameters, the combination of shear stresses with vertical axial stresses can produce either cracks crossing the masonry units or de-bonding along the mortar joints (also termed as shear friction failure).
Table 3. Masonry panels failure modes.
Shear Cracking i)ii) Stepped Cracking Along the Mortar Joints; Horizontal Sliding Along the Mortar Joints; iii) Cracking Due to Diagonal Tension.
Compressive failure i) Crushing of the Loaded Corners;
ii) Compressive Failure of the Diagonal Strut.
Flexural cracking Flexural cracks can open in the tensile side of the panel due to
the low tensile strength of the masonry.
Failure of the masonry due to compression has been observed following two mechanisms, resulting of the different stress states that are developed in the infill panel at the loaded cor-ners and along the diagonal. The first mechanism of compressive failure can occur in the re-gions close to the loaded corners, where a biaxial
compression-compression stress state develops due to the lateral loading. The biaxial stress regimen improves the strength of the masonry; however the values of the stress are higher in these zones.
cracks can open in the tensile side of the panel due to the low tensile strength of the masonry.
3.4. Numerical Models for masonry
panels
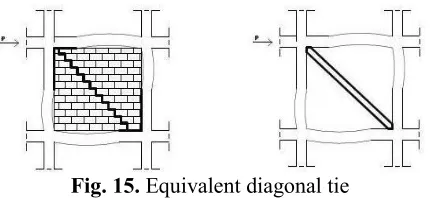
The concept of equivalent tie was introduced by Polyakov [25] after carrying out some ex-perimental research related with in-filled frames behaviour due to horizontal loads. Polyakov [25] concluded that the wall-frame structural set has a monolithic behaviour for lower hori-zontal loads however as the loads are increased the lateral deformation rises too and the wall-frame behaviour becomes more complex, with detachment between the frame and the mason-ry panel.
In that condition, the frame suffers bending deformations and the masonry panel suffers shear deformation, remaining only the contact in the compressed corners. Then the masonry panels start to function as ties under compression only. Obviously, this type of behaviour can significantly change if there is any kind of link between the frame and the panel.
In fact it is possible to simulate the contribution of the masonry infill panel over the global structural response using diagonal ties as shown in Figure 15. These ties should have the me-chanical and geometric characteristics that reproduce the behaviour of the wall and also the wall-frame structural set.
Fig. 15. Equivalent diagonal tie
The mechanical and geometric characteristics of these ties are a major issue (Stafford Smith and Carter [26]) because during the experimental results was concluded that stiffness and the diagonal resistance of the walls do not depend on their dimension and physical characteristics but on the contact length between the wall and the frame. Other authors proposed some empirical and conservative formulas with the purpose to determine the equivalent width w of the ties. Riddington and Stafford Smith [27] as well as Paulay and Priestley [28] proposed that w=0,10 d and w=0,25 d (where d is the diagonal length of the tie). However, unloading and reloading is a complex phenomenon that is very difficult to be modelled accurately. Generally, the approach adopted by Crisafulli [29] is based on an analyt-ical model that uses a curve, which passes through two predefined points (Figure 16), where the slope of the curve is known. A nonlinear continuous expression is proposed to represent the unloading-reloading curves, the main advantage of which is that the slope of the curve can be imposed at both ends.
Fig. 16. Proposed curve for unloading and reloading
2), as it is shown in Figure 17, starts from the envelope curve (εun, fun – rule 1) and finishes with a residual or plastic deformation εpl, which seems to be the most important parameter in determining the unloading curve. For the prediction of the value of εpl, empirical expressions have been pro-posed but with limited validity. Crisafulli [29] expanded a general approach used earlier, in-troducing an empirical constant in the calculation of εpl.
Fig. 17. Stress-strain curves for unloading branch
Figure 18 shows the reloading and unloading paths and the parameters that define such curves. The unloading curve starts when the compressive strain εm reaches the plastic strain εpl. After that point the compression stress increases following a path different from the one cor-responding to unloading. The shape of the reloading curve is complex, showing double curva-ture with mild concavity in the low stress region and a sharp reversal in curvature near the envelope. The reloading curve consists of two curves. The first one (rule 4) goes from the point reloading (εpl, 0) to an intermediate point (εch, fch). Then the second curve (rule 5) con-tinues until the envelope curve is reached. The modulus used as final for rule 4 is used as ini-tial for rule 5, assuring continuity. The resultant curve and its derivative are continuous,
representing thus successfully the changes of curvature observed in tests of masonry.
Fig. 18. (a) Reloading curve and associated parameters; (b) Definition of change point for
unloading curve
The previously described rules define the loops that start from and return to the envelope curve with only one reversal after complete unloading. But reversals can happen at any place during the loading history. Also, the model proposed by Crisafulli [29] includes the effect of the inner loops. Because of the complexity of the behaviour and of lack of data, Crisafulli [29] conducted tests on standard concrete cylinders with different combinations of complete and inner loops. The conclusions drawn were: (i) the successive inner loops increase the reloading strain; (ii) the inner loops do not affect the plastic deformation; (iii) the inner loops remain inside the cycle defined for the complete unloading and reloading curves.
Fig. 19. Typical cyclic response with small cycle hysteresis
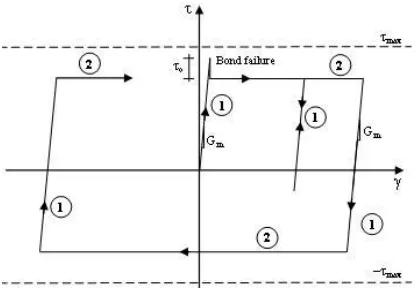
The adopted model is capable of representing the shear behaviour when bond failure happens along the mortar joints. It is assumed that the behaviour of the latter is linear elastic while the shear strength is not reached. Unloading and reloading are also in the elastic range. Thus, the shear stress τ is equal to the shear deformation γ times the shear modulus Gm.
The model consists of two simple rules and includes the axial load in the masonry as a variable in the shear strength. The shear strength is evaluated following a bond-friction mechanism, consisting of a bond-frictional component and the bond strength 0 (elastic response – rule 1). The former depends on the coefficient of friction μ and on the compressive stress fn perpendicular to the mortar joints.
'
0 max
0
0 0
m n n
m n
f if f
if f
(12) Figure 20 shows the cyclic analytical shear response of mortar joints, where ’max represents an upper limit for the shear strength according to analytical and experimental data; somehow, for medium to high values of the compressive strength fn, the previous equation (12) is not valid. So,
the values of μ and 0 should be such as to reflect the real strength of the masonry. When the shear strength is reached, the bond between mortar and brick is destroyed and cracks appear in the affected region. In this phase, one part of the infill panel slides (with respect to the other part) and only the frictional mechanism remains (sliding – rule 2).
Consequently the shear strength is given by equation (13), where μr is the residual coefficient of friction.
' max
0
0 0
m r n n
m n
f if f
if f
(13) It is assumed that the unloading and reloading, after the bond failure, follows a linear rela-tionship. This process can be represented by rule 1, using equation (12). The reloading line increases the shear stress until the shear strength is reached and sliding starts again (Figure 20).
Fig. 20. Analytical response for cyclic shear response of mortar joints
Fig. 21. Simplified masonry infill model In this figure, the first point corresponds to the material yielding (fc, dc). The next point is associated to the maximum force installed in the equivalent tie (fm, dm). In this segment it is quite visible the occurrence of progressive stiffness degradation because the slope is smaller when comparing with the first one. That is due to the cracking
process that takes place in the panel, leading to a structural stiffness reduction (Cesar, Oliveira and Barros [20]). Finally, the last point is related with panel collapse at ultimate displacement Du.
3.5 Examples of R/C infilled frames
pushover analysis
In this study several configurations of a regular R/C frame will be analysed. It is intended to simulate several asymmetries in order to compute the structural performance of each con-figuration and compare the resistant capacity evolution during the pushover procedure. The chosen structural configurations are shown in Figure 22.
Fig. 22. Pushover analysis evaluative steps, along four configurations stages The R/C members are made of C30/37
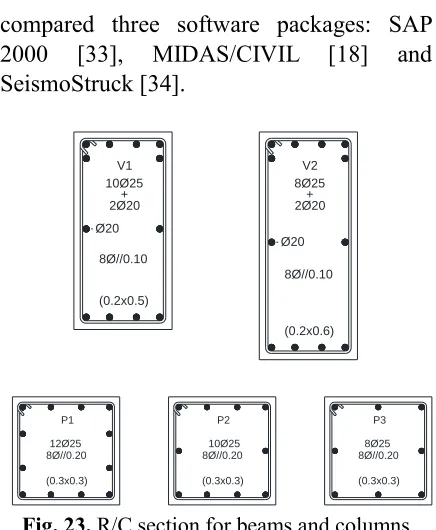
concrete and S500 steel grade and were designed according to Eurocode 2 (EC2) [31]. According with this design procedure, the columns and beams must have the following cross section: upper beams (0.2x0.5 m2), lower beams (0.3x0.6 m2) and columns (0.3x0.3 m2). The reinforcement distribution of each cross section is shown in Figure 23.
In this study will be adopted two load pattern distributions (uniform and modal distribu-tions) as presented in EC8 [2]. To obtain the moment-rotation constitutive law of each cross section, i.e. the hinge behaviour, FAGUS [32] software was used. To develop the parametric study a set of spans (5.0, 6.0 and 7.0 m) and inter-story heights (3.0, 3.5 and 4.0 m) were used. The nonlinear static Pushover analyses used and
dc dm
compared three software packages: SAP 2000 [33], MIDAS/CIVIL [18] and SeismoStruck [34].
Fig. 23. R/C section for beams and columns The pushover analyses were made based on concentrated hinges located near the end of each structural element. Usually, the distance between the concentrated hinge and the ex-tremity of the element is half the length of the hinge.
SeismoStruck software has some appropriate features to model RC frame pushover with distributed nonlinearity. It uses a three-dimensional fiber model based on finite elements, and all the analyses are treated as potentially nonlinear considering material and geometric non-linearity. The distribution
of inelasticity along the length of the elements is modelled through a cubic approximation that allows a precise estimative of the damages. The tension-extension state of the elemental sections is obtained integrating the individual nonlinear and uniaxial response of each fiber in which the section of the member element was divided. In order to integrate the equations of the cubic interpolation functions that govern the nonlinear response, two Gauss points per element are used.
The masonry panel used in this study has a young modulus of 6.0 GPa and a self-weight of 2.2 kN/m2. The masonry was modelled as an equivalent tie in SAP 2000 and MIDAS, and two different masonry behaviour models were used with SeismoStruck: “Masonry infill strut curve” (Inf_strut) and “Masonry infill shear curve” (Inf_Shear). Both models were developed and initially programmed by Crisafulli [29], and were introduced later in the program by Blandon [30].
The parameters involved in the equivalent tie model used to simulate the infill panel are shown in Table 4. Due to difficulties developing a general model that could cover all the po-tential modes of failure, only some of them were considered: cracking associated to shear and compressive failure of the equivalent ties.
Table 4. Simplified masonry model
Equivalent tie behavioral model
fc (kN) fc (m) fm (kN) dm (m) fu (kN) du (m)
110 0,001 135 0,075 0 0,3
Based on the mentioned parameters, the following results were obtained: (i) global capacity curves under several load pattern distributions; (ii) variation of the maximum basal shear in the structure according to the
parametric study; and finally: (iii) the maximum relative dis-placement between floors (floor drifts) for the defined load patterns.
V1
(0.2x0.5) 10Ø25
8Ø//0.10 2Ø20+ Ø20
V2
(0.2x0.6) 8Ø25
8Ø//0.10 2Ø20+
Ø20
P1
(0.3x0.3) 12Ø25 8Ø//0.20
P3
(0.3x0.3) 8Ø25 8Ø//0.20 P2
For stage 1 and 2 (a single storey) only uniform distribution will be addressed because all the load patterns are essentially the same. Furthermore, the influence of masonry panels will only be studied for stage 3 and 4 (since usually the first floor of office buildings is almost en-tirely glazed). Although the initial parametric study involved several beam spans and inter-storey heights, it was observed that the worst scenario is obtained with the highest value of these parameters (beam spans of 7.0m meters and inter-storey height of 4.0 m). In this case, only the results based on these values will be presented.
1st Configuration (Stage One)
Fig. 24. Capacity curves – Stage one
Fig. 25. Maximum base shear variation
2nd Configuration (Stage Two)
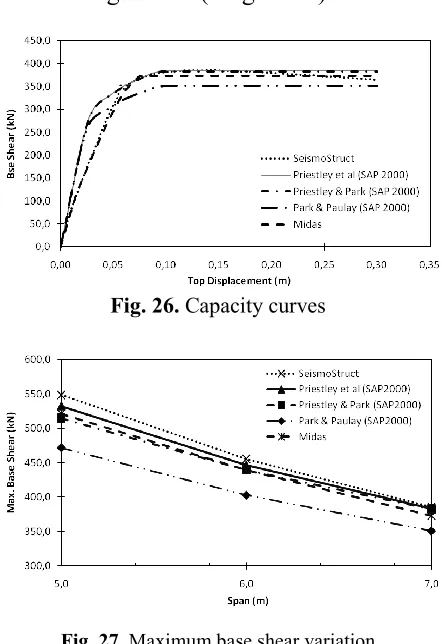
Fig. 26. Capacity curves
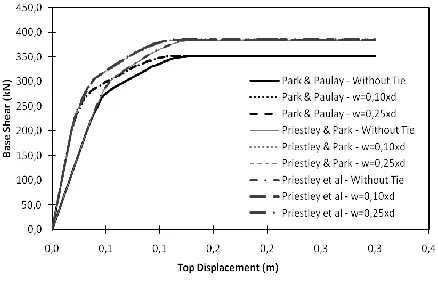
Fig. 27. Maximum base shear variation
3rd Configuration (Stage Three)
Fig. 29. Capacity curves with modal load pattern using SAP 2000
Fig. 30. Capacity curves with triangular load pattern using SAP 2000
Fig. 31. Capacity curves (Priestley et al [24]) for all types of load pattern distributions (SAP
2000)
Fig. 32. Capacity curves for all types of load pattern distributions (SeismoStruck)
Fig. 33. Capacity curves for all types of load pattern distributions (MIDAS/CIVIL)
Fig. 34. Comparison of the capacity curves (3 software) for all types of load pattern
distributions
Fig. 35. Maximum base shear (uniform dist.) with w=0.25xd
Table 5. Drifts using the proposal of Priestley et al [24] for all load pattern distributions (SAP 2000)
Drifts - Stage 3 - SAP 2000 Uniform distribution
Storey’s Priestley et al
w/ tie w=0,10xd w=0,25xd
R/C – 1º Floor 0,2789 0,2922 0,2950
1º Floor – 2º Floor 0,0211 0,0050 0,0050
Modal distribution
Storey’s Priestley et al
w/ tie w=0,10xd w=0,25xd
R/C – 1º Floor 0,2724 0,2870 0,2887
1º Floor – 2º Floor 0,0276 0,0125 0,0113
Triangular distribution
Storey’s Priestley et al
w/ tie w=0,10xd w=0,25xd
R/C – 1º Floor 0,2550 0,2775 0,2775
1º Floor – 2º Floor 0,0450 0,0225 0,0225
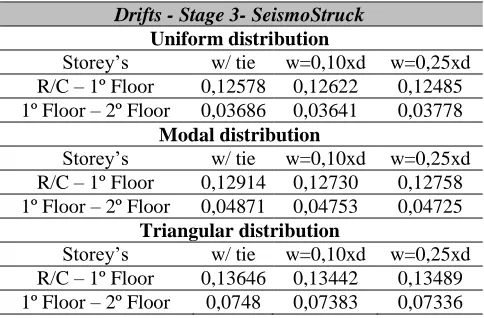
Table 6. Drifts obtained with SeismoStruck [34] for all load pattern distributions
Drifts - Stage 3- SeismoStruck Uniform distribution
Storey’s w/ tie w=0,10xd w=0,25xd
R/C – 1º Floor 0,12578 0,12622 0,12485
1º Floor – 2º Floor 0,03686 0,03641 0,03778
Modal distribution
Storey’s w/ tie w=0,10xd w=0,25xd
R/C – 1º Floor 0,12914 0,12730 0,12758
1º Floor – 2º Floor 0,04871 0,04753 0,04725
Triangular distribution
Storey’s w/ tie w=0,10xd w=0,25xd
R/C – 1º Floor 0,13646 0,13442 0,13489
Table 7. Drifts obtained with MIDAS/CIVIL [18] for all load pattern distributions
Stage 3 Uniform distribution
Storey’s w/ tie w=0,10xd w=0,25xd
R/C – 1º Floor 0,248 0,292 0,293
1º Floor – 2º Floor 0,052 0,008 0,007
Modal distribution
Storey’s w/ tie w=0,10xd w=0,25xd
R/C – 1º Floor 0,241 0,280 0,282
1º Floor – 2º Floor 0,059 0,020 0,018
Triangular distribution
Storey’s w/ tie w=0,10xd w=0,25xd
R/C – 1º Floor 0,191 0,195 0,259
1º Floor – 2º Floor 0,079 0,045 0,041
4th Configuration (Stage Four)
Fig. 36. Capacity curves with uniform load pattern using SAP 2000
Fig. 37. Capacity curves with modal load pattern using SAP 2000
Fig. 38. Capacity curves with triangular load pattern using SAP 2000
Fig. 39. Capacity curves (Priestley et al [24]) for all types of load pattern distributions (SAP
Fig. 40. Capacity curves for all types of load pattern distributions (SAP 2000)
Fig. 41. Capacity curves for all types of load pattern distributions (MIDAS/CIVIL) Comparison of capacity curves obtained from the three software used:
Fig. 42. Comparison of the capacity curves (3 software) for all types of load pattern
distributions
Fig. 43. Maximum base shear (uniform dist.) with w=0.25xd
Table 8. Drifts corresponding to proposal of Priestley et al [24] for all load patterns, using SAP 2000
Stage 4 Uniform distribution
Storey’s Priestley et al
w/ tie w=0,10xd w=0,25xd
R/C – 1º Floor 0,2782 0,2990 0,2989
1º Floor – 2º Floor 0,0218 0,0010 0,0011
Modal distribution
Storey’s Priestley et al
w/ tie w=0,10xd w=0,25xd
R/C – 1º Floor 0,2771 0,2961 0,2979
1º Floor – 2º Floor 0,0229 0,0027 0,0021
Triangular distribution
Storey’s Priestley et al
w/ tie w=0,10xd w=0,25xd
R/C – 1º Floor 0,2675 0,2903 0,2903
Table 9. Drifts obtained with SeismoStruck [34] considering all load pattern distributions
Stage 4 Uniform distribution
Storey’s w/ tie w=0,10xd w=0,25xd
R/C – 1º Floor 0,12442 0,12509 0,12545
1º Floor – 2º Floor 0,03817 0,03749 0,03712
Modal distribution
Storey’s w/ tie w=0,10xd w=0,25xd
R/C – 1º Floor 0,12532 0,12613 0,12649
1º Floor – 2º Floor 0,04031 0,03948 0,03912
Triangular distribution
Storey’s w/ tie w=0,10xd w=0,25xd
R/C – 1º Floor 0,1284 0,12345 0,12385
1º Floor – 2º Floor 0,05538 0,05432 0,05391
Table 10. Drifts obtained with MIDAS/CIVIL [18] considering all load pattern distributions
Stage 4 Uniform distribution
Storey’s w/ tie w=0,10xd w=0,25xd
R/C – 1º Floor 0,260 0,296 0,297
1º Floor – 2º Floor 0,040 0,004 0,003
Modal distribution
Storey’s w/ tie w=0,10xd w=0,25xd
R/C – 1º Floor 0,258 0,295 0,295
1º Floor – 2º Floor 0,042 0,005 0,005
Triangular distribution
Storey’s w/ tie w=0,10xd w=0,25xd
R/C – 1º Floor 0,237 0,285 0,287
1º Floor – 2º Floor 0,063 0,015 0,013
The capacity curves obtained by the MIDAS/CIVIL [18] show that the ascending branch follows closely the one obtained with the SeismoStruck [34]. Moreover the final branch of the curves, which is the maximum basal shear of the structure, is very near to the one obtained with SeismoStruck and even with SAP 2000 by the joint proposals of Park et al [9] and Priest-ley et al [10]. It can also be concluded that the yielding of the RC frame sections occurs earlier for the joint proposals made in the SAP 2000 in comparison to MIDAS/CIVIL [18] and SeismoStruck [34].
Moreover, the curves obtained in stage 3 and 4 show that when equivalent ties (with widths of 10% and 25% of the diagonal length of the panel) are used there was not a major difference in the capacity curves obtained. Although, considering the assumptions of absence of tie and a tie with a thickness equal to 25%, there is a certain difference in the curves (with the ascending branch slightly different). With the inclusion of the ties in the model, there is greater stiffness in the structure so that the top displacements are smaller.
is observed. However, all the curves converge to the same maximum basal shear value.
Adopting the triangular load distribution, a greater discrepancy in the curves under the var-ious proposals is surely seen, which is very evident in the curves obtained by MIDAS/CIVIL. Moreover, the clearly seen bundle of curves represented is due to a greater parametric varia-bility. It was also observed that the curves obtained with the uniform and modal distribution are close enough comparing to the triangular one.
Finally, the maximum inter-storey displacements were calculated, showing that between the ground floor and 1st floor the drifts are more significant in SAP 2000 [33] and MIDAS/CIVIL [18], while the relative displacements between 1st and 2nd floors are higher in SeismoStruck [34]. This difference observed, more specifically between the last two floors, can be justified based on the behavioural models embedded in SeismoStruck [34] in which two modes of failure are included: compressive failure of the equivalent tie and shear failure. In other words, the redistribution of stress according with the possible modes of failure in-cluded in this program and their interaction leads to higher collapse resistance values com-pared to SAP 2000 [33] and MIDAS/CIVIL [18], therefore, also the drifts are higher when SeismoStruck [34] is used.
Disregarding the influence of masonry panels on the 2nd floor, it appears that the relative displacements between the last floors are higher because there is not enough stiffness in the structure when compared with the equivalent ties consideration. Moreover, the modal and uni-form distributions are indeed the ones that
become closest, which is evident in the results ob-tained by SeismoStruck [34]. The structure with 1 or 2 levels shows different behaviour for modal and triangular distributions while in the multi-storey structures a similar behaviour is obtained. In this case, the modal and triangular distributions become very close because the fundamental mode controls the response of the structure.
4. CONCLUSIONS
The main objective of this work consisted on the presentation of a simplified methodology (pushover analyses) that allows obtaining the response of a structure under seismic actions considering its non-linear behaviour. To reach the objective several steel and RC frames were studied. The steel structures (3, 6 and 10 floors) were analyzed under seismic loading (consid-ered applied in two alternative loading patterns) with three variations of their resistant struc-tural system (with and without bracing). To complete the study several RC frames with and without masonry infill panels were analysed based on some numerical models proposed in commercial software.
redistribution of the damaged zones during the occurrence of a high intensity earthquake.
The response of the structures is sensitive to the loading pattern justifying the adoption of an envelope of the resistant capacity associated to the possible loading patterns. In the studied structural cases, it was verified that the largest resistant capacity was obtained with a uniform distribution of the lateral loads. Pushover analysis started to be implemented in the seismic regulations because it is an advantageous methodology for the evaluation of the seismic per-formance of structures, therefore justifying this present study and the need for continuing this research to better evaluate and characterize the applications of these analyses.
ACKNOWLEDGEMENTS
Special thanks are also due to Prof. Rui Pinho at Rose School of the University of Pavia, for providing the version used of SeismoStruck and for the rich exchange of information be-tween our institutions.
REFERENCES
[1] Fajfar, P., Fischinger, M. “N2 – A Method for Non-Linear Seismic Analysis of Regular Buildings”. Proceedings of the 9th World Conference in Earthquake Engineering, 1988, Vol.5, 111-116, Tokyo-Kyoto, Japan.
[2] EC 8, Eurocode 8: Design of structures for earthquake resistance; Part 1: General Rules, Seismic Actions and Rules for Buildings; CEN, Brussels, 2003.
[3] Cesar, M.B., Barros, R.C., “Estudo Preliminar sobre o Desempenho Sísmico de Pórticos Metálicos Contraventados a partir de Análises Estáticas Não-Lineares
(Pushover)”; Proceedings of ‘Métodos Numéricos e Computacionais em Engenharia CMNE 2007 e XXVIII CILAMCE’, Congresso Ibero Latino-Americano sobre Métodos Computacionais em Engenharia, FEUP, Porto, 13-15 Junho 2007; CMNE/CILAMCE 2007, Paper 1184 – pp. 1-18; Edts: A. Rodriguez-Ferran, Javier Olivier, Paulo R.M. Lyra, José L.D. Alves; APMTAC / SEMNI, 2007.
[4] Cesar, M.B., Barros, R.C., “Seismic Performance of Metallic Braced Frames by Pusho-ver Analyses”, Computational Methods in Structural Dynamics and Earthquake Engi-neering (COMPDYN 2009), M. Papadrakakis, N.D. Lagaros, M. Fragiadakis (eds.), Rhodes, Greece, 22–24 June 2009.
[5] Pereira, V.G., Barros, R.C. and Cesar, M.B., “A Parametric Study of a R/C Frame Based on Pushover Analysis”, 3rd International Conference on Integrity, Reliability & Failure (IRF 2009), J.F. Silva Gomes and S.A. Meguid (eds.), Porto, Portugal, 20-24 July 2009.
[6] Pereira, V.G., Barros, R.C. and Cesar, M.B., “Pushover Analyses of a R/C Frame by distinct Software”, 12th International Conference on the Enhancement and Promotion of Computational Methods in Engineering and Science (EPMESC XII), Hong-Kong and Macao, 30 Nov–3 Dec 2009.
[7] Elghazouli, A.Y. (editor), “Seismic Design of Buildings to Eurocode 8”, Spon Press, Abingdon, Oxon, UK, 2009.
[8] FEMA - Federal Emergency Management Agency, “NEHRP guidelines for the seismic rehabilitation of buildings”, FEMA-273; “NEHRP commentary on the guidelines for the seismic rehabilitation of buildings”, FEMA-274; Washington, D.C., 1997.
and C.A. Brebbia, WIT Press, (2003), U.K., pp. 3-13.
[10] R. C. Barros, R. Almeida, “Pushover analysis of asymmetric three-dimensional buildings frames”, Journal Civil Engineering & Management, Vol. XI, Number 1, pp. 3-12, Vilnius, Lithuania, 2005.
[11] Chopra, A.K., Goel, R.K., “A modal pushover analysis procedure to estimate seismic demands for unsymmetric-plan buildings”, Earthquake Engng Struct. Dyn. 33: 903–927, John Wiley & Sons Ltd, 2004.
[12] H.N. Li, G. Li, Simplified method for pushover curves of asymmetric structure with dis-placement dependent passive energy dissipation devices, Advances in Structural Engi-neering, Vol. 10, Issue 5, (2007), 537-649.
[13] G. Li, H.N. Li, Direct displacement-based design for buildings with passive energy dis-sipation devices, Gongcheng Lixue/Engineering Mechanics, Vol. 25, Issue 3, (2008), 49-57.
[14] ATC, Seismic evaluation and retrofit of concrete buildings, Report ATC-40, Applied Technology Council, Redwood City CA (1996).
[15] FEMA-356, Prestandard and commentary for the seismic rehabilitation of buildings, Report FEMA 356, Federal Emergency Management Agency, Washington, (2000).
[16] P. Fajfar, A nonlinear analysis method for performance-based seismic design, Earth-quake Spectra, Vol. 16, EERI, (2000), pp. 573-592.
[17] R. Bento, S. Falcão, F. Rodrigues, Avaliação sísmica de estruturas de edifícios com base em análises estáticas não lineares, SISMICA 2004 – 6º Congresso Nacional de Sismologia e Engenharia Sísmica, Guimarães, Portugal, 2004.
[18] MIDASIT, “MIDAS/Civil – General purpose analysis and optimal design system for civil structures”, MIDAS
Information Technology Co, Ltd., Korea, 2005.
[19] M.S. Williams, F. Albermani, Evaluation of displacement-based analysis and design methods for steel frames with passive energy dissipators, Civil Engineering Research Bulletin No. 24, University of Queensland, Australia, 2003.
[20] Braz-Cesar, M., Oliveira, D.V. and R. Carneiro-Barros, “Numerical Validation of the Experimental Cyclic Response of RC Frames”, Chapter 12 in the book Trends in Com-putational Structures Technology, Edited by: B.H.V. Topping, Saxe-Coburg Publications, ISBN 978-1-874672-39-5, pp. 267-291, Stirlingshire, Scotland, 2008.
[21] H. Krawinkler, G.D.P.K. Seneviratna, Pros and cons of a pushover analysis of seismic performance evaluation, Engineering Structures, Vol. 20, (1998), pp. 452-464. [22] Park, R. and T. Paulay, Reinforced
Concrete Structures. John Wiley & Sons Inc., New York, 1975.
[23] Park, R., Priestley, M.J.N., and W.D. Gill; “Ductility of square-confined concrete col-umns”, Journal of the Structural Division, ASCE, Vol. 108, No. ST 4, pp. 929-950, 1982.
[24] Priestley, M.J.N., Seible, F. and G.M.S. Calvi, Seismic design and retrofit of bridges. John Wiley & Sons Inc., New York, 1996.
[25] Polyakov, S. V., Masonry in framed building: an investigation into the strength and stiffness of masonry infilling, Moscow, 1957.
[26] Stafford Smith, B. and C. Carter, “A method of analysis for infilled frames”, Proceed-ings of the Institution of Civil Engineers, Vol. 44, 1969.
[27] Riddington, J. R. and B. Stafford Smith, “Analysis of infilled frames subject to racking with design recommendations”, The Structural Engineer, Vol. 55, Nº 6, 1977.
[29] Crisafulli F.J., Seismic Behaviour of Reinforced Concrete Structures with Masonry Infills, PhD Thesis, University of Canterbury, New Zealand, 1997. [30] Fardis, M.N. and T.B. Panagiotakos,
“Seismic design and response of bare and masonry-infilled reinforced concrete buildings – Part II: Infilled structures”, Journal of Earth-quake Engineering, Vol. I, No 3, 475-503, 1997.
[31] Eurocódigo 2: Projecto de estruturas de betão; Parte 1-1: Regras gerais e regras para edifícios. Comité Europeu de Normalização, Brussels, 2004.
[32] Fagus, Fagus-5: Version 1.22.0 Build 275, Cubus AG, Zurïch, 2000-2006.
[33] Computers & Structures Inc.; “SAP 2000 v10.0.1 – Structural Analysis Program”. Berkeley, California, U.S.A., 2005. [34] SeismoSoft SeismoStruck, “A Computer
Program for Static and Dynamic Nonlinear Analysis of Framed Structures”. Available online at: http://www.seismosoft.com; 2006.