Segmentation of lung parenchyma in CT
images using CNN trained with the clustering
algorithm generated dataset
Mingjie Xu
1†, Shouliang Qi
1,2*†, Yong Yue
3, Yueyang Teng
1, Lisheng Xu
1, Yudong Yao
1,4and Wei Qian
1,5Abstract
Background: Lung segmentation constitutes a critical procedure for any clinical-decision supporting system aimed to improve the early diagnosis and treatment of lung diseases. Abnormal lungs mainly include lung parenchyma with commonalities on CT images across subjects, diseases and CT scanners, and lung lesions presenting various appearances. Segmentation of lung parenchyma can help locate and analyze the neighboring lesions, but is not well studied in the framework of machine learning. Methods: We proposed to segment lung parenchyma using a convolutional neural network (CNN) model. To reduce the workload of manually preparing the dataset for training the CNN, one clustering algorithm based method is proposed firstly. Specifi-cally, after splitting CT slices into image patches, the k-means clustering algorithm with two categories is performed twice using the mean and minimum intensity of image patch, respectively. A cross-shaped verification, a volume intersection, a connected component analysis and a patch expansion are followed to generate final dataset. Secondly, we design a CNN architecture consisting of only one convolutional layer with six kernels, followed by one maximum pooling layer and two fully connected layers. Using the generated dataset, a variety of CNN models are trained and optimized, and their performances are evaluated by eightfold cross-validation. A separate validation experiment is further conducted using a dataset of 201 subjects (4.62 billion patches) with lung cancer or chronic obstructive pulmonary disease, scanned by CT or PET/CT. The segmentation results by our method are compared with those yielded by manual segmentation and some available methods.
Results: A total of 121,728 patches are generated to train and validate the CNN models. After the parameter optimization, our CNN model achieves an average F-score of 0.9917 and an area of curve up to 0.9991 for classification of lung parenchyma and non-lung-parenchyma. The obtain model can segment the lung parenchyma accu-rately for 201 subjects with heterogeneous lung diseases and CT scanners. The overlap ratio between the manual segmentation and the one by our method reaches 0.96. Conclusions: The results demonstrated that the proposed clustering algorithm based method can generate the training dataset for CNN models. The obtained CNN model can segment lung parenchyma with very satisfactory performance and have the potential to locate and analyze lung lesions.
Open Access
© The Author(s) 2019. This article is distributed under the terms of the Creative Commons Attribution 4.0 International License (http://creat iveco mmons .org/licen ses/by/4.0/), which permits unrestricted use, distribution, and reproduction in any medium, provided you give appropriate credit to the original author(s) and the source, provide a link to the Creative Commons license, and indicate if changes were made. The Creative Commons Public Domain Dedication waiver (http://creat iveco mmons .org/publi cdoma in/zero/1.0/) applies to the data made available in this article, unless otherwise stated.
RESEARCH
*Correspondence: [email protected] †Mingjie Xu and Shouliang Qi contributed equally to this work
1 Sino-Dutch Biomedical and Information Engineering School, Northeastern University, No. 195 Chuangxin Avenue, Hunnan District, Shenyang 110169, China
Keywords: Lung parenchyma, CT, Segmentation, Convolutional neural network, Clustering
Background
In recent years, segmentation has known great successes in various medical images anal-ysis tasks including detection of atherosclerotic plaques [1], pelvic cavity assessment [2, 3], ear image data towards biomechanical researches [4], skin lesions detection [5], etc. This has led to its expansion to lung diseases detection [6, 7] and specifically to lung field extraction [8]. Lung segmentation is an incredibly important component of any clinical-decision support system dedicated to improving the early diagnosis of critical lung diseases such as lung cancer, chronic obstructive pulmonary disease (COPD), etc. [9]. However, it constitutes a very challenging task [10]. Lung segmentation is difficult to achieve due to the fact that lung pathologies present various appearances different from the normal lung tissue [11, 12]. There exist dozens of lung diseases including the ground-glass opacity, consolidation, cavity, tree-in-bud and micro nodules, nodules, pleural effusion, honeycomb, etc., and each of them possesses different shape, texture, and attenuation information at CT images [13].
With the aim of improving the early diagnosis and treatment of lung diseases, numer-ous studies have been conducted to segment and analyze both normal and abnormal lung from CT images. Generally, according to the study by Mansoor et al. [12], existing methods can be categorized into four classes; and each of them owns specific advan-tages and disadvanadvan-tages. The first class is the thresholding-based methods which set a thresholding (or CT number) interval to create binary partitions [14]. These methods are the fastest, but pathological regions are often not included and various morphologi-cal operations are required. The second class is referred to as region-based methods and includes the region growing [15], graph cuts [16, 17], random walk [10, 18, 19], etc. This class of methods is fast and works well with more subtle attenuation variations. How-ever, they presence some deficiencies such as over-segmentation problem and may fail if there exist great number of pathological findings in the lung. The third class is shape-based methods and can be further divided into two sub-classes: atlas-shape-based and model-based. As the prior knowledge of lung shape, an atlas or model is aligned to the target images firstly, and then the atlas or model is transformed geometrically to the best seg-mentation through an optimization procedure [20–23]. These methods work well only for the lungs with mild and moderate abnormalities, but have difficulties while creating representative model and are computationally expensive. The fourth class is neighbor-ing anatomy guided methods which use the spatial information of surroundneighbor-ing organs (e.g., rib, heart, spine, liver, spleen) to constrain the segmentation [11]. Moreover, a new trend has been becoming obvious for the segmentation of lung, i.e., the combination of different methods generate better results [12, 19]. Other surface-based methods are also available [24], and readers are encouraged to refer to the reviews for further details [12, 25, 26].
fractal features, and used Bayesian classifier to discriminate five categories. Yao et al. [28] had extracted 25 features from each 16 × 16 image patch and used support vector machine (SVM) to differentiate normal from abnormal lung regions (pulmonary infec-tion and fibrosis). Similarly, the 130 gray-level co-occurrence features extracted from 21 × 21 × 21 pixel VOI and k-nearest neighbor classifier were used to classify lung parenchyma into normal, ground glass, and reticular patterns [29]. Extracted Mobius invariant shape features and statistical texture features and SVM were also employed to detect and quantify tree-in-bud (TIB) opacities from CT images [30]. Song et al. [31] had extracted 176 texture, intensity and gradient features from each image patch and investigated the performance of four approximative classifiers. Thereafter, to the end of overcoming the difficulties encountered in the processes of features design and selec-tion, some deep learning (i.e., convolutional neural network, CNN) and representation learning methods have been used to address the lung CT images analysis [32, 33].
Nowadays, many machine learning-based algorithms are being used to detect or dis-tinguish various lung abnormalities and the obtained results are combined with the nor-mal lung parenchyma segmented by other traditional methods to detect the complete lung area. Although, these methods can produce satisfactory results, their implementa-tions comprise many processes which may need longer computational time. Moreover, in some machine learning methods especially the deep learning methods, huge amount of image patches need to be labeled or annotated manually; which is a time-consuming process and constitutes a tedious task for the radiologists. Thus, the development of a machine learning-based framework for precise segmentation of lung parenchyma from thoracic CT images will be of great help in analyzing and treating lung diseases. Addi-tionally, an easier and low-cost accurate way for generating massive dataset used in the processes of training and validation of deep learning model is highly needed.
Methods
Our proposed lung parenchyma segmentation method consists of three stages: (1) the generation of the labeled dataset to be fed into the CNN; (2) the design, training and val-idation of a CNN model; (3) the segmentation using the trained CNN. A detailed expla-nation of every stage of the proposed framework is given below.
The generation of the labeled dataset
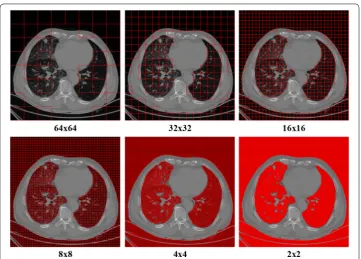
Adopting the popular machine learning framework, all the input images with a fixed size of 512 × 512 are split into smaller patches with the same size at first. The size of patches is determined through comparing the clustering results at different settings of 64 × 64, 32 × 32, 16 × 16, 8 × 8, 4 × 4 and 2 × 2. The best patch size is set to 8 × 8, and the reason will be interpreted in the subsection of experiments. Total number of patches is 10,076,160 split from the data of 23 patients.
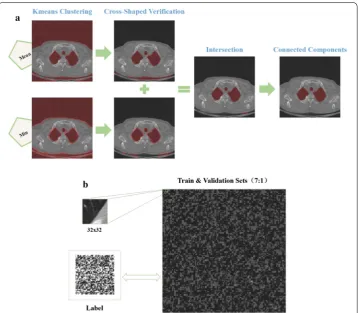
The complete procedure with corresponding results after each sub-step of generating the labeled dataset is illustrated in Fig. 1. At first, with all the 10,076,160 patches as input, the k-means clustering algorithm with two categories is performed twice using the mean and minimum intensity of the image patch, respectively. As shown in Fig. 1a, the lung parenchyma and the background air outside the human body have been grouped into one class of low intensity. Then, one technique named the cross-shaped verification is
Fig. 1 The generation of the labeled data. a The procedures and corresponding results after each sub-step. b
used to remove the group of patches of that background air. For each group of low inten-sity patch obtained in this step, we check whether there is at least a high inteninten-sity patch in all of its four directions (left, right, up, and down). Only if this assumption is true, the current low intensity patch will be kept and regarded as one of lung parenchyma, otherwise it will be discarded. The k-means clustering with mean intensity of patch and the cross-shaped verification possesses the ability to generate more accurate lung paren-chyma boundaries, but more patches are kept in the gap between human body and the scanner bed. The same process occurs in the opposite way in the case of using the mini-mum intensity. Hence we apply this kind of k-means clustering algorithm twice and take the intersection of the obtained volumes.
Subsequently, connected component analysis algorithm based on Max-Tree proposed by Fu et al. [34] is applied to extract the lung parenchyma. Furthermore, padding is per-formed to expand the 8 × 8 patch into 32 × 32 patch without overlapping so as to meet the image input demand of the next CNN training, as shown in Fig. 1b. It is worth men-tioning that the expansion of the 8 × 8 patch will result in image patch containing both lung parenchyma and body parts. However, the center of every patch is the lung paren-chyma. Finally a total of 60,864 patches of lung parenchyma are generated. Correspond-ingly, the same number of patches belonging to non-lung parenchyma is selected out randomly for the balance of two classes. The balance of the two classification classes is performed in the aim of eliminating the decline in testing accuracy caused by the imbal-ance of the training dataset.
A CNN model
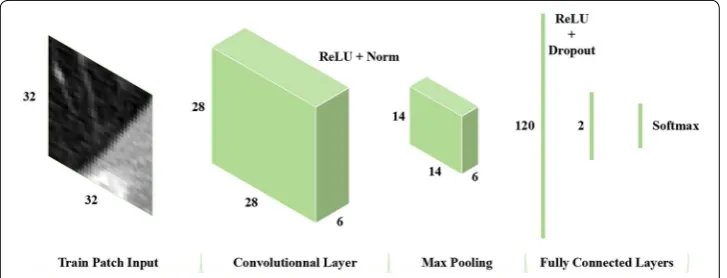
We proposed a simplified CNN model possessing the ability to differentiate the real lung parenchyma image patches from non-lung parenchyma image patches. The structure of this CNN network comprises an image input layer, a convolutional layer, a pooling layer and two fully connected layers with a Softmax layer. A detailed description of the above-mentioned CNN model is displayed in Fig. 2. Comparing with the well-known AlexNet structure comprising five convolutional layers, we just preserve one convolutional layer with six convolutional kernels to deal with the input set of image patches of 32 × 32. The single convolution layer is followed by rectified Linear Unit (ReLU) and normalization layers which helps accelerate the convergence of the stochastic gradient descent (SGD) and prevent overfitting as well. Then a MaxPooling layer, the first fully connected layer,
a dropout layer, ReLU layer, the second fully connected layer and Softmax layer follow, respectively. The first fully connected (FC) layer includes 120 neurons. The dropout layer helps in avoiding overfitting.
The segmentation using CNN
After splitting all the CT images for segmentation into patches of 32 × 32 using each voxel as the center point, they are input into the trained CNN. Simultaneously, each patch will be automatically given a label of 1 or 0, denoting lung parenchyma (LP) or non-lung parenchyma (NLP). The maximum connected component detection is done to extract the whole LP volume. Finally the hole in the LP volume is filled to achieve the final segmentation results of lung parenchyma.
Experiments and image data
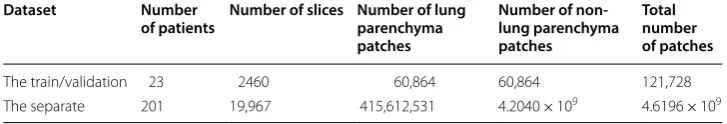
In the aim of implementing the machine learning-based framework proposed in this study, four main experiments have been conducted. The first experiment consists of determining the most appropriate patch size among different sizes including 64 × 64, 32 × 32, 16 × 16, 8 × 8, 4 × 4 and 2 × 2; during the stage of generating the labeled data-set of LP and NLP. The characteristics of the image patches and the computational time are assessed to determine the best patch size. The second experiment is the parameters optimization procedure of the CNN model; which will be described shortly in “CNN parameters optimization” section. The performance of the trained CNN model is tested in the third experiment. The experimental dataset used in the second and third experi-ments consists of 121,728 patches obtained from “The generation of the labeled data-set” section. The fourth experiment is performed using a separate dataset of 201 subjects diagnosed with lung cancer or chronic obstructive pulmonary disease (COPD) to fur-ther evaluate the performance of the trained CNN model. The details of the partition of the experimental dataset into training, validation and testing are given in Table 1.
All the experiments of this study were conducted under a Windows 7 on a workstation with CPU Intel Xeon E5-2620 v3 @2.40 GHz, GPU NVIDIA Quadro K2200 and 32 GB of RAM. The proposed CNN was implemented using the simplified AlexNet structure and the procedures of unsupervised clustering generation algorithm were implemented in MATLAB 2017a.
CNN parameters optimization
To the end of setting the best values of the CNN parameters, numerous experiments were conducted while evaluating its performance through comparing the achieved aver-age value of F-score (Favg) and the computational time of training of the training process.
Favg is defined as
Table 1 The details of the train/validation dataset and the separate dataset
Dataset Number
of patients Number of slices Number of lung parenchyma patches
Number of non-lung parenchyma patches
Total number of patches
The train/validation 23 2460 60,864 60,864 121,728
where Precisionnlp and Recallnlp represent the positive prediction rate and the sensitivity
of the class of non-lung parenchyma, respectively. Similarly, Precisionlp and Recalllp are
he positive prediction rate and the sensitivity of the class of lung parenchyma, respec-tively. Precision and Recall can be computed as
where TP is true positive, FP is false positive, and FN is false negative.
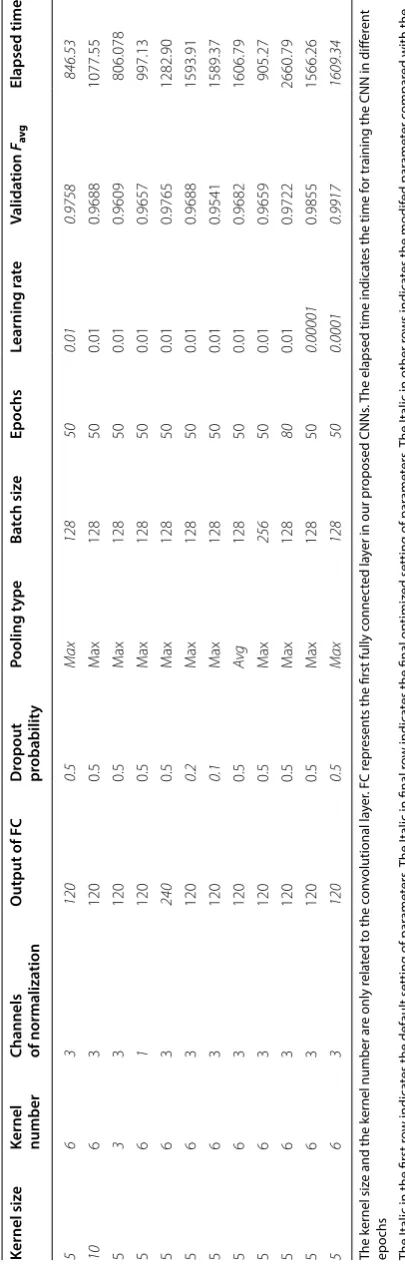
We varied up to 23 parameters during the training process of our CNN model, how-ever, only the variation of nine of those parameters had a significant effect on the clas-sification results. The default settings of these nine parameters can be determined as: the kernel size (5); the kernel number (6); the local response normalization layer (3); the output size of fully connected layer (120); the dropout probability (0.5); the pool-ing type (Max); the batch size (128); the number of epochs (50); the learnpool-ing rate (0.01). Using these default settings as the reference, we adjusted each parameter while keeping the others constant and investigated the variation of Favg and the elapsed time.
Specifi-cally, 11 cases were evaluated under the circumstances of the kernel size of 10, the kernel number of 3, the channels of normalization of 1, the output of FC of 240, the dropout probability of 0.2 and 0.1, the pooling type of Avg, the batch size of 256, the epochs of 80, the learning rate of 1 × 10⁻⁵ and 1 × 10⁻⁴.
Performance evaluation using cross-validation
A total of 121.728 image patches of 32 × 32 are divided into the training and validation datasets with a ratio of 7:1, and the 8-folder cross-validation is carried out. The relation-ship between the training accuracy and loss and the number of iterations is investigated. The receiver operating characteristic (ROC) curve is drawn and the area under the ROC curve (AUC) is calculated for the trained CNN model. The confusion matrix and six convolutional kernels are presented at last.
Performance evaluation using the separate dataset and manual segmentations
One separate dataset containing 201 cases of patients was collected to evaluate the robustness, efficiency and accuracy of the trained CNN model for lung parenchyma seg-mentation. Among them, nine cases are patients with COPD confirmed by the pulmo-nary function test, and 192 cases are with lung cancer confirmed by the histopathology examination. For the cases with lung cancer, 174 cases are acquired by CT scanner, 18 cases by PET/CT scanner, whose CT images have a circular field of view. The 19,967 image slices resulted from examining all the 201 patients’ image files have been split into 4.62 × 10⁹ image patches. The robustness is evaluated through the 201 cases data with different diseases (COPD or lung cancer) and acquired by different scanners (CT (1)
Favg==
Precisionnlp×Recallnlp
Precisionnlp+Recallnlp
+Precisionlp×Recalllp Precisionlp+Recalllp
(2)
Precision= TP
TP+FP
(3)
Recall= TP
and PET/CT). The accuracy is calculated through comparing the lung field segmenta-tion results achieved by the automated CNN model with that yielded by the manual and independent annotations of two experienced radiologists as the reference.
For a more comprehensive and clearer performance evaluation of the proposed machine learning based lung parenchyma segmentation method, four evaluation met-rics have been considered including: the Dice similarity coefficient (DSC), Hausdorff dis-tance, sensitivity, and specificity.
DSC is defined as
where VGT is the reference standard segmentation (ground truth) obtained by the
radi-ologists manually, Vtest is the segmentation by our proposed method.
Haussdorf distance (HD) is to measure how far apart the boundaries of our seg-mentation and reference (ground truth) are from each other. Let the real lung boundaries (ground truth) obtained by the radiologists and the segmentation by our proposed method be defined by VGT and Vtest, respectively. VGT comprises a set of points VGT(i)(i=1, 2. . . .n) and Vtest as well comprises a set of points Vtest(j)(j=1, 2. . . .n)
[35]. Hence, HD is defined as
Sensitivity is defined as TP/P, where P is the number of voxels in reference and TP is the number of voxels segmented correctly by the proposed method. Specificity is defined as TN/N, where N is the number of voxels not in reference, TN is the number of voxels correctly identified as non-lung parenchyma by the current method.
Results The patch size
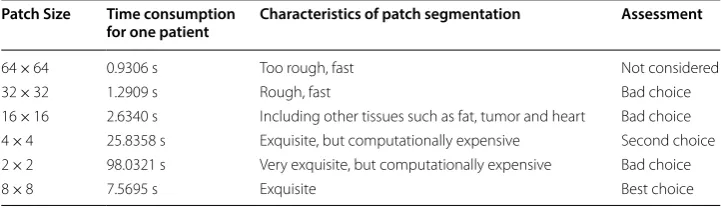
For different sizes of the image patch, the computational time, characteristics of seg-mentation, and the assessment are given in Table 2 and Fig. 3. The segmentation results obtained considering six different patch sizes after k-means clustering with the mean intensity of the patches for one subject with 126 slices are illustrated in Fig. 3. It can be found that the segmentation becomes more exquisite with the decrease of the patch size, (4)
DSC(VGT,Vtest)=2 VGT
Vtest
|VGT| + |Vtest|
(5)
HD(VGT,Vtest)=max
max
i∈VGT
min
j∈Vtest
i−j
, max
j∈Vtest
min
i∈VGT
i−j
Table 2 The assessment of patch size through the segmentation characteristics and time consumption
Patch Size Time consumption
for one patient Characteristics of patch segmentation Assessment
64 × 64 0.9306 s Too rough, fast Not considered
32 × 32 1.2909 s Rough, fast Bad choice
16 × 16 2.6340 s Including other tissues such as fat, tumor and heart Bad choice
4 × 4 25.8358 s Exquisite, but computationally expensive Second choice
2 × 2 98.0321 s Very exquisite, but computationally expensive Bad choice
while the computational time increases. Moreover, the accepted results can be obtained while the size is equivalent to or smaller than 8 × 8. The nodule and regions with high CT number are excluded from the lung parenchyma. Considering the tradeoff between the time-computation cost and the achieved segmentation results, the patch size of 8 × 8 is set as the most appropriate choice.
Optimization of the CNN parameters
Experiments were conducted considering the default settings of the nine parameters previously mentioned in “CNN parameters optimization” section whose numerical val-ues are shown in the first row of Table 3. The proposed system yielded a Favg validation
of 0.9758 and the elapsed time for completing the training and validation was 846.53 s. Using these settings as the reference, each parameter is adjusted while keeping the others constant and the variation of Favg and the elapsed time are evaluated. The optimization
of the network parameters through performing experiments while varying their values was conducted in the following manner. Doubling the size of the convolutional kernel from 5 × 5 to 10 × 10 led to the drop of Favg from 0.9758 to 0.9688 with an increase of the
elapsed time by 27%. Favg also decreases slightly for both cases of the kernel number of
3 and the local response normalization layer of 1. Doubling the output size of the fully connected layer from 120 to 240 led to a slight increase of Favg from 0.9758 to 0.9765,
meanwhile the network training time rises sharply to 1282.9 s. The dropout probability of 0.5 has been chosen to be the optimal because the Favg reached 0.9688 and 0.9541 for
a dropout probability of 0.2 and 0.1 respectively. In opposition to its usual effects on the training results, an increase of the batch size from 128 to 256 resulted in a diminishment
Table 3 P er formanc e of the pr op osed CNN s with diff er en t par amet ers The ker nel siz
e and the ker
nel number ar
e only r
ela
ted t
o the c
on
volutional la
yer
. FC r
epr
esen
ts the first fully c
onnec
ted la
yer in our pr
oposed CNNs
. T
he elapsed time indica
tes the time f
or tr
aining the CNN in diff
er
en
t
epochs The I
talic in the first r
ow indica
tes the default setting of par
amet
ers
. T
he I
talic in final r
ow indica
tes the final optimiz
ed setting of par
amet
ers
. T
he I
talic in other r
ow
s indica
tes the modif
ed par
amet
er c
ompar
ed with the
default setting
Kernel siz
e
Kernel number Channels of normaliza
of the Favg from 0.9758 to 0.9659. Similarly, an augmentation of the epoch’s number to 80
resulted in a decrease of the Favg value. Last but not least, the learning rate is a very
criti-cal parameter whose decrease can significantly increase the Favg value. Specifically, the
Favg reaches 0.9855 and 0.9917 for the learning rate of 0.00001 and 0.0001, respectively.
The final optimized parameters employed in our trained CNN model can be found in the last row of Table 3. In summary, the relationships between Favg and most training
parameters are not monotonic, and there exists an optimum condition for exploration.
Performance evaluated using cross-validation
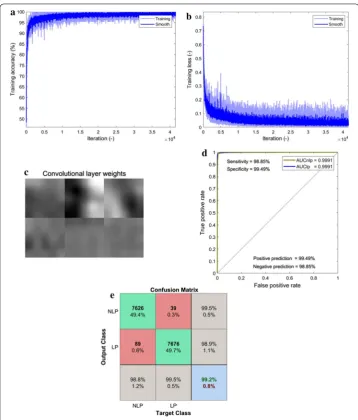
Using the hyper-parameter settings recorded in the last row of Table 3, the train-ing accuracy and loss as the function of iterations number are presented in Fig. 4a, b respectively. The training accuracy and loss reach 99.08% and 0.0294, respectively,
Fig. 4 Performance of the trained CNN for lung parenchyma segmentation. a The training accuracy. b
The training loss. c The six convolutional kernels. d The receiver operating characteristic (ROC) curve. e The
while the number of iteration reaches to 4.15 × 10⁴, indicating the convergence without overfitting during the training process of our designed CNN model. The visualization of the six kernels of the convolutional layer after the lung parenchyma segmentation process is displayed in Fig. 4c. It is easily noticeable that the image pat-terns are very smooth and there is absence of noises and artifacts. Thus, the network parameters have been appropriately chosen leading to great classification perfor-mance. In addition, the ROC curve of the trained CNN is plotted in Fig. 4d repre-sents, which clearly displays that the area under the curve (AUC) is up to 0.9991 for both lung parenchyma and non-lung parenchyma categories. Meanwhile, the confu-sion matrix shown in Fig. 4e indicates a sensitivity of 98.8%, a positive prediction of 99.5%, a specificity of 99.5%, a negative prediction of 98.9%, and an accuracy of 99.2%.
Performance evaluated using the separate dataset and manual segmentations
Comparing the segmentation results achieved by CNN model with those yielded by the two radiologists for all the 402 slices (manual segmentations), the averaged DSC, HDavg,
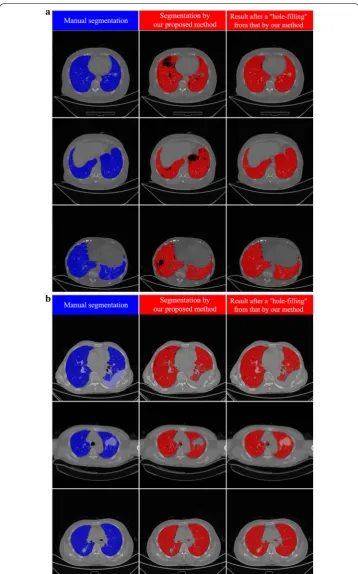
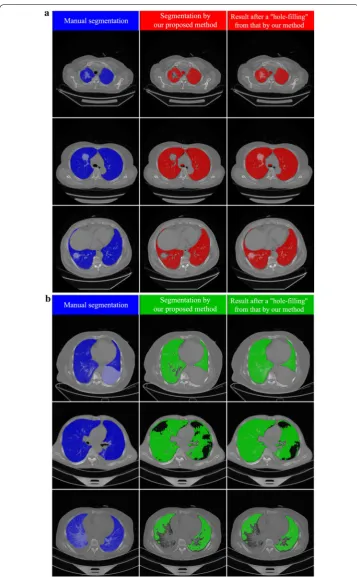
sensitivity, specificity reach 0.968/0.966, 1.40/1.48 mm, 0.909/0.906, and 0.999/0.999 (to radiologist I/to radiologist II), respectively. For each slice with 512 × 512 voxels, the averaged computational time to segment the region of lung parenchyma is 10.75 s. For a visual illustration of these performances, Figs. 5, 6 displays the segmentation results achieved by our proposed CNN model and manual segmentation on a separate dataset. From left to right, the first, second and third columns represent the segmentation by the radiologists, the segmentation by our CNN model and the hole-filling result performed on our CNN model result, respectively.
Figure 5a presents three segmentation instances of patients suffering from COPD at axial slices. It is found that most of the lung parenchyma regions have been identified and segmented with satisfactory performance. In the second column of Fig. 5a which represents the result of our CNN model, some patches of pulmonary bulla are not well segmented. After an ordinary hole-filling operation, the complete lung field can be obtained, as shown in the third column of Fig. 5a. Besides, there are other three seg-mentation results of subjects with lung cancer shown in Fig. 5b. Their lung parenchyma can be well distinguished from lung tumor, pleural effusion and other backgrounds. The tumor region embedded in the lung field can be extracted easily through comparing the results before and after hole-filling. Additionally, Fig. 6a demonstrates three more seg-mentation cases of subjects with lung cancer where the CT images are acquired by PET/ CT scanners. One can find that the present CNN model also produces a good effect on lung parenchyma segmentation though the contrast and lung attenuation coefficient are quite different between images acquired by CT and PET/CT scanners.
Fig. 5 Examples of segmentation at axial slices (In each sub-figure, there are three columns: the left the left column shows the results of manual segmentation of lung field including both lung parenchyma and lesions; the middle column presents the results of segmentation of lung parenchyma by our proposed method; the
right column shows the results after a “hole-filling” operation from those by our method.). a Three example
Fig. 6 Examples of segmentation at axial slices (In each sub-figure, there are three columns: the left the left column shows the results of manual segmentation of lung field including both lung parenchyma and lesions; the middle column presents the results of segmentation of lung parenchyma by our proposed method; the
right column shows the results after a “hole-filling” operation from those by our method.). a Three example
slices (three rows) for subjects with lung cancer (PET-CT scanner). b Three example slices (three rows) for
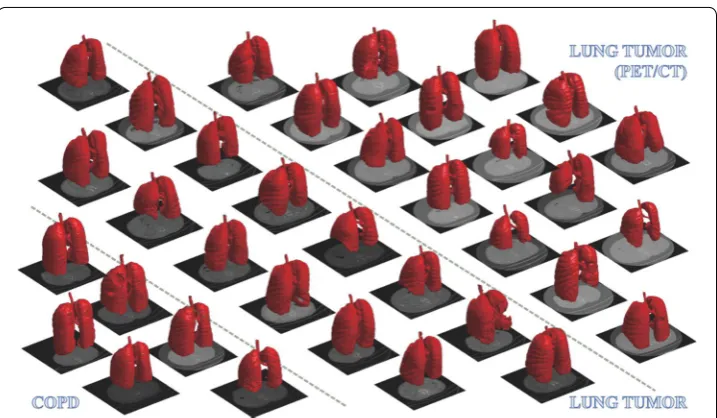
the inflammatory lung cancer cannot be segmented out because its CT features are completely different from those of lung parenchyma. Furthermore, a 3D visualization of some segmentation results is displayed in Fig. 7. For most cases, the segmented lung sur-face is smooth. There can also be seen some cavities or uncompleted lung fields resulted from the presence of the pleural effusion, pulmonary bulla and lung tumor near the boundary of the lung field.
In sum, from the averaged DSC (0.968/0.966), HDavg (1.40/1.48 mm), sensitivity
(0.909/0.906), specificity (0.999/0.999) yielded by our proposed CNN model and the visualization of the segmentation results shown in Figs. 5, 6 and 7, the proposed deep learning based approach achieved very satisfactory segmentation performance.
Discussions
Semi-supervised method of generating annotations
One semi-supervised method of generating annotations has been proposed and imple-mented in the current study. Specifically, dual unsupervised k-means clustering, a cross-shaped verification, an intersection operation, a connected component analysis and a patch expansion are successively executed. It is well known that most of the supervised machine learning (e.g., SVM, random forest, CNN) methods require a huge amount of labeled or annotated data usually produced by experts manually. For example, 12,481 lesion patches and 16,741 normal patches are derived from the manually segmented regions in the study by Yao et al. [28]. In the experiments conducted by Song et al. [31], a total of 2062 2-D annotated ROIs were manually drawn by two radiologists. This manual annotation process is always time-consuming and high-costing. In this study we have proposed a semi-supervised method for generating annotated image patches which could effectively and efficiently help radiologists and researchers get rid of the tedious manual annotations. However, the comparison of this method with the manual annota-tions conducted by the medical experts remains unexplored.
A simplified or deep CNN, and parameter optimization
We have proposed and implemented a simplified CNN model consisting of only a con-volutional layer, a pooling layer and two fully connected layers with a Softmax layer. Comparing with LeNet [36] of two convolutional layers, AlexNet [37] of eight learned layers, and VGG-VD [38] of 19 layers, our CNN model is very “shallow”. However, its sensitivity of 98.9% makes the exploration of more deep CNN models not so urgent. The high sensitivity clearly justifies the ability of the proposed framework to segment lung parenchyma without many difficulties. For the more complicated lesions, the deep CNN is required because the network with more depth can better approximate the tar-get function with high nonlinearity and achieve better feature representations [39]. For instance, Anthimopoulos et al. had proposed one deep CNN with five convolutional lay-ers to do lung pattern classification for intlay-erstitial lung diseases [32]. Recently Shin et al. [40] have explored three CNN architectures of CifarNet, AlexNet and GoogLeNet using lymph node (LN) detection and interstitial lung disease (ILD) classification.
As done in some previous CNN studies [32, 40], the optimization of the CNN hyper-parameters is critical and inevitable. Most trends of influence of hyper-hyper-parameters on the training accuracy observed in the current study accord with previous study. More specifically, as the common choice for most CNNs, the maximum pooling yields high accuracy and is much faster in terms of convergence. It is found that the dropout and normalization are effective to accelerate the convergence. Small kernel size of 5 × 5 is better than 10 × 10. Even smaller kernels have been employed, e.g., 3 × 3 kernel in VGG-net, 2 × 3 kernel in work by Anthimopoulos et al. [32]. A relatively larger number of con-volutional kernels and output units of FC, and a relatively smaller batch size and number of epochs lead to high accuracy. It is of great importance to mention that the learning rate is a very important parameter whose value needs to assign with special attention and according to the size of the objects of interest contained in the image patches to be classified.
The proposed method comparison with the traditional methods
To the end of detecting and analyzing the various lung diseases, numerous lung segmen-tation methods have been proposed. Given the wide range of lung lesions, the existing methods aimed to solve different problems and they have been implemented on differ-ent image types acquired from various databases. Thus, it is quite challenging to repro-duce these algorithms as well as to collect the dataset used in their experiments.
the CNN model while the iteration, improved Ostu, watershed and region growth meth-ods yielded an adaptability of 83.33%, 83.68%, 62.5% and 91.32%, respectively. The itera-tion and improved Ostu methods failed to segment all the input images because of the presence of images whose cylinder-shaped background CT value and injected contrast agent value is always lower than − 1024HU and higher than 1024HU, respectively. The watershed method could not segment all the images due to the fact that the boundary of lung parenchyma is not stable and is easier to leak into the human body. Therefore, the proposed method is superior to the state-of-the-art lung segmentation methods both effectively and efficiently.
Parenchyma at first, then the whole lung analysis in a unified framework
To the best of our knowledge, this is the first study conducted on extracting lung paren-chyma from CT images using a fully machine learning-based framework, rather than the whole lung or various lung pathologies. This idea originated from one previously ignored fact that lung parenchyma is quite different from lung pathologies [11, 12, 41]. The lung parenchyma owns commonalities across subjects, diseases and CT scanners although lung pathologies exist under various appearances. An accurate segmentation of lung parenchyma may have potential to help locate and analyze the lung lesions. Current framework is compatible to further segmentation of various lesions, so the whole lung analysis might be done in a unified framework.
Our method naturally belongs to the bottom-up strategy in which only local informa-tion of the shape, texture and intensity within a 32 × 32 patch is considered. The ROI is larger than the thresholding and region-based approaches. Multiple scale technique (e.g., using the patches in different sizes simultaneously) may further improve the per-formance. Comparing to the top-down strategy (the model-based and neighboring anatomy-guided methods), our method presents lower computational time and can successfully segment lung with a certain level of abnormities. Last, not the least, the CNN-based methods get rid of the work of feature engineering. All the features for clas-sification are learned from the training data and no handcrafted feature is necessary [42].
Pixel-wise or patch-wise segmentation
Using the proposed CNN model, the average lung parenchyma regions segmentation time is estimated at 10.75 s for each slice with 512 × 512 voxels, which is a pixel-wise segmentation. The computational time can be shortened by using a multiple-core or GPU provided computer. Another alternative might be the patch-wise segmentation. Table 4 Comparison of the proposed method with the traditional methods
Methods DSC (vs observer
A) (%) DSC (vs observer B) Average DSC Self-adaptability
Iteration 95.40 95.22 95.31 83.33
Improved Ostu 95.35 95.18 95.27 83.68
Watershed 94.72 94.49 94.61 62.50
Region growing 96.65 96.50 96.58 91.32
For instance, one can split the CT images into 8 × 8 patches, generate 32 × 32 patches, and input them into the trained CNN to realize the segmentation of lung parenchyma, whose average computational time can be shorten to 0.16 s for each slice. Figure 8 gives some relevant examples. The lung parenchyma regions can also be segmented with rea-sonable accuracy for subjects with COPD (the first and second columns) and lung can-cer (the third to sixth columns). The images in the third and fourth columns of Fig. 8 are obtained using CT scanners, and the others in the fifth and sixth columns are obtained from PET/CT scanners. The boundaries between lung parenchyma and lung tumor, pleural effusion, pulmonary bulla and other backgrounds can be depicted well. There-fore, our proposed segmentation framework owns the good feature of suitability of the multiple-resolution strategy.
Although our proposed segmentation method achieved quite satisfactory perfor-mance, it presents some limitations that are worth mentioning. First, the size of the patches utilized in our CNN model is fixed as 32 × 32. The effect of the patch size on the CNN performance is not investigated. Moreover, ensemble of CNN models fed with patches of different sizes may help integrate multilevel features [43]. Second, some state-of-art CNN models such as Fast RCNN and Mask RCNN have presented excel-lent performance for the objection detection and segmentation [44, 45]. However, their performances on the dataset generated by our clustering based method remain unex-plored. In other words, these CNN models may do well in the lung parenchyma seg-mentation. Third, though we had built up one fully machine learning-based framework, some instances including segmentations of pulmonary nodules, consolidation, and pleu-ral effusion need to be developed. Combination of segmentations of lung parenchyma and various lesions will demonstrate the power of our fully machine learning-based framework.
Conclusions
A novel machine learning-based method has been presented to segment lung paren-chyma from CT images automatically. To the best of our knowledge, it is the first study conducted on extracting lung parenchyma from CT images, rather than the whole lung or various lung pathologies using a fully machine learning-based framework. Moreo-ver, a clustering method is used to automatically generate huge amount of annotated data. This clustering algorithm can properly and efficiently replace the tedious manual
annotations which could significantly reduce the workload of the radiologists leading to a more accurate and faster diagnosis of the diseases. The CNN parameters have been carefully optimized through extensive experiments. Through the trained CNN, the voxel-wise identification of lung parenchyma can be achieved without any feature engi-neering work. Besides the cross-validation, an independent dataset of more than 200 subjects with lung cancer or COPD, acquired by CT or PET/CT scanners have been used to evaluate the performances of the CNN model. The quantitative results show that our method can segment lung parenchyma from images acquired through differ-ent imaging modalities (i.e., CT and PET/CT) with very satisfactory performance. The proposed machine learning-based framework may have the potential to help locate and analyze the lung lesions.
Authors’ contributions
MX and SQ: proposed the idea, performed experiments, analyzed the data, made discussions and composed the manu-script together with YY (Yong Yue), YT and LX. YY (Yudong Yao) and WQ: directed the experiments and made discussions. All authors read and approved the final manuscript.
Author details
1 Sino-Dutch Biomedical and Information Engineering School, Northeastern University, No. 195 Chuangxin Avenue, Hunnan District, Shenyang 110169, China. 2 Key Laboratory of Medical Image Computing of Northeastern University (Ministry of Education), Shenyang, China. 3 Department of Radiology, Shengjing Hospital of China Medical University, No. 36 Sanhao Street, Shenyang 110004, China. 4 Department of Electrical and Computer Engineering, Stevens Institute of Technology, Hoboken, NJ 07030, USA. 5 College of Engineering, University of Texas at El Paso, 500 W University, El Paso, TX 79902, USA.
Acknowledgements
The authors would like to thank Mr. Patrice Monkam for his valuable help in the writing of this manuscript.
Competing interests
The authors declare that they have no competing interests.
Availability of data and materials
The datasets used and/or analysed during the current study are available from the corresponding author on reasonable request.
Consent for publication
All subjects gave written informed consent in accordance with the Declaration of Helsinki. Ethics approval and consent to participate
This study was approved by the Medical Ethics Committee of Shengjing Hospital of China Medical University and was in accordance with the 1964 Helsinki declaration and its later amendments or comparable ethical standards. All subjects gave written informed consent in accordance with the Declaration of Helsinki.
Funding
This study was supported by the National Natural Science Foundation of China under Grant (Grant number: 81671773, 61672146) and the Fundamental Research Funds for the Central Universities (N172008008).
Publisher’s Note
Springer Nature remains neutral with regard to jurisdictional claims in published maps and institutional affiliations.
Received: 23 July 2018 Accepted: 19 December 2018
References
1. Jodas DS, Pereira AS, Tavares JMRS. A review of computational methods applied for identification and quantifi-cation of atherosclerotic plaques in images. Expert Syst Appl. 2016;46:1–14.
2. Ma Z, Tavares JMRS, Jorge RN, Mascarenhas T. A review of algorithms for medical image segmentation and their applications to the female pelvic cavity. Comput Methods Biomech Biomed Eng. 2010;13(2):235–46.
3. Ma Z, Tavares JMRS, Jorge RMN. A review on the current segmentation algorithms for medical images. In: 1st international conference on imaging theory and applications (IMAGAPP), Portugal, 2009, pp. 135–40. ISBN: 978-989-8111-68-5.
5. Oliveira RB, Filho ME, Ma Z, Papa JP, Pereira AS, Tavares JMRS. Computational methods for the image segmenta-tion of pigmented skin lesions: a review. Comput Methods Programs Biomed. 2016;131:127–41.
6. Rebouças Filho PP, da Silva Barros AC, Ramalho GL, Pereira CR, Papa JP, de Albuquerque VH, Tavares JMRS. Auto-mated recognition of lung diseases in CT images based on the optimum-path forest classifier. Neural Comput Appl. 2017. https ://doi.org/10.1007/s0052 1-017-3048-y.
7. Valente IRS, Cortez PC, Neto EC, Soares JM, de Albuquerque VHC, Tavares JMRS. Automatic 3D pulmonary nod-ule detection in CT images: a survey. Comput Methods Programs Biomed. 2016;124:91–107.
8. Rebouças Filho PP, Cortez PC, da Silva Barros AC, Albuquerque VHC, Tavares JMRS. Novel and powerful 3D adaptive crisp active contour method applied in the segmentation of CT lung images. Med Image Anal. 2017;35:503–16.
9. Ju W, Xiang D, Zhang B, Wang L, Kopriva I, Chen X. Random walk and graph cut for co-segmentation of lung tumor on PET-CT-images. IEEE Trans Image Process. 2015;24(12):5854–67.
10. Gillies RJ, Kinahan PE, Hricak H. Radiomics: images are more than pictures, they are data. Radiology. 2016;278(2):563–77.
11. Mansoor A, Bagci U, Xu ZY, Foster B, Kenneth NO, Jason ME, Anthony FS, Jayaram KU, Daniel JM. A generic approach to pathological lung segmentation. IEEE Trans Med Imaging. 2014;33(12):2293–310.
12. Mansoor A, Bagci U, Foster B, Xu ZY, Papadakis ZGZ, Folio LR, Udupa JK, Mollura DJ. Segmentation and image analysis of abnormal lungs at CT: current approaches, challenges, and future trend. RadioGraphics. 2015;35(4):1056–76.
13. Hansell DM, Bankier AA, MacMahon H, McLoud TC, Müller NL, Remy J. Fleischner society: glossary of terms for thoracic imaging. Radiology. 2008;246(3):697–722.
14. Hu S, Hoffman EA, Reinhardt JM. Automatic lung segmentation for accurate quantitation of volumetric X-ray CT images. IEEE Trans Med Imaging. 2001;20(6):490–8.
15. Wang J, Li FQ. Automated segmentation of lungs with severe interstitial lung disease in CT. Med Phys. 2009;36(10):4592–9.
16. Nakagomi K, Shimizu A, Kobatake H, Yakami M, Fujimoto K, Togashi K. Multi-shape graph cuts with neigh-bor prior constraints and its application to lung segmentation from a chest CT volume. Med Image Anal. 2013;17(1):62–77.
17. Dai S, Lu K, Dong J, Zhang Y, Chen Y. A novel approach of lung segmentation on chest CT images using graph cuts. Neurocomputing. 2015;168:799–807.
18. Grady L. Random walks for image segmentation. IEEE Trans Pattern Anal Mach Intell. 2006;28(11):1768–83. 19. Shi Z, Ma J, Zhao M, Liu Y, Feng Y, Zhang M, He L, Suzuki K. Many is better than one: an integration of
mul-tiple simple strategies for accurate lung segmentation in CT Images. Biomed Res Int. 2016. https ://doi. org/10.1155/2016/14804 23.
20. Li B, Christensen GE, Hoffman EA, Mclennan G, Reinhardt JM. Establishing a normative atlas of the human lung: intersubject warping and registration of volumetric CT images. Acad Radiol. 2003;10(3):255–65.
21. Sluimer I, Prokop M, Ginneken BV. Toward automated segmentation of the pathological lung in CT. IEEE Trans Med Imaging. 2005;24(8):1025–38.
22. Sun S, Bauer C, Beichel R. Automated 3-D segmentation of lungs with lung cancer in CT data using a novel robust active shape model approach. IEEE Trans Med Imaging. 2012;31(2):449–60.
23. Zhou J, Yan Z, Lasio G, Huang J, Zhang B, Sharma N, Prado K, D’Souza W. Automated compromised right lung segmentation method using a robust atlas-based active volume model with sparse shape composition prior in CT. Comput Med Imaging Graph. 2015;46:47–55.
24. Pu J, Roos J, Yi CA, Napel S, Rubin GD, Paik DS. Adaptive border marching algorithm: automatic lung segmenta-tion on chest CT images. Comput Med Imaging Graph. 2008;32(6):452–62.
25. Sluimer I, Schilham A, Prokop M, Van Ginneken B. Computer analysis of computed tomography scans of the lung: a survey. IEEE Trans Med Imaging. 2006;25(4):385–405.
26. Van Rikxoort EM, Van Ginneken B. Automated segmentation of pulmonary structures in thoracic computed tomography scans: a review. Phys Med Biol. 2013;58(17):R187–220.
27. Xu Y, Sonka M, McLennan G, Guo J, Hoffman EA. MDCT-based 3-D texture classification of emphysema and early smoking related lung pathologies. IEEE Trans Med Imaging. 2006;25(4):464–75.
28. Yao J, Dwyer A, Summers RM, Mollura DJ. Computer-aided diagnosis of pulmonary infections using texture analysis and support vector machine classification. Acad Radiol. 2011;18(3):306–14.
29. Korfiatis PD, Karahaliou AN, Kazantzi AD, Kalogeropoulou C, Costaridou LI. Texture-based identification and characterization of interstitial pneumonia patterns in lung multidetector CT. IEEE Trans Inf Technol Biomed. 2010;14(3):675–80.
30. Bagci U, Yao J, Wu A, Caban J, Palmore TN, Suffredini AF, Aras O, Mollura DJ. Automatic detection and quantifica-tion of tree-in-bud (TIB) opacities from CT scans. IEEE Trans Biomed Eng. 2012;59(6):1620–32.
31. Song Y, Cai W, Zhou Y, Feng DD. Feature-based image patch approximation for lung tissue classification. IEEE Trans Med Imaging. 2013;32(4):797–808.
32. Anthimopoulos M, Christodoulidis S, Ebner L, Christe A, Mougiakakou S. Lung pattern classification for intersti-tial lung diseases using a deep convolutional neural network. IEEE Trans Med Imaging. 2016;35(5):1207–16. 33. Tulder GV, Bruijne MD. Combining generative and discriminative representation learning for lung CT analysis
with convolutional restricted boltzmann machines. IEEE Trans Med Imaging. 2016;35(5):1262–72.
34. Fu Y, Chen X, Gao H. A new connected component analysis algorithm based on max-tree. In: 2009 eighth IEEE international conference on dependable, autonomic and secure computing, Chengdu. 2009. pp. 843–4. https :// doi.org/10.1109/dasc.2009.150.
• fast, convenient online submission
•
thorough peer review by experienced researchers in your field
• rapid publication on acceptance
• support for research data, including large and complex data types
•
gold Open Access which fosters wider collaboration and increased citations maximum visibility for your research: over 100M website views per year
•
At BMC, research is always in progress.
Learn more biomedcentral.com/submissions
Ready to submit your research? Choose BMC and benefit from: 36. LeCun Y, Bottou L, Bengio Y, Haffner P. Gradient-based learning applied to document recognition. IEEE.
1998;86(11):2278–324.
37. Krizhevsky A, Sutskever I, Hinton GE. ImageNet classification with deep convolutional neural networks. In: Inter-national conference on neural information processing systems, vol. 25. 2012. pp. 1097–105
38. Simonyan K, Zisserman A. Very deep convolutional networks for large-scale image recognition. Comput Sci. 2014.
39. LeCun Y, Bengio Y, Hinton G. Deep learning. Nature. 2015;521(7553):436–44.
40. Shin HC, Roth HR, Gao M, Lu L, Xu Z, Nogues I, Yao J, Mollura D, Summers RM. Deep convolutional neural net-works for computer-aided detection: CNN architectures, dataset characteristics and transfer learning. IEEE Trans Med Imaging. 2016;35(5):1285–98.
41. Yao J, Bliton J, Summers R. Automatic segmentation and measurement of pleural effusions on CT. IEEE Trans Biomed Eng. 2013;60(7):1834–40.
42. Ravi D, Wong C, Deligianni F, Berthelot M, Andreu-Perez J, Lo B, Yang GZ. Deep learning for health informatics. IEEE J Biomed Health Inform. 2017;21(1):4–21.
43. Dou Q, Chen H, Yu L, et al. Multilevel contextual 3-D CNNs for false positive reduction in pulmonary nodule detec-tion. IEEE Trans Biomed Eng. 2016;64(7):1558–67.
44. Girshick R. Fast R-CNN. Comput Sci. 2015.