Detection of pulmonary ground‑glass
opacity based on deep learning computer
artificial intelligence
Wenjing Ye
1†, Wen Gu
1†, Xuejun Guo
1*, Ping Yi
2*, Yishuang Meng
2, Fengfeng Han
1, Lingwei Yu
3, Yi Chen
1,
Guorui Zhang
1and Xueting Wang
4Background
Pulmonary ground-glass opacity (GGO) is defined as a hazy opacity that does not obscure the underlying bronchial structures or pulmonary vessels on high-resolution computed tomography [1]. GGOs can be observed in benign conditions, such as focal interstitial fibrosis, inflammation, and hemorrhage; preinvasive lesions, such as atypi-cal adenomatous hyperplasia and adenocarcinoma in situ; and malignancies, such as minimally invasive adenocarcinoma and lepidic-predominant invasive adenocarcino-mas [2]. Lung adenocarcinoma is the most common histologic subtype of lung cancer and shows high heterogeneity at the histological and cellular levels [3]. Patients with
Abstract
Background: A deep learning computer artificial intelligence system is helpful for early identification of ground glass opacities (GGOs).
Methods: Images from the Lung Image Database Consortium and Image Database
Resource Initiative (LIDC-IDRI) database were used in AlexNet and GoogLeNet to detect pulmonary nodules, and 221 GGO images provided by Xinhua Hospital were used in ResNet50 for detecting GGOs. We used computed tomography image radial reor-ganization to create the input image of the three-dimensional features, and used the extracted features for deep learning, network training, testing, and analysis.
Results: In the final evaluation results, we found that the accuracy of identification of lung nodule could reach 88.0%, with an F-score of 0.891. In terms of performance and accuracy, our method was better than the existing solutions. The GGO nodule clas-sification achieved the best F-score of 0.87805. We propose a preprocessing method of red, green, and blue (RGB) superposition in the region of interest to effectively increase the differentiation between nodules and normal tissues, and that is the innovation of our research.
Conclusions: The method of deep learning proposed in this study is more sensitive than other systems in recent years, and the average false positive is lower than that of others.
Keywords: Pulmonary nodule, Ground-glass opacity, Deep learning, Artificial intelligence, Computer-aided diagnosis
Open Access
© The Author(s) 2019. This article is distributed under the terms of the Creative Commons Attribution 4.0 International License (http://creativecommons.org/licenses/by/4.0/), which permits unrestricted use, distribution, and reproduction in any medium, provided you give appropriate credit to the original author(s) and the source, provide a link to the Creative Commons license, and indicate if changes were made. The Creative Commons Public Domain Dedication waiver ( http://creativecommons.org/publicdo-main/zero/1.0/) applies to the data made available in this article, unless otherwise stated.
RESEARCH
*Correspondence: [email protected]. cn; [email protected]
†Wenjing Ye and Wen Gu
contributed equally to this work
1 Department of Respiratory
Medicine, Xinhua Hospital, School of Medicine, Shanghai Jiao Tong University, Shanghai 200092, China
2 School of Electronic
lung adenocarcinoma are usually diagnosed when they are in the advanced stages, and median survival time after diagnosis is usually less than 1 year [4]. The extent of a malignant GGO correlates with the prognosis after surgical resection. The computed tomography (CT) value of GGOs is always lower than that of blood vessels; therefore, GGOs may not always be obvious on CT images, and they may be missed. The rec-ognition of GGO is based on a subjective assessment of lung attenuation at CT, but observation of pulmonary nodules by doctors is labor-intensive and time-consuming, and because of personal differences, the results of examination may often be different.
President Obama proposed the “precision medicine plan” in his State of the Union address in 2015 [5]. Precision medicine is a new medical concept and the model is based on individualized medical treatment; this concept has been spurred by the rapid progress of genome sequencing technology and the cross application of biologi-cal information and large data science. This is a new emerging field of medicine. With the advent of “big data”, more accurate diagnosis and identification of lung nodules, especially GGOs, is possible. It is now feasible to use medical data for diagnosis and treatment of lung cancer; this could greatly improve the survival rate of lung cancer patients.
The principle of computer-aided detection (CAD) includes applying a mathemati-cal model and data programming to medimathemati-cal diagnosis. It has the ability to quickly (in near real-time) perform analytical computations on digital information; moreover, the errors with manual operation due to fatigue and individual judgment differences are avoided. Through imaging, computer analysis, and calculation, CAD has various applications such as diagnosis of breast lesions, CT virtual colonoscopy, diagnosis of liver disease, and diagnosis of brain tumors on magnetic resonance imaging. In recent years, there has been some progress in CAD technology with regard to detecting lung nodules on CT images [6]. Deep reinforcement learning combines the perceptive abil-ity of deep learning with the decision-making abilabil-ity of intensive learning. It is a form of artificial intelligence that is closer to the human thought pattern. At present, deep learning is being used for lesion classification, segmentation, and recognition [7, 8].
Artificial intelligence is an important branch of computer science. It is regarded as one of the three leading technologies in the world. The main research fields of artifi-cial intelligence include machine perception, machine thinking, and machine learning and behavior. Deep learning is an important emerging field of artificial intelligence in recent years that has seen much new advancement in recent times. Deep learn-ing allows computational models that are composed of multiple processlearn-ing layers to learn representations of data with multiple levels of abstraction. It discovers intricate structure in large data sets by using the back propagation algorithm to indicate how a machine should change its internal parameters that are used to compute the rep-resentation in each layer from the reprep-resentation in the previous layer. Deep learn-ing can extract features from trainlearn-ing images to improve the accuracy of prediction [9–11].
Methods
Data sources
We used the Lung Image Database Consortium and Image Database Resource Ini-tiative (LIDC-IDRI) database as the source of pulmonary nodule data. This database has the largest number of public lung images, and contains complete lung CT image slices and the specific annotation information of all nodules in image slices from 1007 patients. The LIDC-IDRI database was collected and published by the Ameri-can National Cancer Institute to serve as an international research resource to aid research of early lung cancer [12]. Each patient has an eXtensible Markup Language (XML) format file. These files contain detailed information regarding the number of pulmonary nodules, their location, and characteristics, as interpreted by four radi-ologists. The characteristics deemed appropriate for diagnosis of pulmonary nod-ules include subtlety, internal structure, calcification, sphericity, margin, lobulation, spiculation, texture, and malignancy [13]. LIDC–IDRI includes all types of pulmonary nodules, such as solid nodules, part-solid nodules, and ground glass nodules. This database was used by the computer for the deep learning process to identify nodules.
For our study, all the GGO images in the database were extracted based on the characteristics of internal structure and texture [13]. Besides, Xinhua Hospital also provided 221 GGO images of 154 patients from 2016 to 2017 to expand the sample size. The cases of GGOs provided by Xinhua Hospital were identified and confirmed by two radiologists and two respiratory physicians, to ensure accuracy.
Pulmonary region extraction
On the CT image, the pulmonary parenchyma includes the bronchus and bronchoal-veolar structures. We analyzed CT slices to identify pulmonary nodules; therefore, we only focused on the lung parenchyma, and not on the external contour. In order to minimize the error of the external contour on the experimental results, the lung parenchyma was extracted by threshold binarization, extraction of the maximum connected component, and separation of the adhesions between the pulmonary nod-ules and pleura and the pulmonary contour by means of corrosion (Fig. 1). Only the lung parenchyma was retained for subsequent analysis.
Nodule extraction
After analysis and extraction of the pulmonary parenchyma, we could determine the position of the candidate nodule. Taking the centroid location as the center, we cut out 64 * 64 small blocks from the lung parenchyma, which were regarded as the regions of interest (ROIs) (Fig. 2).
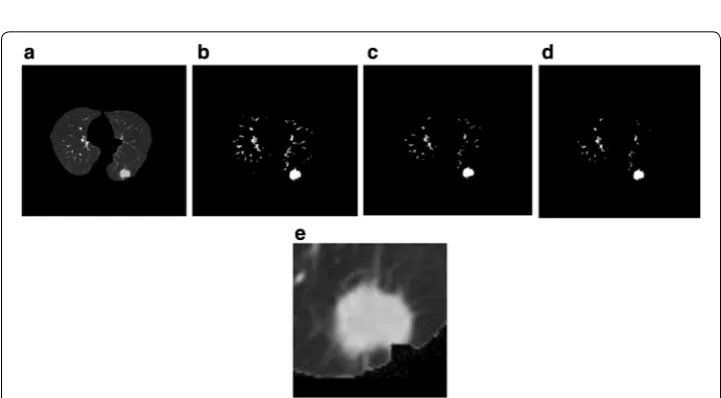
ROI superposition
extracted from the initial CT slice, the three ROI pieces were superimposed on red, green, and blue channels (RGB), respectively, and pseudo color images were formed. Because of the spheroidal characteristics of pulmonary nodules, the three consecutive slices could be approximately overlapped, and the superposed RGB images were also spherical. Normal tissues, such as blood vessels, were seen as longitudinal stripes, and most of them were not perpendicular to the horizontal surface; therefore, they had a distinct RGB change after superposition (Fig. 3). After RGB channel superpo-sition of the ROI, we could see the longitudinal trend of some tissues on 2D image. This method significantly enhanced the differentiation between pulmonary nodules and normal tissue.
Fig. 1 Steps of pulmonary parenchyma extraction. a Original CT image; b binarization of the CT image; c
preliminary extraction of pulmonary contour; d filling airways; e contours corrosion; f contour mending and expansion; g pulmonary masking; h pulmonary parenchyma image
Deep learning
In this study, we used AlexNet [14] and GoogLeNet [15] to detect pulmonary nod-ules, and ResNet50 [16] to detect GGOs. Convolutional architecture for fast feature embedding (CAFFE) [17] was used as the framework for deep learning; it was devel-oped by Berkeley Vision and Learning Center. CAFFE has the advantages of fast oper-ation and high extensibility. The operating system was CentOS 7.3 and the GPU video card used was GeForce GTX 1080 N (NVIDIA, Santa Clara, CA).
Deep learning of pulmonary nodules
We used the LIDC–IDRI database as a sample of CT slices for deep learning training. We used more than 10,000 ROI pseudo color images of pulmonary nodules extracted from the CT slices of 800 patients and about 12,000 ROI pseudo color pieces of nor-mal pulmonary tissue as a training sample set. After we achieved a prediction model through deep learning training, another 176 patients’ CT images from the training sample set were used as the testing sample set. There were 321 pulmonary nodules in the testing sample set.
Deep learning of GGOs
We extracted 1293 ROI pictures of GGOs from the LIDC–IDRI database based on nodule characteristics in the XML files and confirmation by two radiologists and two respiratory physicians. Of the 1293 samples of GGOs, 1000 ROI pictures were placed in the training set and 293 in the testing set. Because of the small sample size of GGOs in the LIDC–IDRI, Xinhua Hospital also provided another 221 pictures of GGOs from 154 patients to expand the training set. Finally, there were 1221 pictures of GGOs and 1200 of non-GGOs in the training set, and 293 pictures of GGOs and 300 of non-GGOs in the testing set.
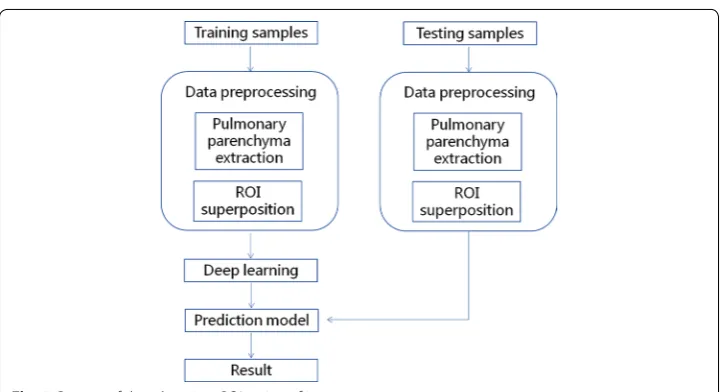
The specific steps involved are shown in Fig. 4.
Prediction models
AlexNet [14] and GoogLeNet [15] were used to detect pulmonary nodules. The ResNet and the pre-trained ResNet models were used as prediction models for GGOs.
Analysis
Sensitivity and average false positive rate were used to evaluate the study results. The definitions of some of the terms used in this section are as follows:
• TP (true positive): The number of nodules that were identified as nodules. • FP (false positive): The number of times that normal tissue was judged as nodules. • TN (true negative): The number of times that normal tissue was judged as normal
tissue.
• FN (false negative): The number of nodules that were judged as normal tissue; this was the number of missed nodules.
• Sensitivity: The proportion of nodules that were correctly classified. The following formula was used: Sensitivity = TP
TP+FN.
• Average false positive: The average number of nodules missed per patient. The fol-lowing formula was used: Average false positive rate = FP
Patients Numbers.
• Threshold of deep learning testing: After the prediction model analyzed the test-ing samples, a value of 0 to 1 was the output, which showed the probability of finding pulmonary nodules in the testing. By setting a threshold of deep learn-ing testlearn-ing, we could distlearn-inguish the pulmonary nodules in the testlearn-ing samples. If the value in the prediction model was higher than that of the threshold, it was believed that the sample contained the pulmonary nodule. If the value was lower, it was considered as normal pulmonary tissue.
• Precision: This indicated that the samples correctly detected accounted for the actual number of GGOs. The formula used was as follows: Precision = TP
TP+FP. • True Positive Rate (TPR): This indicated the rate of samples that were correctly
identified. The following formula was used: True Positive Rate = TP
TP+FN.
• F-score: This was used for quantitative analysis of the testing results. The follow-ing formula was used: F = 2∗Precision∗True Positive Rate
Precision+True Positive Rate .
Results
Pulmonary nodules
The models supplied a probability value, which represented the probability that the image was a real nodule. The threshold was used to determine whether a nodule was a real nodule. If the probability value was higher than the set threshold, the image was considered as a real nodule. Thus, by setting different thresholds, the AlexNet and Goog-LeNet models had different sensitivities for judging the nodule. The sensitivities of the AlexNet and GoogLeNet models under different thresholds are shown in Fig. 5. It was seen that the sensitivities of AlexNet and GoogLeNet were similar when the threshold was small. When the threshold was higher than 0.5, the sensitivity of the AlexNet model was slightly better than that of the GoogLeNet model.
The average FPs of the two models under different thresholds are shown in Fig. 6. It was seen that the average false positive rate of AlexNet was lower than that of GoogLeNet.
Fig. 5 Sensitivity of AlexNet and GoogLeNet with different thresholds. When the threshold was higher than 0.5, the sensitivity of the AlexNet model was slightly better than that of the GoogLeNet model
When the threshold was increased, the average false positive rate of AlexNet decreased faster than that of GoogLeNet. When the threshold was near 0.9, the average FP of GoogLeNet was still about 10. Until the threshold was close to 0.99, the average FP of GoogLeNet was low, but the sensitivity was only about 60–70%. Based on a combination of sensitivity and false positivity, we found that the prediction model trained by AlexNet had better accuracy than that trained by GoogLeNet.
We tested the AlexNet model using a threshold value of 0.5. Results based on the size of pulmonary nodules are shown in Table 1. The results suggest that nodules with diam-eter less than 10 mm, and especially those smaller than 8 mm, were missed.
GGOs
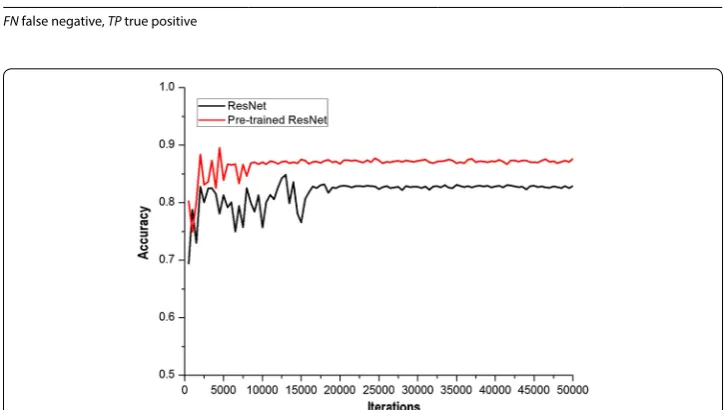
During testing of the ResNet and the pre-trained ResNet prediction models to identify GGOs, it was seen that as iterations increased, the accuracies of ResNet and pre-trained ResNet were more stable (Fig. 7). The accuracy of pre-trained ResNet was near 0.87, while that of ResNet was stable near 0.82. By comparing the curves, we determined that pre-trained ResNet not only achieved quick stability, but also had a higher accuracy.
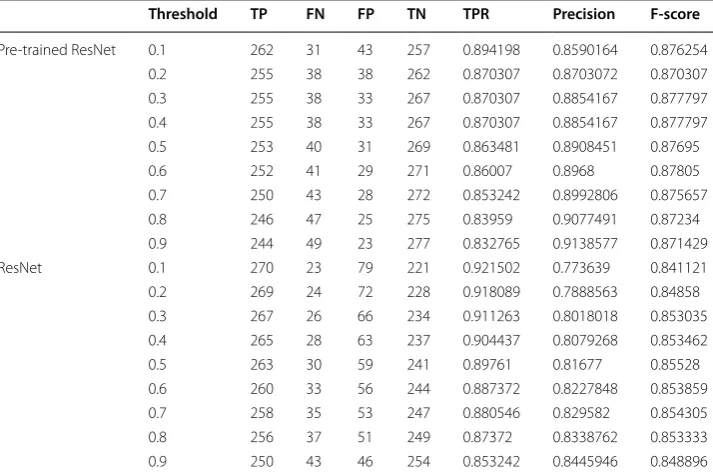
The test results using ResNet and pre-trained ResNet are shown in Table 2. For pre-trained ResNet, when the threshold was 0.6, the maximum value of F-score was 0.87805, TPR was 0.86, precision was 0.897, specificity was 0.903, and false positive rate was
Table 1 Detection of nodules based on size with AlexNet
FN false negative, TP true positive
Nodule size TP FN Sensitivity (%)
3–5 mm 45 7 86.5
5–8 mm 55 8 87.3
8–10 mm 65 1 98.5
10–20 mm 77 0 100
> 20 mm 63 0 100
Total 305 16 95.0
0.097. For ResNet, when the threshold was 0.5, the maximum value of F-score was 0.85528, TPR was 0.897, precision was 0.817, specificity was 0.803, and false positive rate was 0.197. The data showed that the highest F-score obtained by pre-training ResNet was higher than that obtained by ResNet, and almost all the F-scores obtained by pre-training ResNet were better than those when ResNet was used randomly. This shows that when lesser medical image data sets are available, pre-training ResNet could be more effective for improving the training effect of the network and shortening the time required for training to achieve stability. Moreover, it also shows that the accuracy of the prediction model with pre-trained ResNet is better than that with ResNet.
Discussion
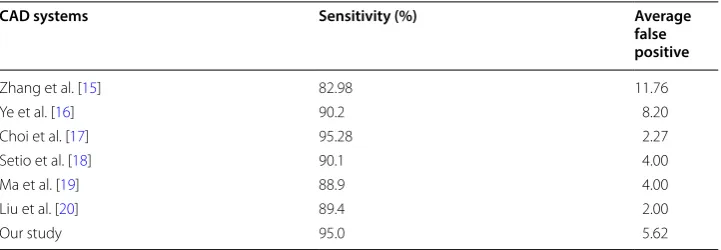
In our study, deep learning was combined with CAD to identify pulmonary nodules and GGOs. We have proposed a preprocessing method of RGB superposition in the ROI to effectively increase the differentiation between nodules and normal tissues, and that is the innovation of our research. Our results suggest that the method of deep learning proposed in this study is more sensitive than other CAD systems in recent years, and the average FP is lower than with that with the others (Table 3).
The detection rate of GGOs is increasing because of the widespread use of multislice spiral CT and CT screening for lung cancer detection [18–23]. Pathologically, ground-glass nodules can be either benign or malignant lesions. Several studies have shown that persistent GGOs have a high risk of malignancy. Compared with solid nodules, the type of malignancy in GGOs (nonsolid nodules) is predominantly adenocarcinoma or pre-cancerous lesion [24, 25]. Therefore, early identification of pulmonary nodules, espe-cially GGOs, has a great diagnostic and therapeutic significance in patient management.
Table 2 Classification results of GGOs and non-GGOs by ResNet and pre-trained ResNet
FN false negative, FP false positive, TN true negative, TP true positive, TPR true positive rate
Threshold TP FN FP TN TPR Precision F-score
Deep learning and CAD have been the new research hotspots in recent years. AlexNet is a classical open source convolutional neural network algorithm. It was a winner of the ImageNet large scale visual recognition challenge (ILSVRC) in 2012 [14]. The Network structure of GoogLeNet is more complex, and it was the winner of the ILSVRC in 2014 [15]. ResNet is proposed by the Microsoft Research Institute; it can effectively solve the problem of accuracy getting saturated with increasing depth [16]. These are the reasons why we chose these specific CAD systems for our study.
With regard to the utility of deep learning for the detection and classification of pul-monary nodules and GGOs, we did find that the method of deep learning proposed in our study is feasible; however, there are still some shortcomings and improve-ments will need to be made. First, compared with other CAD system experiimprove-ments, the FPs in our study are a little high; we intend to try to reduce it by introducing the pre-trained deep neural network algorithm weights in ImageNet data to initialize. Second, deep learning requires training data with large sample sizes. The samples of pulmonary ground-glass opacity used in our study are still not adequate. We will con-tinue the experiment with regard to GGOs, with a higher sample size, and we believe that the accuracy of deep learning could improve further. We also plan to collect the pathological results of GGOs and use them in deep learning. We hope that in addi-tion to identifying pulmonary nodules correctly, deep learning can provide a prelimi-nary diagnosis of nodules as benign or malignant in order to make the results of CAD more applicable in clinical practice.
Conclusion
The method of deep learning proposed in this study is more sensitive and has a lower average FP compared to other systems, which would effectively increase the differen-tiation between nodules and normal tissues, and help early identification of pulmo-nary nodules, especially GGOs.
Abbreviations
CAD: computer-aided diagnosis; CAFFE: convolutional architecture for fast feature embedding; CT: computed tomog-raphy; GGO: ground-glass opacity; FN: false negative; FP: false positive; ILSVRC: ImageNet large scale visual recognition challenge; LIDC-IDRI: Lung Image Database Consortium and Image Database Resource Initiative; RGB: red, green, and blue channels; ROI: region of interest; TN: true negative; TP: true positive; TPR: true positive rate.
Table 3 Comparison of our proposed method with other CADs systems
CAD computer‑aided diagnosis
CAD systems Sensitivity (%) Average
false positive
Zhang et al. [15] 82.98 11.76
Ye et al. [16] 90.2 8.20
Choi et al. [17] 95.28 2.27
Setio et al. [18] 90.1 4.00
Ma et al. [19] 88.9 4.00
Liu et al. [20] 89.4 2.00
Authors’ contributions
YW, GW, GX, and YP contributed to the study concept and design. YW, GW, MY, HF, YL, CY, ZG and WX were involved in the acquisition of data. YW and GW conducted the analysis and interpretation of data. YW and GW worked on the prepa-ration of the manuscript. All authors read and approved the final manuscript.
Author details
1 Department of Respiratory Medicine, Xinhua Hospital, School of Medicine, Shanghai Jiao Tong University,
Shang-hai 200092, China. 2 School of Electronic Information and Electrical Engineering, Shanghai Jiao Tong University,
Shanghai 200240, China. 3 Department of Radiology, Xinhua Hospital, School of Medicine, Shanghai Jiao Tong University,
Shanghai 200092, China. 4 Shanghai Jiaotong University School of Medicine, Shanghai 200092, China.
Acknowledgements Not applicable.
Competing interests
The authors declare that they have no competing interests.
Availability of data and materials
The datasets used and/or analyzed during the current study are available from the corresponding author on reasonable request.
Consent for publication Not applicable.
Ethics approval and consent to participate
This study was approved by the Ethics Committee of Xinhua Hospital, School of Medicine, Shanghai Jiao Tong University. Funding
This work was supported by the Clinical Research Plan of SHDC (16CR2042B), the National Natural Science Foundation of China (81770023), and the Natural Science Foundation of Shanghai (17ZR1418400).
Publisher’s Note
Springer Nature remains neutral with regard to jurisdictional claims in published maps and institutional affiliations.
Received: 20 November 2018 Accepted: 16 January 2019
References
1. Austin JH, Muller NL, Friedman PJ, Hansell DM, Naidich DP, Remy-Jardin M, et al. Glossary of terms for CT of the lungs: recommendations of the nomenclature committee of the Fleischner Society. Radiology. 1996;200(2):327–31. 2. Tang ER, Schreiner AM, Pua BB. Advances in lung adenocarcinoma classification: a summary of the new
interna-tional multidisciplinary classification system (IASLC/ATS/ERS). J Thorac Dis. 2014;6(Suppl 5):S489–501.
3. Kim HK, Lee HY, Choi YL, Choi SJ, Choi H, Lee J, et al. Assessment of intratumoral heterogeneity of oncogenic driver mutations in surgically-resected lung adenocarcinoma: implications of percutaneous biopsy-based molecular assay for target-directed therapy. Anticancer Res. 2014;34(2):707–14.
4. Golding B, Luu A, Jones R, Viloria-Petit AM. The function and therapeutic targeting of anaplastic lymphoma kinase (ALK) in non-small cell lung cancer (NSCLC). Mol Cancer. 2018;17:52.
5. Terry SF. Obama’s precision medicine initiative. Genet Test Mol Biomarkers. 2015;19(3):113–4.
6. Zhao Y, de Bock GH, Vliegenthart R, van Klaveren RJ, Wang Y, Bogoni L, et al. Performance of computer-aided detection of pulmonary nodules in low-dose CT: comparison with double reading by nodule volume. Eur Radiol. 2012;22(10):2076–84.
7. Ypsilantis PP, Siddique M, Sohn HM, Davies A, Cook G, Goh V, et al. Predicting response to neoadjuvant chemother-apy with PET imaging using convolutional neural networks. PLoS ONE. 2015;10(9):e0137036.
8. Roth HR, Lu L, Seff A, Kevin M, Cherry, Joanne H, Shijun W, et al. A new 2.5D representation for lymph node detec-tion using random sets of deep convoludetec-tional neural network observadetec-tions. Med Image Comput Comput Assist Interv. 2014;17(01):520–7.
9. Liu Z, Luo P, Wang X, Tang X. Deep learning face attributes in the wild. In: 2015 IEEE international conference on computer vision (ICCV). 2015. P. 3730–8.
10. Gao J, He X, Deng L. Deep Learning for Web Search and Natural Language Processing. WSDM; 2015. Report No.: MSR-TR-2015-7.
11. Hu B, Lu Z, Li H, Chen Q. Convolutional neural network architectures for matching natural language sentences. In: Dietterich TG, Becker S, Gharmani Z, editors. Advances in neural information processing systems. Massachussets: MIT Press; 2014. p. 2042–50.
12. Armato SG 3rd, McLennan G, McNitt-Gray MF, Meyer CR, Yankelevitz D, Aberle DR, et al. Lung image database con-sortium: developing a resource for the medical imaging research community. Radiology. 2004;232(3):739–48. 13. Armato SG 3rd, McLennan G, Bidaut L, McNitt-Gray MF, Meyer CR, Reeves AP, et al. The lung image database
• fast, convenient online submission
•
thorough peer review by experienced researchers in your field
• rapid publication on acceptance
• support for research data, including large and complex data types
•
gold Open Access which fosters wider collaboration and increased citations maximum visibility for your research: over 100M website views per year
•
At BMC, research is always in progress.
Learn more biomedcentral.com/submissions
Ready to submit your research? Choose BMC and benefit from:
14. Krizhevsky A, Sutskever I, Hinton GE. ImageNet classification with deep convolutional neural networks. Adv Neural Inf Process Syst. 2012;1:1097–105.
15. Szegedy C, Liu W, Jia Y, Sermanet P, Reed S, Anguelov D, et al. Going deeper with convolutions//. IEEE Conference on Computer Vision and Pattern Recognition. 2015;2015:1–9.
16. He K, Zhang X, Ren S, Sun J. Deep residual learning for image recognition. In: 2015 IEEE conference on computer vision and pattern recognition. 2015. P 770–8.
17. Jia Y, Shelhamer E, Donahue J, Karayev S, Long J, Girshick R, et al. Caffe. Convolutional architecture for fast feature embedding. In: ACM international conference on multimedia. New York: ACM; 2014. P 675–8.
18. Zhang X, McLennan G, Hoffman EA, Sonka M. A complete CAD system for pulmonary nodule detection in high resolution CT images. Proc SPIE Int Soc Opt Eng. 2005;5747:85–96.
19. Ye X, Lin X, Dehmeshki J, Slabaugh G, Beddoe G. Shape-based computer-aided detection of lung nodules in tho-racic CT images. IEEE Trans Biomed Eng. 2009;56:1810–20.
20. Choi W, Choi TS. Automated pulmonary nodule detection system in computed tomography images: a hierarchical block classification approach. Entropy. 2013;15(2):507–23.
21. Setio AAA, Litjens G, Gerke PK, Jacobs C. Pulmonary nodule detection in CT images: false positive reduction using multi-view convolutional networks. IEEE Trans Med Imaging. 2016;35(5):1160–9.
22. Ma J, Zhou Z, Ren Y, et al. Computerized detection of lung nodules through radiomics. Med Phys. 2017;44(8):4148–58.
23. Liu X, Hou F, Qin H, Hao A. A CADe system for nodule detection in thoracic CT images based on artificial neural network. Sci China Inf Sci. 2017;60(7):072106.
24. Kim HY, Shim YM, Lee KS, Han J, Yi CA, Kim YK. Persistent pulmonary nodular ground-glass opacity at thin-section CT: histopathologic comparisons. Radiology. 2007;245(1):267–75.