www.geosci-model-dev.net/7/2517/2014/ doi:10.5194/gmd-7-2517-2014
© Author(s) 2014. CC Attribution 3.0 License.
Assessing optimal set of implemented physical parameterization
schemes in a multi-physics land surface model using
genetic algorithm
S. Hong1,*, X. Yu1,**, S. K. Park1,2,3,4, Y.-S. Choi1,2,3,4, and B. Myoung1,***
1Center for Climate/Environment Change Prediction Research, Ewha Womans University, Seoul, Korea 2Severe Storm Research Center, Ewha Womans University, Seoul, Korea
3Department of Environmental Science and Engineering, Ewha Womans University, Seoul, Korea 4Department of Atmospheric Science and Engineering, Ewha Womans University, Seoul, Korea *now at: Department of Climate & Ecology, National Institute of Ecology, Seocheon, Korea **now at: Tropical Marine Science Institute, National University of Singapore, Singapore
***now at: Center for Excellence in Earth Systems Modeling & Observations, Chapman University, California, USA
Correspondence to: S. K. Park ([email protected])
Received: 15 July 2013 – Published in Geosci. Model Dev. Discuss.: 5 September 2013 Revised: 18 September 2014 – Accepted: 19 September 2014 – Published: 29 October 2014
Abstract. Optimization of land surface models has been challenging due to the model complexity and uncertainty. In this study, we performed scheme-based model optimizations by designing a framework for coupling “the micro-genetic al-gorithm” (micro-GA) and “the Noah land surface model with multiple physics options” (Noah-MP). Micro-GA controls the scheme selections among eight different land surface pa-rameterization categories, each containing 2–4 schemes, in Noah-MP in order to extract the optimal scheme combina-tion that achieves the best skill score. This coupling frame-work was successfully applied to the optimizations of evap-otranspiration and runoff simulations in terms of surface wa-ter balance over the Han River basin in Korea, showing out-standing speeds in searching for the optimal scheme combi-nation. Taking advantage of the natural selection mechanism in micro-GA, we explored the model sensitivity to scheme selections and the scheme interrelationship during the micro-GA evolution process. This information is helpful for better understanding physical parameterizations and hence it is ex-pected to be effectively used for further optimizations with uncertain parameters in a specific set of schemes.
1 Introduction
many schemes (Moriasi et al., 2007; Rosolem et al., 2013). However, this type of optimization tends to be limited to only a few sites due to the tremendous computing resources and time.
Model optimization techniques that maximize computa-tion effectiveness were recently developed. One of the meth-ods increasingly used for model calibration is “the genetic algorithm” (GA). The fundamental concept of GA is the natural selection of genes (parameters) for object evolution (Holland, 1992). A marked advantage of GA is its smart search for an optimal combination of parameters by consid-ering interactions among various uncertain parameters, skip-ping separate model sensitivity experiments. In light of this advantage, GA has been used for various numerical models and spotlighted as an effective and reliable technique for han-dling the issues of the quantitative increase in uncertain pa-rameters in numerical models (Fang et al., 2003; Rosolem et al., 2013; Yu et al., 2013).
Another considerable problem in model optimizations is a possible opposite effect among the implemented schemes in a complex model. For example, improvement of a single physical process through certain parameter optimizations can be followed by exacerbations of other processes. However, this opposite effect may not be sufficiently addressed by con-sidering merely uncertain parameter interactions, because the increased complexity of models is associated with not only the increases in the number of uncertain parameters but also the augmentations of new parameterization schemes. Rosero et al. (2010) revealed that model sensitivity to parameters can vary according to the choice of scheme as well as parameters associated with land surface heterogeneity. Their study im-plies that interactions among the implemented schemes in a model may induce further considerable uncertainty for model optimization. This issue is of great importance when con-structing a new model from various pre-developed parame-terization schemes for their large-scale applications.
In the preceding context, the model’s sensitivity to the im-plemented schemes and the interrelationship among schemes need to be investigated for more effective model optimiza-tion. In this study, we designed a model optimization sys-tem by applying a GA technique to a multi-scheme LSM in order to investigate the model sensitivity to schemes and the scheme interrelationship. In this system, GA induces scheme-based optimization by controlling the LSM. We used an efficient version of GA, the so-called “the micro-genetic algorithm” (micro-GA), that uses a small number of investi-gation samples.
The purpose of the application of this coupled system is (1) to maximize the effectiveness of extracting an optimal scheme set from the LSM and (2) to assess how the interrela-tionship among the schemes contributes to the effectiveness of posterior parameter optimizations by taking advantage of the smart searching mechanism of GA. In order to disclose the interrelationship among the implemented schemes, we target two different variables – evapotranspiration (ET) and
runoff in this study. These are important processes to evalu-ate the accuracy of the model’s surface wevalu-ater balance. Since the two variables are closely linked in terms of surface wa-ter partitioning, it will be useful to check a possible opposite effect between them.
2 Methods
2.1 Noah LSM with multiple physics options
For a multi-scheme LSM, a new version of the Noah LSM with multiple physics options (hereinafter Noah-MP) was used. The Noah LSM has evolved through the cooperative efforts of various institutions such as the National Center for Environmental Prediction (NCEP) and the Air Force Weather Agency. Using Noah LSM 3.0v as the baseline, Noah-MP was augmented with multiple physics options with regard to 10 different land surface processes (Niu et al., 2011). The augmentations were basically intended to improve the Noah LSM in terms of phenology computation, snow treatment, and groundwater representation. Among the ten physical cat-egories, dynamic vegetation and its paired scheme for the stomatal resistance, the Ball–Berry scheme (Ball et al., 1987; Collatz et al., 1991), were fixed in this study. Thus, eight pa-rameterizing categories were totally used to generate scheme combinations as summarized in Table 1.
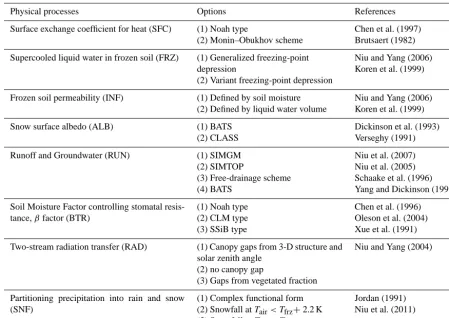
Table 1. Summary of scheme options available in Noah-MP.
Physical processes Options References Surface exchange coefficient for heat (SFC) (1) Noah type
(2) Monin–Obukhov scheme
Chen et al. (1997) Brutsaert (1982) Supercooled liquid water in frozen soil (FRZ) (1) Generalized freezing-point
depression
(2) Variant freezing-point depression
Niu and Yang (2006) Koren et al. (1999)
Frozen soil permeability (INF) (1) Defined by soil moisture (2) Defined by liquid water volume
Niu and Yang (2006) Koren et al. (1999) Snow surface albedo (ALB) (1) BATS
(2) CLASS
Dickinson et al. (1993) Verseghy (1991) Runoff and Groundwater (RUN) (1) SIMGM
(2) SIMTOP
(3) Free-drainage scheme (4) BATS
Niu et al. (2007) Niu et al. (2005) Schaake et al. (1996) Yang and Dickinson (1996) Soil Moisture Factor controlling stomatal
resis-tance,βfactor (BTR)
(1) Noah type (2) CLM type (3) SSiB type
Chen et al. (1996) Oleson et al. (2004) Xue et al. (1991) Two-stream radiation transfer (RAD) (1) Canopy gaps from 3-D structure and
solar zenith angle (2) no canopy gap
(3) Gaps from vegetated fraction
Niu and Yang (2004)
Partitioning precipitation into rain and snow (SNF)
(1) Complex functional form (2) Snowfall atTair< Tfrz+2.2 K
(3) Snowfall atTair< Tfrz
Jordan (1991) Niu et al. (2011)
CLM (Community Land Model); SSiB (Simplified Simple Biosphere Model); SIMGM (Simple TOP runoff and Groundwater Model); SIMTOP (Simple TOP Runoff Model); BATS (Biosphere–Atmosphere Transfer Model); CLASS (Canadian Land Surface Scheme).
hydrological model (TOPMODEL). A simple groundwa-ter model was added to TOPMODEL in RUN(1) (Niu et al., 2007) in spite of an equilibrium water table concept in RUN(2) (Niu et al., 2005). RUN(3) and RUN(4) are the scheme from the original Noah LSM (Schaake et al., 1996) and from BATS (Yang and Dickinson, 1996), respectively, both of which uses free drainage concept for subsurface runoff. Three options are available in the schemes for the soil moisture factor controlling stomatal resistance (BTR); BTR(1) from Noah LSM uses soil moisture (Chen et al., 1996) and BTR(2) and BTR(3) that are from BATS (Oleson et al., 2004) and the Community Land Model (CLM) (Xue et al., 1991), respectively, uses metric potential to compute the factor.
Vegetation distribution affects radiation transfer at the land surface with solar zenith angle. The three schemes of two-stream radiation transfer (RAD) treat the gaps differently with regard to the pattern of vegetation distribution as fol-lows; RAD(1) considers three-dimensional structure of veg-etation canopy (Niu and Yang, 2004), RAD(2) does not con-sider the canopy gab, and RAD(3) treats the gab from unity minus the green vegetation fraction. Partitioning of precipita-tion into rainfall and snowfall (SNF) is determined generally
based on air temperature in most LSMs. While SNF(2) and SNF(3) use only a single reference temperature to differen-tiate between rain and snow, SNF(1) uses a complex func-tional form for differential partitioning rate based on air tem-perature (Jordan, 1991). Using the eight categories, the to-tal number of possible scheme combination is 1728. The more detailed description of each scheme, including equa-tions and parameter settings, the reader should refer to Niu et al. (2011).
2.2 Micro-GA
improved version of GA with smaller generation sizes and simplified genetic modifications, hence efficiently reducing the computational resources (Krishnakumar, 1989; Reeves, 1993; Wang et al., 2010). The fundamental mechanism of micro-GA for model optimization is to evaluate individual members in a group (or generation) to select an elite (natu-ral selection) based on a fitness function (or skill score), to bear new offspring members using the genes in the selected elite through stochastic modifications of their chromosomes, such as a crossover mechanism, and then to reconstitute a new generation with the offspring members. While the re-constitutions with the natural selection and crossover mech-anism are repeated, the generations evolve and converge to the optimum.
2.2.1 Coupling micro-GA with Noah-MP
Micro-GA was applied for the scheme-based optimization using Noah-MP (hereinafter MP–MGA). In this coupled sys-tem, a scheme combination represents an individual, and a group of multiple scheme combinations represents a genera-tion. Each scheme combination is constituted with the eight physical categories as mentioned in Sect. 2.1, and each cat-egory acts like a chromosome. The generation of a scheme combination from various multi-optional physical processes is easily controlled by discrete numbers from micro-GA; each scheme option in a category is assigned to a unique dis-crete number in the MP–MGA coupled system.
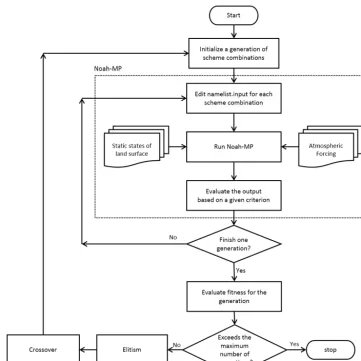
In the MP–MGA, micro-GA controls the choices of phys-ical schemes to produce scheme generations and conducts a series of model runs using Noah-MP. The flow chart in Fig. 1 summarizes the optimization process in MP–MGA. Two basic parameters must be set to operate micro-GA: the number of individual members in a generation and the num-ber of generations for iteration. These numnum-bers are critical to evaluate the efficiency of the MP–MGA optimization. In this study, each generation was set to 10 individual members and the number of generations was set through the validation experiment (see Sect. 3).
The first basic task of micro-GA is to generate 10 sets of scheme combinations by selecting one discrete number for one category. Once micro-GA establishes the 10 scheme combinations, it applies these combinations to Noah-MP by editing the “namelist.input” file one by one. The second task is to select the best scored scheme combination based on a customized fitness function (see Sect. 2.2.2). Until Noah-MP finishes all the 10 simulations, micro-GA collects the skill scores of each simulation. The skill scores are calculated by comparing the simulations to the observations based on the fitness function. The last task of micro-GA is to generate the next generation through the “crossover” mechanism (ex-change of the chromosomes) using the best scored scheme combination from the previous generation. Micro-GA con-tinues this task, exploring better generations than the previ-ous ones until the optimization process converges upon the
optimal value. The MP–MGA operation procedure can be summarized as follows (see Fig. 1):
1. Micro-GA produces an initial set of scheme combina-tions through random seleccombina-tions. The random seleccombina-tions are generated from a uniform random deviate between 0 and 1.
2. Micro-GA controls Noah-MP by editing the “namelist.input” file for the scheme choices and executing the model.
3. After Noah-MP finishes one simulation with the given scheme selections, its skill score is calculated through statistical comparison to the observation data based on the fitness function.
4. Micro-GA collects the skill scores until all the simula-tions for the current generation are completed.
5. Once micro-GA collects all the skill scores of the gen-eration, it selects the best one (elitism) and stores the selected scheme combination for the next generation. 6. Another set of scheme combinations for the next
gen-eration is produced through the “crossover” mechanism using the selected one from the previous step.
Figure 1. A flow chart describing the scheme-based optimization process from the coupled micro-GA and Noah-MP model.
2.2.2 Fitness function
In the GA optimization, we need to define a functional to be optimized – the fitness function. Evaluation skills used in the fitness function are very subjective, depending on the study objectives. We may use various statistical indices such as correlation coefficient and root mean square error for a reliable model evaluation. However, because GA uses only one fitness function, we should be very careful to select an evaluation skill for more comprehensive model evaluation. In this study, we used a skill scoring technique, using com-monly used statistical indices: correlation coefficient (R), normalized standard deviation (σnorm), and normalized av-erage (υnorm)based on observation data. It produces a sin-gle skill score (S) from the three statistical indices following (Taylor, 2001) as
S=R· 4
σnorm+ 1
σnorm
2
· 4
υnorm+ 1
υnorm
2. (1)
The closer the skill score is to unity, the more accurate the model output is. In this study, we evaluate the MP–MGA coupled system for surface water budget components: evap-otranspiration and runoff.
2.3 Study domain and data
Figure 2. Geographic location of the Han River basin (dark shaded
area) in South Korea. The gray lines in the basin indicate the river channels.
generated from NOAA Global Data Assimilation System (GDAS) atmospheric analysis fields, the NOAA Climate Pre-diction Center Merged Analysis of Precipitation (CMAP), and observation-based downward radiations by the Air Force Weather Agency’s Agricultural Meteorological modelling system (ARGMET).
The 3 year GLDAS forcing data from 2001 was processed for the Han River basin in Korea (Fig. 2). The basin area is about 23 000 km2. For the model’s static input for the land surface characteristics, the Kongju National Land Cover data (KLC; Kang et al., 2010) and soil texture map from the Farm and Organization of the United Nations (FAO, 2002) were used. The KLC data are recently developed and represent land cover for East Asia, using the satellite vegetation prod-ucts from Moderate Resolution Imaging Spectro-radiometer (MODIS). The study region is under a moderate humid cli-mate condition with about 2.5 mm day−1and 12◦C of annual average precipitation rate and temperature, respectively. The major vegetation is mixed forest according to KLC. The pre-vious six month data (July to December 2000) were utilized for the model initialization.
For the evaluation of ET simulations, the monthly MODIS ET data set (MOD16A2) was utilized. This data set was es-timated from land cover, surface albedo, leaf area index, and fraction of photosynthetically active radiation using an im-proved ET algorithm based on the Penman–Monteith equa-tion (Monteith, 1965; Mu et al., 2011). Mu et al. (2011) addresses that the MODIS ET uncertainties can be intro-duced from many sources: uncertainties from input data such as MODIS leaf area index and meteorological data, those from up-scaling processes (tower to landscape), and those
of model parameters used in the derivation algorithm. The ET data have been validated for North American flux tower sites. There is a flux tower (located at 37.76◦N, 127.15◦E)
available for ground-based ET monitoring in the Han River basin (Kang et al., 2009), but the measurements are not cov-ering the research period of this study (2001–2003). How-ever, according to the flux tower observations, the 5 year av-erage of ET from 2004 to 2008 was about 0.93 mm day−1. MODIS ET of the grid point covering the flux tower site showed 0.95 mm day−1 with a reasonable correlation coef-ficient (0.86) with the observation for the same period. Thus, it is considered that the possible errors of MODIS ET would not be great at least for the Han River basin.
For the runoff observation data, we obtained the stream flow observation from the Water Management Information System in Korea (WAMIS), and the daily-base observations are available via http://www.wamis.go.kr. We assumed that the monthly-base stream flow observation at the final outlet point of the Han River basin represents the monthly variation of runoff over the entire basin.
The models were evaluated for ET and runoff through monthly-averaged comparisons after the area aggregations for the Han River basin. The actual spatial and temporal res-olutions in the simulations were 0.25 degrees and 3 h, respec-tively.
3 Evaluation of MP–MGA for the scheme-based optimization
This section addresses the evaluation of MP–MGA, in terms of capability and efficiency by comparing 3 year simulations in the Noah-MP stand-alone mode and the MP–MGA cou-pled mode.
3.1 Model sensitivity to scheme choices in a physical category
For proper model initialization, we first examined the spin-up time when the ET and runoff simulations from the Noah-MP model reaches equilibrium. Since each set of scheme combi-nation represents an individual model, it is interesting to in-vestigate how the model spin-up time varies with the choices of schemes. Model runs for 2001 were repeatedly performed for all scheme combinations until the variables reached equi-librium. The criterion for the equilibrium is defined as the time when the difference in annual means between two con-secutive one-year simulations is less than 0.1 % of the means (Cai et al., 2014; Yang et al., 1995).
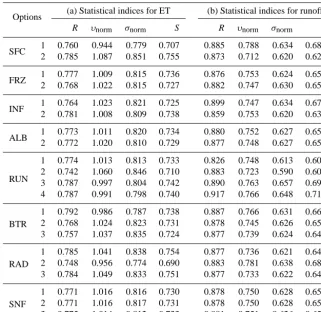
From the Noah-MP stand-alone mode, the three statisti-cal indices and the skill scores for all scheme combinations were obtained. Table 2 displays averaged indices for simula-tions of all scheme combinasimula-tions with one fixed scheme in a certain physical category. The physical categories that show bigger differences in the averaged skill scores are considered to be more sensitive to model performances.
For the ET simulations, the scheme combination hav-ing the best skill score (0.806) is as follows: SFC(2), FRZ(1), INF(1), ALB(1), RUN(3), BTR(1), RAD(1), and SNF(3). The order of categories based on the sensitiv-ity (or skill-score differences with scheme choices) from the largest to the smallest is RAD>SFC>RUN>BTR > INF>FRZ>ALB>SNF. For the runoff simulations, the best skill score was 0.809 but scheme combination was very different from the best one for ET: SFC(1), FRZ(1), INF(1), ALB(1), RUN(4), BTR(1), RAD(2), and SNF(2). The order of categories based on the sensitivity is: RUN>SFC>RAD>INF>BTR>FRZ>ALB>SNF.
This result obviously shows that the scheme selections in RAD category are the most important to obtain higher sim-ulation accuracies for ET (RUN for runoff simsim-ulation) due to their direct involvement in the variable estimations. It also turns out that three categories – RAD, SFC and RUN – are the most important for accurate simulations of both ET and runoff through proper combination of schemes.
It is noteworthy that the scheme sets chosen to produce the most accurate simulations are very different between ET and runoff, especially in the most influential categories (i.e., RAD, SFC, and RUN in this study). This implies that the model optimization for a single variable (e.g., ET) can degrade simulation accuracy of the other variables (e.g., runoff). This opposite effect between the ET and runoff sim-ulations is presented in Table 3, which displays each statisti-cal index when the model returned the best skill score for ET (upper row) and runoff (lower row). For example, the scheme combination for the best ET simulation (S=0.806) showed a lower skill score for the runoff simulation (S=0.693). Similarly, the scheme set for the best runoff simulation (S=0.794) depicted a lower skill score for the ET simulation (S=0.659). It is also observed that the normalized means (υnorm; bold numbers in Table 3) show the largest differences between the ET and runoff simulations. For instance, the nor-malized mean of ET with the best skill score was 1.037, but it was lowered to 0.815 with the best scheme combination for runoff. In the same way, the normalized mean of runoff with the best skill score was 0.860, but lowered to 0.743 with the best scheme combination for ET.
This indicates that the opposite effect on the skill scores between ET and runoff is mainly reflected in the normalized means of the ET and runoff simulations. The opposite ef-fect between the variables can make difficulty in optimiza-tions for more than two variables. Since this opposite ef-fect is mainly related to the quantitative estimations, interre-lationship between parameterizations of physical processes
associated with surface water partitioning into ET and runoff might have played a crucial role in this discrepancy. It im-plies that, to make the optimized scheme combinations have the best performance for the ET and runoff simulations si-multaneously, uncertainties of parameterizations in the pro-cesses related to both ET and runoff should be depleted; hence further optimizations of model parameters involved in the surface water partitioning estimation are essential as the next step.
3.2 The efficiency of the MP–MGA coupled system
In the previous section, we showed how the model is sensi-tive to scheme choices and what scheme combination shows the highest accuracy through the stand-alone Noah-MP ex-periments. In this section, we address how accurately and ef-ficiently the MP–MGA coupled system can search for the optimal scheme combinations that produce the highest skill score.
Separate experiments with the MP–MGA for ET and runoff optimization were performed to examine how fast the MP–MGA reaches the global optimum (the highest skill score). We set 10 for the number of individual members in a generation and 30 for the number of generations
Figure 3 shows the evolution of generations with an in-crease in the number of generations. In the ET optimization process (Fig. 3a), the MP–MGA reached the maximized evo-lution (the point that the MP–MGA converged upon the high-est average skill score) at the 18th generation and found the global optimum at the 12th generation. Meanwhile, in the runoff optimization process (Fig. 3b), MP–MGA converged upon the maximized evolution at the 12th generation and found the global optimum at the 3rd generation. The big drop in Fig. 3b indicates the “restart” point (see Sect. 2.2.1) due to the early convergence of the runoff optimization. In both the ET and runoff evolution processes, the MP–MGA didn’t fall into any local optimum, and the global optimums are exactly the same as the ones from the stand-alone Noah-MP exper-iments shown in the previous section. However, there exists a significant difference between the ET and runoff optimiza-tions in the speed of searching for the global optimum. This indicates that the efficiency of micro-GA to find the optimal scheme set for the best output may vary with the target vari-able. Although the speed of the ET optimization process is slower than that of the runoff optimization process, the MP– MGA required only 120 simulations (12 generations with 10 scheme sets each) to obtain the global optimum.
Table 2. Averaged statistical indices for (a) ET and (b) runoff to the observations (R: correlation coefficient;υnorm: normalized mean;σnorm:
normalized standard deviation;S: skill score). Each index indicates the averaged one for simulations of all scheme combinations with one fixed-scheme in a certain scheme category.
Options (a) Statistical indices for ET (b) Statistical indices for runoff
R υnorm σnorm S R υnorm σnorm S
SFC 1 0.760 0.944 0.779 0.707 0.885 0.788 0.634 0.683 2 0.785 1.087 0.851 0.755 0.873 0.712 0.620 0.624
FRZ 1 0.777 1.009 0.815 0.736 0.876 0.753 0.624 0.650 2 0.768 1.022 0.815 0.727 0.882 0.747 0.630 0.657
INF 1 0.764 1.023 0.821 0.725 0.899 0.747 0.634 0.673 2 0.781 1.008 0.809 0.738 0.859 0.753 0.620 0.634
ALB 1 0.773 1.011 0.820 0.734 0.880 0.752 0.627 0.656 2 0.772 1.020 0.810 0.729 0.877 0.748 0.627 0.652
RUN
1 0.774 1.013 0.813 0.733 0.826 0.748 0.613 0.601 2 0.742 1.060 0.846 0.710 0.883 0.723 0.590 0.608 3 0.787 0.997 0.804 0.742 0.890 0.763 0.657 0.695 4 0.787 0.991 0.798 0.740 0.917 0.766 0.648 0.710
BTR
1 0.792 0.986 0.787 0.738 0.887 0.766 0.631 0.667 2 0.768 1.024 0.823 0.731 0.878 0.745 0.626 0.650 3 0.757 1.037 0.835 0.724 0.877 0.739 0.624 0.644
RAD
1 0.785 1.041 0.838 0.754 0.877 0.736 0.621 0.640 2 0.748 0.956 0.774 0.690 0.883 0.781 0.638 0.681 3 0.784 1.049 0.833 0.751 0.877 0.733 0.622 0.640
SNF
1 0.771 1.016 0.816 0.730 0.878 0.750 0.628 0.653 2 0.771 1.016 0.817 0.731 0.878 0.750 0.628 0.653 3 0.775 1.014 0.812 0.733 0.881 0.751 0.626 0.654
Table 3. Statistical indices when the model returned with the best skill score for ET (upper row) and runoff (lower row). The bold numbers
indicate the indices showing the largest differences between ET and runoff simulations.
Statistical indices for ET Statistical indices for runoff
R υnorm σnorm S R υnorm σnorm S
Best for ET 0.835 1.037 0.831 0.806 0.906 0.737 0.652 0.693 Best for runoff 0.766 0.815 0.716 0.659 0.937 0.860 0.682 0.794
optimization but that of the runoff simulation deteriorates, and vice versa.
3.3 The natural selection mechanism in MP–MGA as model sensitivity to scheme selections
Another important capability of the MP–MGA is that it pro-vides information on the model sensitivity to scheme choices in terms of the model accuracy through the natural selec-tion mechanism in micro-GA. The sensitivity analysis to scheme selections can be performed more easily, but more clearly by simply counting the schemes selected via the MP– MGA. Through the natural selection mechanism, micro-GA gives more surviving chance (or selective chance) to the
chromosomes (or scheme options) that have more advantage to achieve higher model accuracy. Therefore, the larger num-ber of selections of a certain scheme through the entire op-timization process accounts for its higher advantage to the model accuracy.
Figure 3. Evolution of generations during the processes of the MP–MGA optimization for (a) ET and (b) runoff. The red and blue lines
indicate the averages of ET and runoff in each experiment, respectively.
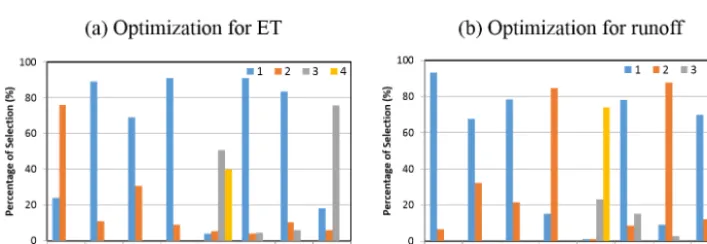
Figure 4. Percentage of selections of each scheme to the total number of simulations (300 simulations) from micro-GA during the entire
optimization processes for (a) ET and (b) runoff. Each colour indicates the available options in each scheme category.
advantageous to produce better performance in both ET and runoff simulations, and that they are not likely to cause the opposite effect between the two simulations. On the other hand, some other physics categories, such as SFC, ALB, RAD, and SNF, showed counter scheme selections between the two optimization processes. For instance, in terms of the SFC category, SFC(2) had been highly selected in the ET optimization while SFC(1) had been mostly chosen in the runoff optimization. It seems that such schemes cause the opposite effect between the ET and runoff optimization (see Sect. 3.1).
Interestingly, in terms of the RUN category, the ET opti-mization process was dominated by two schemes – RUN(3) and RUN(4), showing similar chances of being selected. This signifies that the selection between these two schemes makes no significant difference in the ET simulation accuracy. How-ever, considering that RUN(4) is remarkably dominant in the runoff optimization process, we can conclude that RUN(4) is the best choice for higher accuracy in both ET and runoff simulations.
Finally, the combination of the dominant schemes be-comes the optimal set of schemes through the natural selec-tion mechanism.
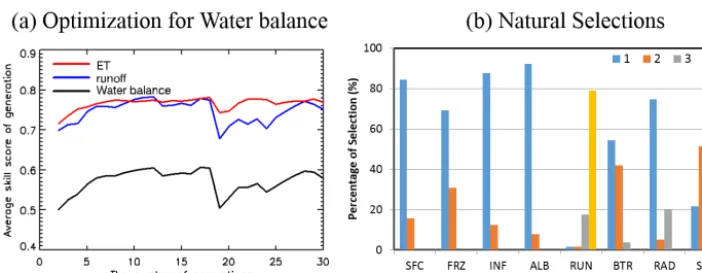
3.4 The MP–MGA optimization for the water balance
Additional experiments were performed for the scheme-based optimization in terms of water balance (WB) without any parameter calibration. Here the WB optimization is tar-geting two variables simultaneously, i.e., both ET and runoff. Skill score for evaluating WB simulation (SWB)used in this study is defined as a simple multiplication of each skill scor-ing function (SWB=SET×Srunoff)from Eq. (1). Thus,SWB ranges from 0 to unity; the closer to unity the skill score is, the better performance the model has in the WB simula-tion. The parameter settings for micro-GA run are the same as those from the previous separate MP–MGA optimization experiments.
Figure 5. (a) Evolution of generations during the process of the MP–MGA optimization for the WB estimation as in Fig. 3, and (b) percentage
of selections of each scheme to the total number of simulations during the optimization process as in Fig. 4.
Srunoff=0.794) in the previous sections. In this combined WB optimization, both the ET and runoff optimizations are performed simultaneously and the opposite effect between ET and runoff is not observed as in the separate optimiza-tions (cf. Fig. 3). In addition, the fluctuation of evolution process in the runoff optimization is larger than that in the ET optimization, which implies that the accuracy of the WB simulation might be sensitive to the simulation performance of runoff than that of ET.
The analysis of the natural selections during the WB op-timization process is displayed in Fig. 5b. Note that in the separate optimizations, categories SFC, ALB, RAD and SNF showed different scheme selections for different target vari-able – ET vs. runoff (see Fig. 4). In the combined WB optimization, the natural selections in categories SFC was made in favour of the runoff optimization, that is, SFC(1) was mostly selected to improve the runoff simulation ac-curacy. In contrast, the most highly selected scheme from category ALB and RAD in the combined WB optimiza-tion was ALB(1) and RAD(1), respectively, which were both favoured by the ET optimization. In category RUN, the RUN(4) scheme was most widely selected, which was favoured by both ET and runoff optimizations. It is inter-esting that category SNF had SNF(2) as the most selective scheme in the WB optimization, but it was not favoured by either ET or runoff in the separate optimizations. This im-plies that each physics category plays its own role in the combined WB optimizations through the natural selections in micro-GA runs. For example, in category SFC, micro-GA selects schemes with more weight to the runoff optimiza-tion, while in categories ALB and RAD it selects schemes with more weight to the ET optimization. In category RUN, a scheme is chosen in the way to give similar weight in both the ET and runoff optimization. It seems like micro-GA tend to make adjustments or balance between the ET and runoff optimization by selecting a scheme (SNF(2)) that played an important role in neither the ET optimization nor the runoff optimization.
4 Summary and conclusions
This study was conducted to design and test a framework for a scheme-based model optimization by coupling an intelli-gent model optimization technique with a multi-physics land surface model. The micro-genetic algorithm (GA), which enables smart and fast searching for the optimum, was in-troduced and applied to a new version of the Noah Land Surface Model (LSM) with multiple physics options (Noah-MP) in various physical parameterization categories. We im-plemented an interface between Noah-MP and micro-GA and developed a coupled system (MP–MGA). The optimiza-tion in terms of water balance (ET and runoff) through this MP–MGA coupled system successfully demonstrated how micro-GA can effectively seek the optimal set of the physi-cal scheme combination from Noah-MP over the Han River basin in South Korea. Through the stand-alone Noah-MP ex-periment, we first examined the model sensitivity of ET and runoff simulations to scheme selections in each available pa-rameterization category. Then we evaluated the effectiveness of MP–MGA system on the scheme-based model optimiza-tion. The searching speed for the global optimum and the op-timal set of schemes is quite outstanding though the speeds are different between the ET and runoff optimization pro-cesses – only 120 of the total 1728 simulations for the ET optimization and much less for the runoff optimization. This indicates that, compared to the brute force approach, the MP– MGA coupled system significantly reduces the computing time for searching and extracting the optimal scheme com-bination through the natural selection and crossover mecha-nism in micro-GA.
more than two variables. For example, we identified that a scheme set optimized for a single target variable (e.g., ET) may degrade the simulation accuracies of other variables (e.g., runoff). Since ET and runoff are mutually related, such opposite effect between the ET and runoff estimations makes difficulty to assess model accuracy in terms of surface water balance (WB).
It is also noted that the natural selection mechanism in micro-GA provides information on schemes mainly con-tributing to the opposite effect in the separate ET and runoff optimization. For example, the dominant schemes commonly selected in both the ET and runoff optimizations through the natural selection bring a synergistic contribution to better model performance. The dominating schemes that were se-lected disparately from the same categories between the two separate optimizations (e.g., SFC(2) for ET vs. SFC(1) for runoff) cause the opposite effect. In the combined WB opti-mization process with both ET and runoff as target variables, the most highly selected schemes, via the natural selection, played their own role to improve the model accuracy for the target variables. For example, some schemes acted upon im-provement of the ET optimization while some others oper-ated upon amelioration of the runoff optimization.
It appears that the scheme-based optimization through the MP–MGA coupled system does not assure the ultimate modelling performance we can obtain from Noah-MP. Fur-ther optimizations on uncertain parameters in parameteriza-tion schemes are still required with deep understanding of the physical parameterization methods in the model. Fur-thermore, additional experiments for combined scheme- and parameter-based optimization are essentially required to in-vestigate the effect of parameter calibrations on the model sensitivity to scheme selections. However, considering that the recent trend of increased model complexity with the con-sequent increase of uncertain parameters may require more efforts and time for parameter optimization and calibration, the approach such as the MP–MGA coupled system provides more insightful understanding of the implemented physical schemes and their interrelationships that are essential for more effective model optimization. For instance, the optimal set of scheme combination obtained from the MP–MGA sys-tem can be a base model for faster and more effective model optimization and improvement.
Moreover, the model sensitivity to scheme selections shown in this study is likely to be region specific because the simulation performances will also vary with large-scale characteristics such as by climate, land covers, and even ge-ographical features. For example, the schemes that showed relatively low sensitivity were related mainly to winter sea-son variations. This might have been induced by moderately warm climate condition of the Han River basin. The regions in higher latitudes may show very different sensitivities to those schemes. Thus, additional experiments for different re-gions are required to obtain more generalized and extensive model applicability.
Acknowledgements. The authors are grateful to the anonymous
reviewers for their constructive comments. We also thank the God-dard Earth Sciences Data and Information Services Center (GES DISC) for providing the GLDAS data. This work was supported by the National Research Foundation of Korea (NRF) grant funded by the Korea government (MSIP) (no. 2009-0083527). S. Hong was supported by RP-Grant 2011 of Ewha Womans University. Edited by: M.-H. Lo
References
Ball, J., Woodrow, L. E., and Beny, J. A.: A model predicting stom-atal conductance and its contribution to the control of photosyn-thesis under different environmental conditions, In Progress in Photosynthesis Research, Volume 4 Proceedings of the VIIth In-ternational Congress on Photosynthesis, Providence, Rhode Is-land, USA, 10–15 August 1986, 221–224, 1987.
Bastani, M., Kholghi, M., and Rakhshandehroo, G. R.: Inverse mod-eling of variable-density groundwater flow in a semi-arid area in Iran using a genetic algorithm, Hydrogeol. J., 18, 1191–1203, 2010.
Bulatewicz, T., Jin, W., Staggenborg, S., Lauwo, S., Miller, M., Das, S., Andresen, D., Peterson, J., Steward, D. R., and Welch, S. M.: Calibration of a crop model to irrigated water use using a genetic algorithm, Hydrol. Earth Syst. Sci., 13, 1467–1483, doi:10.5194/hess-13-1467-2009, 2009.
Brutsaert, W. A.: Evaporation Into the Atmosphere, D. Reidel, Dor-drecht, Netherlands, 299 pp, 1982.
Cai, X., Yang, Z.-L., David, C. H., Niu, G.-Y., and Rodell, M.: Hy-drological evaluation of the Noah-MP land surface model for the Mississipi River Basin. J. Geophys. Res.-Atmos., 119, 23–38, doi:10.1002/2013JD020792, 2014.
Chen, F., Mitchell, K., Schaake, J., Xue, Y., Pan, H.-L., Koren, V., Duan, Q. Y., Ek, M., and Betts, A.: Modeling of land surface evaporation by four schemes and comparison with FIFE obser-vations, J. Geophys. Res., 101, 7251–7268, 1996.
Chen, F., Janjic, Z., and Mitchell, K. E.: Impact of atmospheric surface-layer parameterizations in the new land-surface scheme of the NCEP mesoscale Eta model, Bound. Lay. Meteorol., 85, 391–421, 1997.
Collatz, G., Ball, J., Grivet, C., and Berry, J.: Physiological and en-vironmental regulation of stomatal conductance, photosynthesis and transpiration: a model that includes a laminar boundary layer, Agr. Forest Meteorol., 54, 107–136, 1991.
Cretat, J. and Pohl, B.: How Physical Parameterizations Can Mod-ulate Internal Variability in a Regional Climate Model, J. Atmos. Sci., 69, 714–724, doi:10.1175/JAS-D-11-0109.1, 2012. Dickinson, R. E., Henderson-Sellers, A., and Kennedy, P. J.:
Biosphere-Atmosphere Transfer Scheme (BATS) version 1e as coupled to the NCAR Community Climate Model. NCAR Tech-nical Note NCAR/TN-387+STR: 80 pp., National Center for At-mospheric Research., Boulder, CO, 1993.
Fang, C. L., Zheng, Q., Wu, W. H., and Dai, Y.: Intelligent optimiza-tion algorithms to VDA of models with on/off parameterizaoptimiza-tions, Adv. Atmos. Sci., 26, 1181–1197, 2009.
Fang, H. L., Liang, S. L., and Kuusk, A.: Retrieving leaf area index using a genetic algorithm with a canopy radiative transfer model, Remote Sens. Environ., 85, 257–270, 2003.
FAO: FAO/UNESCO Digital Soil Map of the World and derived soil properties., Land and Water Digitial Media Series #1 rev 1, 2002.
Gupta, H. V., Bastidas, L. A., Sorooshian, S., Shuttleworth, W. J., and Yang, Z.-L.: Parameter estimation of a land surface scheme using multi-criteria methods, J. Geophys. Res., 104, 19491– 19503, 2000.
Holland, J. H.: Adaptation in Natural and Artificial System, 2nd Edn., The MIT Press, Cambridge, Massachusetts, 1992. Hu, Y. M., Ding, Y. H., and Shen, T. L.: Validation of a
recep-tor/dispersion model coupled with a genetic algorithm using syn-thetic data, J. Appl. Meteorol. Climatol., 45, 476–490, 2006. Jackson, C., Xia, Y. L., Sen, M. K., and Stoffa, P. L.: Optimal
pa-rameter and uncertainty estimation of a land surface model: A case study using data from Cabauw, Netherlands, J. Geophys. Res., 108, 4583, doi:10.1029/2002JD002991, 2003.
Jordan, R.: A one-dimensional temperature model for a snow cover: Technical Documentation for SNTHERM.89, Cold Regions Re-search and Engineering Lab, Hanover, NH, 1991.
Kang, J.-H., Suh, M.-S., and Kwak, C.-H.: Land cover classification over East Asian region using recent MODIS NDVI data (2006– 2008), Atmosphere, 20, 415–426, 2010.
Kang, M., Park, S., Kwon, H., Choi, H. T., Choi, Y.-J., and Kim, J.: Evapotranspiration from a deciduous forest in a complex ter-rain and a heterogeneous farmland under monsoon climate, Asia-Pacific J. Atmos. Sci., 54, 175–191, 2009.
Koren, V., Schaake, J., Mitchell, K., Duan, Q. Y., Chen, F., and Baker, J. M.: A parameterization of snowpack and frozen ground intended for NCEP weather and climate models. J. Geophys. Res.-Atmos., 104, 19569–19585, 1999.
Krishnakumar, K.: Micro-genetic algorithms for stationary and non-stationary function optimization, SPIE intelligent Control and Adaptive Systems, 1196, SPIE, Philadelphia, 289–296, 1989. Lee, Y. H., Park, S. K., and Chang, D.-E.: Parameter
estima-tion using the genetic algorithm and its impact on quanti-tative precipitation forecast, Ann. Geophys., 24, 3185–3189, doi:10.5194/angeo-24-3185-2006, 2006.
Miguez-Macho, G. and Fan, Y.: The role of groundwater in the Amazon water cycle: 2. Influence on seasonal soil moisture and evapotranspiration, J. Geophy. Res.–Atmos., 118, D15114, doi:10.1029/2012JD017540, 2012.
Mitchell, M.: An Introduction to Genetic Algorithms, The MIT Press, Cambridge, Massachusetts, 1998.
Mo, X. G., Chen, J. M., Ju, W. M., and Black, T. A.: Optimization of ecosystem model parameters through assimilating eddy co-variance flux data with an ensemble Kalman filter, Ecol. Model., 217, 157–173, 2008.
Monteith, J. L.: Evapotranspiration and environment, in: The state and movement of water in living organism, Symposium of the society of experimental biology, edited by: Fogg, B. D., 19, 205– 234, Cambridge University Press, Cambridge, 1965.
Moriasi, D. N., Arnold, J. G., Van Liew, M. W., Bingner, R. L., Harmel, R. D., and Veith, T. L.: Model evaluation guidelines for
systematic quantification of accuracy in watershed simulations, Trans. ASABE, 50, 885–900, 2007.
Mu, Q., Zhao, M., and Running, S. W.: Improvement to a MODIS global terrestrial evapotranspiration algorithm. Remote Sens. En-viron., 115, 1781–1800, 2011.
Nasonova, O. N., Gusev, E. M., and Kovalev, E. E.: Application of a land surface model for simulating rainfall streamflow hydro-graph: 1. Model calibration, Water Res., 38, 155–168, 2011. Niu, G.-Y. and Yang, Z.-L.: Effects of vegetation canopy processes
on snow surface energy and mass balances, J. Geophys. Res.-Atmos., 109, D23111, doi:10.1029/2004JD004884, 2004. Niu, G.-Y. and Yang, Z.-L.: Effects of frozen soil on snowmelt
runoff and soil water storage at a continental scale, J. Hydrome-teorol., 7, 937–952, 2006.
Niu, G.-Y., Yang, Z.-L., Dickinson, R. E., and Gulden, L. E.: A simple TOPMODEL-based runoff parameterization (SIMTOP) for use in global climate models. J. Geophys. Res.-Atmos., 110, D21106, doi:10.1029/2005JD006111, 2005.
Niu, G.-Y., Yang, Z.-L., Dickinson, R. E., Gulden, L. E., and Su, H.: Development of a simple groundwater model for use in cli-mate models and evaluation with Gravity Recovery and Cli-mate Experiment data. J. Geophys. Res.-Atmos., 112, D07103, doi:10.1029/2006JD007522, 2007.
Niu, G.-Y., Yang, Z.-L., Mitchell, K. E., Chen, F., Ek, M. B., Barlage, M., Kumar, A., Manning, K., Niyogi, D., Rosero, E., Tewari, M., and Xia, Y.: The community Noah land surface model with multi-parameterization op-tions (Noah-MP): 1. Model description and evaluation with local-scale measurements, J. Geophys. Res., 116, D12109, doi:10.1029/2010JD015139, 2011.
Oleson, K. W.: Techinical description of the community land model (CLM), NCAR Technical Note NCAR/TN-461+STR, 174 pp., National Center for Atmospheric Research, Boulder, CO, 2004. Reeves, C.: Improving the efficiency of Tabu search in machine
se-quencing problems, J. Opl. Res. Soc., 44, 375–382, 1993. Rodell, M., Houser, P. R., Jambor, U., Gottschalck, J., Mitchell,
K., Meng, C.J., Arsenault, K., Cosgrove, B., Radakovich, J., Bosilovich, M., Entin, J. K., Walker, J.P., Lohmann, D., and Toll, D.: The global land data assimilation system, Bull. Amer. Mete-orol. Soc., 85, 381–394, 2004.
Rosero, E., Yang, Z. -L., Wagener, T., Gulden, L. E., Yatheen-dradas, S., and Niu, G.-Y.: Quantifying parameter sensitivity, interaction, and transferability in hydrologically enhanced ver-sions of the Noah land surface model over transition zones during the warm season, J. Geophys. Res., 115, D03106, doi:10.1029/2009JD012035, 2010.
Rosolem, R., Gupta, H. V., Shuttleworth, W. J., de Goncalves, L. G. G., and Zeng, X. B.: Towards a comprehensive approach to parameter estimation in land surface parameterization schemes, J. Hydrol. Process., 27, 2075–2097, doi:10.1002/hyp.9362, 2013. Schaake, J., Koren, V., Duan, Q.-Y., Mitchell, K., and Chen, F.: Sim-ple water balance model for estimating runoff at different spatial and temporal scales, J. Geophys. Res., 101, 7461–7475, 1996. Taylor, K. E.: Summarizing multiple aspects of model performance
in a single diagram, J. Geophys. Res., 106, 7183–7192, 2001. Uddameri, V. and Kuchanur, M.: Estimating aquifer recharge in
Verseghy, D. L.: CLASS-A Canadian land surface scheme for GCMS: I. Soil model, Int. J. Climatol., 11, 111–133, 1991. Wang, Q., Fang, H. B., and Zou, X. K.: Application of Micro-GA
for optimal cost base isolation design of bridges subject to tran-sient earthquake loads, Struct. Multidiscip. Optim., 41, 765–777, 2010.
Wang, S. F., Shen, T. L., Zhang, J. W., and Sun, L. P.: A method of four-dimensional variational data assimilation based on the evo-lution direction genetic algorithm, Journal of Nanjing Insititute of Meteorology, 25, 740–746, 2002.
Williams, J. L. and Maxwell, R. M.: Propagating Subsurface Uncer-tainty to the Atmosphere Using Fully Coupled Stochastic Simu-lations, J. Hydrometeorol., 12, 690–701, 2011.
Xue, Y., Sellers, P. J., Kinter, J. L., and Shukla, J.: A simplified biosphere model for global climate studies. J. Climate, 4, 345– 364, 1991.
Yang, Z.-L. and Dickinson, R. E.: Description of the Biosphere-Atmosphere Transfer Scheme (BATS) for the soil moisture work-shop and evaluation of its performance, Global Planet. Change, 13, 117–134, 1996.