2 College of Logistics in Přerov, Palackého 1381/25, 750 02 Přerov, Czech Republic, e–mail: hana.neradilova@
vslg.cz
ABSTRACT
Passenger ropeways represent an original and attractive way of transporting passen-gers. They are mainly deployed in mountainous conditions or urban agglomerations. In most cases, they are very closely linked to tourism. For their efficient operation and implementation of a wide range of analyses, various methods and approaches are used that differ from each other both in terms of results and input factors. Thanks to its options, the computer simulation method ranks among highly efficient tools. However, its use is often precluded by concerns about the complexity of modeling and the subsequent execution of simulation experiments. This paper presents a dis-crete simulation model of a real passenger ropeway with an effort to point out the fact that it is actually possible to create such model in addition to presenting a possible interpretation of the obtained results.
Keywords: simulation, ropeway, software, modelling, transport.
INTRODUCTION
According to [1], the system of car ropeways may be defined as a transport technology trans -porting persons in engineless and transmission-less vehicles driven by only a steel rope. This is a type of transport with the potential to significantly enhance the transport options in urban areas [2]. On the other hand, it has certain limitations, such as the maximum transport capacity between 2000 – 4000 persons per hour [2]. Generally, it can be stated that the process of design and implemen-tation of this transport system is difficult, as its execution requires verification of various model situations and scenarios. In particular, the issues of capacity [3] need closer scrutiny, as do the is-sues of operational safety dependent especially on the steel rope [4].
The issue of steel rope research in connection with the cable car ropeways has been subject to many research papers. [5] should be mentioned as an example thereof, with the authors presenting
the steel rope quality assessment in more detail. Very often, it is possible to carry out this type of assessment through experimental measurements [6]. Another area, closely linked to ropeway safe-ty, are the methods of steel rope testing [7]. Here, the knowledge from related areas may be utilized, for example from the area of freight transport [8]. It follows from the above that this is a very chal-lenging and wide–ranging problem. In addition to the steel rope, attention should also be paid to other structural parts of the ropeway, e.g. to the braking system of individual cars [9].
When assessing the economic efficiency of ropeways, we can apply various methods and ap-proaches that are closely linked to other transport systems [10]. At the same time, knowledge of the conventional transport systems can be applied to the field of ropeway transport where the operating costs should be reduced accordingly, as presented by e.g. Molnár et al.[11]. All these approaches al-low for the application of a wide range of methods, such as PESTEL Analysis [12] or MCDM
Advances in Science and Technology Research Journal Vol. 12 (2), 2018
ods [13]. Moreover, computer simulation may be currently ranked among one of those methods.
When using a computer simulation method, the already verified FEM [14] can be applied, yielding valuable results for the ropeway trans-port when combined with the experimental mea-surements. It primarily concerns assessment of individual components, which may be of various metallic [15] or plastic materials [16]. However, computer simulation model using discrete simu-lation models may also be applied to the ropeway transport of persons.
Using discrete simulation models, we can model the processes associated with, for ex-ample, the transport of individual passengers. In terms of simulation detail, these are micro-scopic models that can track the movement and exchange of passengers in individual vehicles. Various simulating tools available may be used to implement simulation models, for example ExtendSim 9 or Witness. Specifically, the Ex
-tendSim 9 program was used to simulate the real ropeway system for transporting tourists in the High Tatra Mountains.
CHARACTERISTICS OF THE SIMULATED
PASSENGER ROPEWAY
The simulated system of a passenger rope-way course performs the function of the carrier transport system which, combined with the hik-ing trail, provides connection with Skalnaté pleso (the Rocky Tarn) in the High Tatras and the sub-sequent possibility of further transport from Skal-naté pleso to Lomnický štít (the Lomnica Peak).
The simulation model was made primarily with regard to tracking the number of carried passengers and obtaining information for fur-ther, not just economic, analyses. For this rea-son, the analysis needed to take into account all the factors affecting the number of transported passengers in any way. This primarily involved
Fig. 1. Number of days in operation
the number of operating days (Figure 1) which directly affect the capacity of the entire trans-port system. In addition to planned technical shutdowns, their number is affected in particu -lar by the weather.
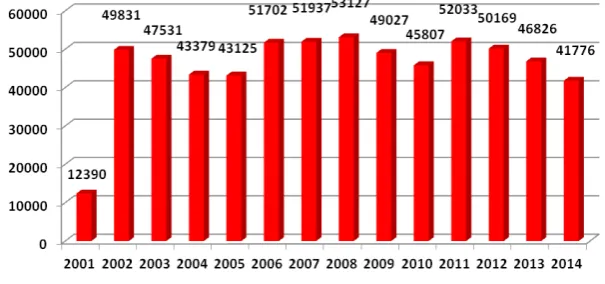
Another factor necessary for the creation of the simulation model is the number of passengers transported in the past (Figure 2). Using this infor-mation, it was possible to predict the number of passengers in the simulation model and to set the limits for generating the number of passengers.
In addition to the above–mentioned param-eters, information on operation interruption due to repairs was also implemented in the simula-tion model. These are the data with no distinc-tion whether the interrupdistinc-tion was planned or un-planned (Figure 3).
CREATION OF THE PASSENGER ROPEWAY
SIMULATION MODEL
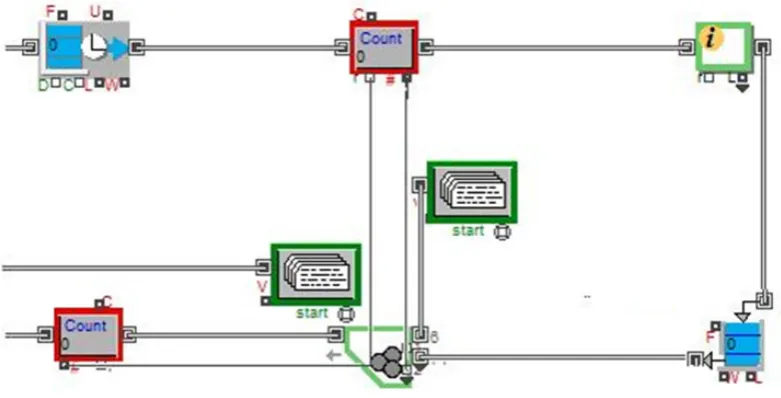
The ropeway simulation model was created according to the block diagram in Figure 4. The model contemplates a route consisting of two rope-ways, the circular one, which connects Tatranská Lomnica and Skalnaté Pleso, and which passes through the station called Štart. The second rope-way, connecting Skalnaté Pleso and Lomnický štít, operates on the principle of a shuttle service.
SIMULATION OF A VARIABLE NUMBER
OF CARS ON THE ROPEWAY
At the beginning of every simulation model (Figure 5), the number of deployed cable cars
Fig. 3. Number of days the system was out of service in individual years due to repairs
Advances in Science and Technology Research Journal Vol. 12 (2), 2018
was defined. This process was covered by the Resource block with defined number of cars cir -culating between the stops of Tatranská Lomnica – Skalnaté pleso and back. The Inpu Random Number (IRN) block generates a random number of passengers in Tatranská Lomnica and transfers this information to the Set Attribute block, which assigns this number to the outgoing car. The Me-ter block function is to display the number of pas-sengers. Activity Delay was used for the neces-sary car delay, which simulates the trip duration. Get Attribute then reads how many people travel in the cable car and according to this number of passengers, the IRN block is able to generate a limit that defines how many people can get off
at the Štart station. The DE Equation reads how many people carry on, and this value is displayed in the Meter block.
SIMULATION OF THE CHANGE IN
THE NUMBER OF TRANSPORTED
PASSANGERS AT THE MIDSTATION
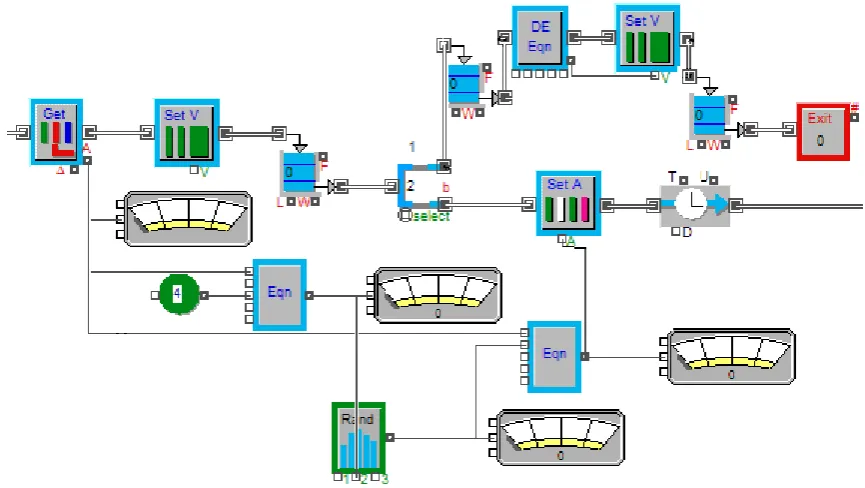
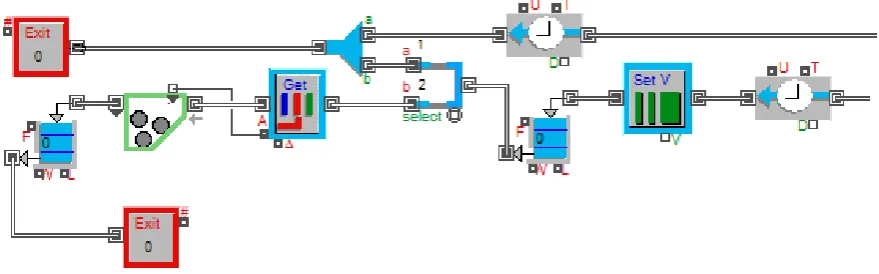
In the next part of the simulation model, the Get Attribute block identifies the number of pas -sengers in each car. Subsequently, the maximum number of the newly boarded passengers is calcu-lated, using a relationship defined in Equation and values from the Constant. The IRN then generates the number of newly boarded passengers, added
Fig. 5. Simulation of a variable number of cars on the ropeway route between Tatranská Lomnica & Skalnaté pleso
in the Equation block to the number of passengers already in the car.
The sum of the number of passengers who did not get off and of the newly boarded ones will then get into the Set Attribute block. Activity De-lay will hold the cable car in the block. The Set Value block has a value set at 2, which is sent to the so–called Queoe FIFO buffer. In the Select DE Output block, the exiting passengers are separated from the car. DE Equation reads the number of members leaving the group and then the Set Value transforms the group entity into individual entities – the persons proceeding to the Exit block, where they are removed from the simulation model.
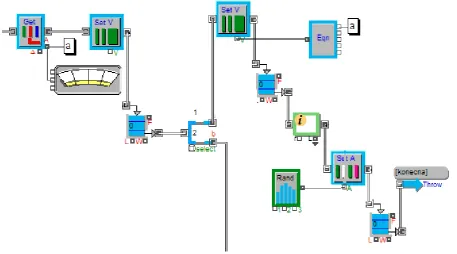
As the simulation in Figure 7 continues, the Get Attribute block identifies the number of pas -sengers that is also displayed in the Meter block. The Set Value carries a constant value of 2, which provides information about the entities available, namely the cars, and it moves the exiting passen-gers to the Queue FIFO block. Select DE Output separates the exiting passengers from the car, which remains empty. The car then returns, and the same procedure is repeated on the way down, i.e. boarding, delay, exit and passenger boarding at the Štart station, delay, exit of all passengers and the car’s return to Tatranská Lomnica. This cycle is repeated, and cars are circulating along this route.
From the Select DE Output block, a group of people arrives at the Set Value block, where it is
attributed the number of exiting people using the bridging “a” and the Equation. The Information block counts how many people at the station got off. Such exiting passengers are divided in the IRN block by percentage values and those values are transferred to the Set Attribute block. Subse-quently, the exiting passengers are moved to the Throw block, which sends a random percentage of them to the Catch block en route to Lomnický štít or to the Catch block staying at Skalnaté ple-so. Throw and Catch blocks are continuous and interconnected without the use of input and out-put connectors.
SIMULATION OF THE PASSENGERS’
ARRIVAL AT SKALNATÉ PLESO
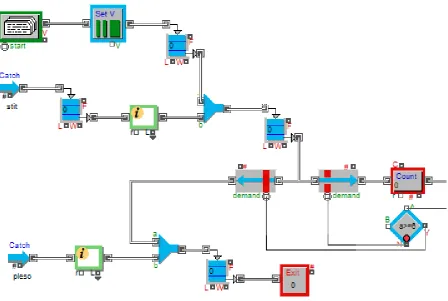
Figure 8 shows the arrival of tourists to Skal-naté pleso. The Program block generates a group of arriving tourists, who are divided into individ-uals in the Set Value block. Then they proceed to the Combine block, which is also joined by the passengers exiting the cable car arriving from the Štart station. They proceed to the Queue FIFO buffer and go through the Activity Service block (on the right), which functions as the so–called traffic light, from where they continue through the Count Items block, where they are counted. Upon the last car’s departure for Lomnický štít, a condi-tion is entered into the Decision block, closing the
Advances in Science and Technology Research Journal Vol. 12 (2), 2018
Activity Service block (on the right) and opening the Activity Service block (on the left). Tourists who did not get into the car to Lomnický štít will merge with the passengers getting off the cable car arriving from the Štart station in the Combine block, and as they are staying at Skalnaté pleso, their sum will be displayed in the Exit block.
Figure 9 is a continuation of the simulation of the tourists’ process of boarding the Skalnaté
pleso – Lomnický štít cable car. The IRN block generates the number of cable car passengers who create a group in the Batch block and who proceed to boarding as a group. The Count Items block counts how many groups pass this block, and it sends this information back to the already mentioned Decision Block to meet the condi-tion. The group of tourists arrives at the board-ing gate, where they are picked by the car at an
Fig. 8. Part of the simulation model simulating passengers’ arrival at Skalnaté pleso
exactly defined time specified in the Program block. The car proceeds to the Get Attribute block, which reads the number of passengers and shows it in the Meter block. Next is Activ-ity Delay, which simulates the time it takes to reach the peak. There is another Program block in the model, which sends the last car to Lom-nický štít, the mission of which is to pick up the last group transported there. This cable car also passes through the Activity Delay block.
Figure 10 shows the Set Value block that has a fixed value of 2 for separation of the original entity – the car into two parallel entities, the car and the passengers. The car continues to the Combine block and then to the one marked Exit, where the last car arrives too, coming empty from the Skalnaté pleso station. From the Se-lect DE Output block, a group of entities – the passengers, will pass to the Get Attribute group, which is further divided into individuals in the Unbatch block.
SIMULATION OF THE CAR CLIMB UP TO
THE LOMNICKÝ ŠTÍT
Figure 11 shows a submodel of the rope-way’s upper station. Entities – the tourists ar-rive at the Activity Multiple block, which rep-resents a delay at Lomnický štít. Subsequently, they go through the Count Items block, which counts them and sends the sum to the Batch block, calculating how many tourists should board the car for the return trip. The Informa-tion block then counts how many tourists vis-ited Lomnický štít in total. The tourists pass through the Queue FIFO block, arrive for the boarding where they are picked by the car at the defined time. When the car passes the Count Items block, the block sends a signal to the pre-vious Count Items, which subsequently resets itself. There is another Program block in Figure 11. This block sends an empty car from Lom-nický štít to the Skalnaté pleso station.
Advances in Science and Technology Research Journal Vol. 12 (2), 2018
Figure 12 shows the last section of the rope-way between Skalnaté pleso and Lomnický štít. The car is delayed in the Activity Delay blocks for the sake of simulating its return trip. Set Value has a default value of 2, into which the entity – the car, is separated in the Select DE Output block – i.e. into the original car and the exiting passengers.
The car then passes through the Combine block to the Exit, where it joins the previous emp-ty car. A group of people passes the Get Attribute block, which transfers the number of passengers from Lomnický štít. Unbatch divides the group of people into individuals who reach the Exit block via the Queue FIFO block.
SIMULATION MODEL APPLICATION
The presented simulation model was subse-quently used in the study of the process of ad-justing the departure interval between individual
cars from the ropeway starting station in Tatran-ská Lomnica. The aim of this research was to ex-plore the possibility of increasing the number of passengers to be transported. In this simulation experiment, 1384 cars per day were to leave the station at Tatranská Lomnica at a 16–second time interval. The ropeway can thus carry 900 persons
/ h–1. The results of the initial state are presented
in Figure 13.
After this initial simulation, adjustments were made to the individual departure intervals of the cable cars from the starting station, namely the interval was reduced from 16 s to 15 s. The ob-tained results are presented in Figure 14.
After reducing the time interval between the outgoing cars by 1 second, from the original 16 to the newly established 15 seconds, and by adjust-ing the simulation model entry data, I found that the transport capacity increased from the original
900 persons / h–1 to 960 persons / h–1.
Fig. 12. Simulation of the last section of the ropeway between Skalnaté pleso & Lomnický štít
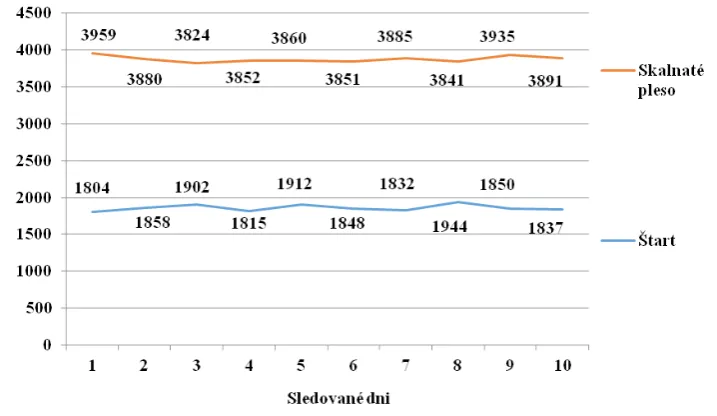
The change in the car departure time interval translates into the increased number of cars circu-lating this route from 1384 to 1477, which means an increase by 93 cars. The data recorded over 10 days of ropeway operation are shown in Figure 15. After calculating the average numbers of passen-gers, it was found that the number of passengers getting off at Štart rose from the original average of 1730 exiting passengers to 1860 exiting pas-sengers, which is an increase by 130 passengers. A similar result was also found at the Skalnaté Pleso station, where the original average traffic saw 3646 passengers getting off compared to 3877 passen -gers getting off after a change in input data has taken effect, i.e. an increase by 231 passengers has been noted. The average number of passengers ex-iting at the Štart station was 1730 and those exex-iting at the Skalnaté pleso station was 3646.
Data similar to those at the exit Štart and Skal-naté pleso were also studied on the return trip to Štart and Tatranská Lomnica respectively, where the average number of passengers getting off at the Štart station was 1754 and those getting off at the station of Tatranská Lomnica was 3657. With this change, i.e. reduction in the time interval between the cable car departures by 1 second, the number of passengers exiting at the Štart station increased from 1754 to 1859, which is an increase by 105 passengers, and the number of those exiting in the station of Tatranská Lomnica increased from 3657 to 3880, an increase by 223 passengers. The num-ber of passengers on this route increased by 6.5% when the time interval was reduced by 1 second.
CONCLUSIONS
Computer simulation using discrete simula-tion models has a great potential and holds ef-fective means of analyzing transportation pro-cesses in the field of cable transport. The model described herein has a wide potential application and the paper has presented one example of use, i.e. the search for a possible way to increase the transport capacity. However, this is not the only case of its application. The created simulation model has further potential applications in rope-way modernization, car replacement and planning maintenance shutdowns. All the results obtained can then be used in various economic analyses, verifications of various operational scenarios and the like. The model is designed to show the fun-damentals of versatility, capable of being adjusted to other similarly run ropeways at minimum time required to do so.
ACKNOWLEDGEMENTS
This contribution is the result of the projects VEGA 1/0403/18, VEGA 1/0063/16, APVV 17-0235, KEGA 018TUKE–4/2016.
REFERENCES
Advances in Science and Technology Research Journal Vol. 12 (2), 2018
2. Tezak S., Sever D. and Lep M. Increasing the Ca-pacities of Cable Cars for Use in Public Transport. Journal of Public Transportation 19, 2016, 1–16. 3. Alshalalfah B.W., Shalaby A.S., Dale S. and
Oth-man F.M.Y. Feasibility study of aerial ropeway transit in the Holy City of Makkah. Transportation Planning and Technology 38, 2015, 392–408. 4. Piskoty G., Affolter C., Sauder M., Nambiar M.
and Weisse B. Failure analysis of a ropeway ac-cident focussing on the wire rope’s fracture load under lateral pressure. Engineering Failure Analy-sis 82, 2017, 648–656.
5. Vojtko M., Tittel V., Peterka P., Beresova A. and Nemeth R. Assessment of the cable freight cable-way quality, 23rd International Conference on Met-allurgy and Materials, Metal 2014, 2014, 431–435. 6. Molnar V., Boroska J. and Decmanova J. Mechani-cal properties of steel rope wires – quality test assur-ance, Acta Montanistica Slovaca 15, 2010, 23–30. 7. Kresak J., Kropuch S. and Peterka P. Testing
meth-ods of steel wire ropes at the anchor. Acta Mon-tanistica Slovaca 17, 2012, 174–178.
8. Kopas M., Kulka J., Mantic M., Faltinova E. and Bigos P. Increasing durability in steel wire rope installed in special transport equipment, Scientific Journal of Silesian University of Technology–Se-ries Transport 91, 2016, 71–80.
9. Mantic M., Kulka J., Kopas M., Faltinova E. and Petroci J. Special device for continuous decelera-tion of freight cableway trucks. Scientific Journal of Silesian University of Technology–Series Trans-port 91, 2016, 89–97.
10. Tomkova E., Husakova N. and Strohmandl J. Possibilities of Economic Efficiency Solution in Road Haulage, Transport Means 2015, 2015, pp. 694–697.
11. Molnar V. and Pacutova K. Assessing the possibili-ties of reducing the transport company costs, Pro-ceedings of the Third International Conference on Traffic and Transport Engineering, ICTTE 2015, 2016, 570–575.
12. Dockalikova I. and Klozikova J. MCDM Methods in Practice: Determining the Significance of PES -TEL Analysis Criteria, ECMLG 2014 – Proceed-ings of the 10th European Conference on Manage-ment Leadership and Governance, ECMLG 2014, 2014, 418–427.
13. Dockalikova I. and Kashi, K. MCDM Methods in Practice: Determining Importance of PESTEL Analysis Criteria, 8th International Days of Statis-tics and Economics, 2014, 334–344.
14. Lonkwic P., Różyło P. and Dębski H. Numerical and experimental analysis of the progressive gear body with the use of finite–element method. Eksp -loatacja i Niezawodnosc – Maintenance and Reli-ability 17, 2015, 544–550.
15. Rudawska A. and Debski, H. Experimental and numerical analysis of adhesively bonded aluminium alloy sheets joints. Eksploatacja i Niezawodnosc–Maintenance and Reliability 1, 2011, 4–10.