A Review and New Subjective Evaluation Experiment of Objective
Metricsused to Evaluate Histogram Equalization-based Contrast
Enhancement Techniques
Hasan Thabit Rashid Kurmasha*, Abbas Fadhil Alharan**
*(Computer Department, KufaUniversity/College of Education for Girls, Najaf, Iraq) ** (Computer Department, KufaUniversity/College of Education for Girls, Najaf, Iraq)---
************************
---Abstract:
Histogram Equalization (HE) is a dominant contrast enhancement method mainly used in image processing expanse due to its efficacy in forming images with good contrast. Various versions of works' efforts in Global HE have been created over the years. Improperly, these methods’ resilience to distortion remains questionable. This paper proposes to evaluate the selected two objective metrics which are the Absolute Mean Brightness Error (AMBE) and Entropy used for evaluation of image quality assessment algorithms (IQAs) based onGHE techniques. A review for thesetwo objective metrics is made. It is found that the two IQAs fail to detect the occurrence of noise artifacts and gray level brightness saturation effectively.Also,an experiment was conducted by using subjective evaluation to assess the performance of these twoobjective metrics. The statistical results of the experimentreveal that they have poor correlation with Human Visual Perception (HVP) of distortions.
Keywords — Contrast enhancement;Histogram equalization;Human visual perception;Image quality assessment, Distortions, AMBE, Entropy.
---
************************
---I. INTRODUCTION
Histogram Equalization (HE) is one of the most widely used contrast enhancement techniques. However, it could sometimes produce unnecessary enhancement which may lead to three visually annoying types of distortions such as noise artifacts, brightness saturation and excessive brightness change [1], as shown in Fig.1.
Over years, many researchers proposed different methods to improve what the author refers to before and after as the modification works of GHE such as: 1) Brightness Preserving Bi-HE (BBHE) [2].
2) Multi-peak Histogram Equalization [3].
3) Equal Area Dualistic Sub-Image Histogram Equalization (DSIHE) [4].
4) Minimum Mean Brightness Error Bi-Histogram Equalization (MMBEHE) [5].
5) Brightness Preserving Histogram Equalization with Maximum Entropy (BPHEME) [6].
6) Brightness Preserving Dynamic Histogram Equalization (BPDHE) [7].
7) Multi-Histogram Equalization Methods for Contrast Enhancement and Brightness Preserving (Multi-HE) [8].
8) Recursively Separated and Weighted Histogram Equalization for Brightness Preserving and Contrast Enhancement (RSWHE) [9].
9) Bi-Histogram Equalization with a Plateau Limit for Digital Image Enhancement (BHEPL) [10]. 10) Adaptive Contrast Enhancement Methods with Brightness Preserving (DQHEPL & BHEPL) [11]. 11) Fusion Framework of Histogram Equalization and Laplacian Pyramid (FFHELP) [12].
12)Image Contrast Enhancement using
Bi-Histogram Equalization with Neighbourhood
Metrics (BHENM) [13].
Fig.1An example of image with three types of annoying distortion caused by HE-based techniques.
Despite that the above GHE-based methods were claimed to have solved the distortionproblems, a recent study by [1] reveals that the proposed modificationsstill fail to avoid the presence of undesirable distortions judging from the resultant output images in Fig.2 ((a), (b), (c) and (d)). Notice the red arrow pointing atthe location of noise artifacts (there could be more than one location that shows noiseartifacts in the output images).
The goal of image quality assessment algorithm (IQA) is to automatically assess the quality of images. All previous works mentioned above were depend on and evaluated by Absolute Mean Brightness Error (AMBE) and Entropy which are the two popular image quality assessment algorithms (IQAs) for evaluation of Global Histogram Equalization (GHE) based contrast enhancement techniques as shown inTable 1.A recent study held by [14] revealed that the two IQAs have poorcorrelation with human visual perception (HVP) of distortions.
Fig.2An example of original image Building and its output of GHE, BBHE and DSIHE [1].
TABLEI
OBJECTIVE METRICS USED TO EVALUATE SOME AUTOMATIC METHODS
Method Objective Metrics
BBHE AMBE
Multi-peak AMBE
DSIHE
AMBE Entropy Background brightness
MMBEBHE AMBE
BPHEME AMBE
Entropy
In this paper, a new subjective experimentto review the existing image quality assessment algorithms (IQAs) used for evaluation of GHE-based contrast enhancement methods. In Section II, the existing IQAs are reviewed and their restrictions are discussed. In Section III the details of the experiment to evaluate the IQAs’ correlation with subjective human visual perception (HVP) of distortions is expanded. Section VI discusses the results and findings from the experiment and
section V provides the conclusion and
II.THE WEAKNESSES OF OBJECTIVE METRICS
This section tospecifies that both AMBE and
Entropy are poor noise artifacts and
saturationindicator. Hence, all the previous
evaluation methods that highlight on these two IQAs may be insufficient.
A. AMBE WEAKNESS
AMBE is the absolute difference between mean input and output image brightness andbasically can
be defined as = |E X − E Y |,Where X
and Y denote the input and output image respectively, and E (·) denotes theexpected value, i.e. the statistical mean. According to [1], AMBE isdesigned to detect the excessive brightness changedistortion. Hence, it does not takenoise artifacts and brightness saturation distortions into account. Therefore using AMBEto detect other types of distortions could be misleading as shown in Fig.3 and Fig.4. Incurrent practice, lower AMBE infers that original brightness is better preserved andshould result in a better quality output.
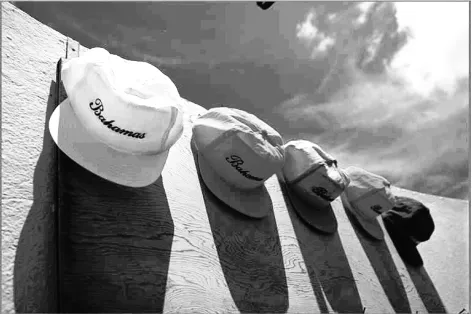
Fig. 3 An example of Caps image with AMBE values: 37.31.
Based on Fig.4, Caps image with less AMBE (14.02) obviously show the noise artifacts distortion in the background and brightness saturation in the image while it is not seen in Fig.3 with high AMBE
(37.31). This result verifies that
brightnesspreserving method is not resilient to noise artifacts and saturation.
Fig. 4 An example of Caps image with AMBE values:14.02.
B. ENTROPY WEAKNESS
Entropy is a measure of the uncertainty associated with a random variable (ShannonEntropy) as (1).
= = − 1
Where X is an image, xi is the gray level I, p(xi) : probability of gray level I, b : units, (inthis case, the unit is bit, so b = 2) , and n : number of gray levels. It counts in the sense ofan expected value, the information contained in an information source (the image),usually in units such as bits. Hypothetically, higher entropy means more information isavailable
from the information source such as an
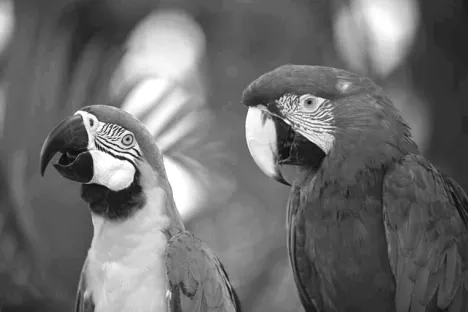
image.Therefore, an image havinghigher entropy is considered to have a better quality. Since the global gray levels haverelatively low probability density, GHE tends to combine them and results in decreasingof entropy although such action tends to increase the contrast of an image. In currentpractice, lower entropy infers the opportunity of gray level saturation [15]. Notice that the adapted image of
Fig. 5An example of Parrots image Entropy values: 5.74.
Fig. 6An example of Parrots image Entropy values: 5.72.
III. EVALUATIONMETHODOLOGY
A. Experimental Design
The experimental setup isDouble Stimulus Continuous Quality Scale(DSCQS) /Degradation Category Rating (DCR) method when reference and distorted images are shown. A total of 1032 ‘ground truth’ human observer scores MOS have been successfully gathered. The scores were then used to evaluate the performance of the tow IQAs. All statistical functions and processes applied for collected data were made in Matlab (2015b).Human observer needs to rate the level of impairment for each distorted image as compared to the reference as illustrated in Table 2.
TABLEII FIVE LEVELS SCORING SCALES
B. Test Images
A total of 43 test images derived from 9 source images were involved in the experiment.The source images used embraces pictures of natural scenes, animals, man-made objects, wide-angle shots as well as images with distinct background.
C. Pre-processingof Source Images
The pre-processing steps were designed based on the guidelines proposed by [16]. The first step is using imwrite function to JPEG compress the original images at quality (Q=50). This is to emulate real life photo where images are distorted
during compression.Next, by using imadjust
function with [low-out high-out] = [0.2 0.8]. The images will be contrast-reduced which will leave room for contrast enhancement process.
D. Generating Test Images
In this phase, each image will be processed using a variant of GHE proposed by[16] and[17] called Scalable Global Histogram Equalization with
Selection Enhancement (SGHESE) that
interactively allows user to regulate the degree of contrast enhancement. In this experiment, test images with various degree of annoyance were generated from source images via SGHESE.
E. Viewing Conditions
This experiment was conducted in Computer Department / Faculty of Educationfor Woman Image Processing lab fitting in 8 human observers in three times and is fully air-conditioned and comfortable with normal indoor lighting level. A total of 16laptop corei5 computers were used that supports 2 separate 15” LED, native resolution at
DCR
Scale Equivalent Scoring Scale Level of Impairment
1 0 – 20 Very Annoying
2 21 – 40 Annoying
3 41 – 60 Slightly Annoying
4 61 – 80 Perceptible but not
annoying
F. Human Observers
In this experiment, a total of 24 human observers participated in evaluating the quality of the test images. They were female ages 19 and above. They were inexperience in assessing image quality and distortions as well as free from vision problems and all conditions are under the recommendations of VQEG [18].
G. Outlier Detection and Subject Rejection
This procedures need to be carried out on the raw scores. A data point that is far outside the norm for a variable or population can be defined as outlier. It is often caused by human error such as errors in data collection, recording or entry. If the raw score for an image is outside an interval of 2.33 standard deviations about the mean score for that image, then it will be measured as an outlier. In a same time, if there is one subject that has more than 6 scores as outliers, all of his scores will be rejected. In this experiment, no subject is considered as rejected subject score.
H. Normalization of Scores
In continuous, the scores of the remaining subjects will be normalized using Z-scores before one can compute Mean Opinion Score (MOS) and then, all scores of all rankings will be within the same range. The Z-scores for ith subject and jth image can define as follow.
= − ̅ 2
Where Sijis the raw score for ith subject and jth
image, and Siis the average of all the scores rated
by subject i, then to calculate the MOS for jth image, the previously computed Z-scores will be averaged across subjects can defined as follow.
# =1 $
3
S represents the total number of subjects after subject rejection.
IV. RESULTS AND DISCUSSION
A. Performance Metrics
The performance metrics were chosen based on the recommendation from VQEG [18].
• Pearson Correlation Coefficient (PCC) and Root Mean Squared Error (RMSE): it used to measure the ability to predict the subjective quality score with low error (Prediction Accuracy). • Spearman Rank Order Correlation Coefficient
(SROCC): it used to measure the degree to which the IQA’s prediction agrees with the relative magnitudes of the subjective quality rating (Prediction Monotonicity).
• Outlier Ratio (OR): it used to measure the degree to which the metric maintains prediction accuracy over different types of images and not to fail excessively for a subset of images (ratio of outlier to total scores) (Predication Consistency).
The Interpretation of Correlation Values for (PCC, RMSE and SROCC) as shown in Table 3.
TABLEIII
INTERPRETATION OF CORRELATION VALUES
The evaluation was done using MOS after non-linear regression with five-parameter logistic function (a logistic function with an added linear term, constrained to be monotonic) [19] as defined by (4).
= & '1 12 −()& 1
* − &+ ,- + &/ + &0 4
This nonlinearity was applied to the MOS or its logarithm, which ever gave a better fit for all data.
B. Discussion
Based on the interpretation of correlation values in Table 3 andthe results showed in Table 4,then can indication that:
Value of Correlation Interpretation
0.00 – 0.40 Poor
0.41 – 0.75 Fair
0.76 – 0.85 Good
• In terms of (PCC and RMSE): AMBE has poor correlation while Entropyhas slightly fearcorrelation with HVP.
• In terms of (SROCC): AMBE and Entropy
have poor correlation with HVP.
• The difference between AMBE and Entropy
in PCC, RMSE and OR could be marginal.
TABLEIV
THE RESULTS OF PEARSON CC,RMSE,SROCC AND OR
V.CONCLUSIONS
Two most popular objective metrics (AMBE and Entropy) used for evaluation of GHE-based contrast enhancement techniques have been reviewed and their weaknesses have been pointed.A DCR evaluation experiment has been conducted to measure these IQAs performance in term of their correlation with HVP of distortions. The results showed that AMBE and Entropy have poor correlation with HVP.They cannot detect the presence of noise artifacts and gray level saturation effectively. It is essential for further research to have reliable objective metrics that can simulate human vision perception andto develop models for
automatic GHE-based contrast enhancement
methods which can be used for consumer electronics.
REFERENCES
[1] Ooi, C. H., Kong, N. S. P., & Ibrahim, H. (2009). Bi-histogram equalization with a plateau limit for digital image enhancement. Consumer Electronics, IEEE Transactions on, 55(4), 2072-2080.
[2] Kim, Y. T. (1997). Contrast enhancement using brightness preserving bi-histogram equalization. Consumer Electronics, IEEE Transactions on, 43(1), 1-8.
[3] Wongsritong, K., Kittayaruasiriwat, K., Cheevasuvit, F., Dejhan, K.,
[4] Wang, Y., Chen, Q., & Zhang, B. (1999). Image enhancement based on equal area dualistic sub-image histogram equalization method. Consumer Electronics, IEEE Transactions on, 45(1), 68-75. [5] Chen, S. D., &Ramli, A. R. (2003). Minimum mean brightness error
bi-histogram equalization in contrast enhancement. Consumer Electronics, IEEE Transactions on, 49(4), 1310-1319.
[6] Wang, C., & Ye, Z. (2005). Brightness preserving histogram equalization with maximum entropy: a variational perspective. Consumer Electronics, IEEE Transactions on, 51(4), 1326-1334.
[7] Ibrahim, H., & Kong, N. S. P. (2007). Brightness preserving dynamic histogram equalization for image contrast enhancement. Consumer Electronics, IEEE Transactions on, 53(4), 1752-1758.
[8] Menotti, D., Najman, L., Facon, J., & de Araujo, A. A. (2007). Multi-histogram equalization methods for contrast enhancement and brightness preserving. Consumer Electronics, IEEE Transactions
on,53(3), 1186-1194.
[9] Kim, M., & Chung, M. (2008). Recursively separated and weighted histogram equalization for brightness preservation and contrast enhancement.Consumer Electronics, IEEE Transactions on,54(3), 1389-1397.
[10] Ooi, C. H., Kong, N. S. P., & Ibrahim, H. (2009). Bi-histogram equalization with a plateau limit for digital image
enhancement.Consumer Electronics, IEEE Transactions on,55(4), 2072-2080.
[11] Ooi, C. H., & Isa, N. A. M. (2010). Adaptive contrast enhancement
methods with brightness preserving.Consumer Electronics, IEEE
Transactions on,56(4), 2543-2551.
[12] Yun, S. H., Kim, J. H., & Kim, S. (2010). Image enhancement using a fusion framework of histogram equalization and laplacian
pyramid.Consumer Electronics, IEEE Transactions on,56(4), 2763-2771.
[13] Sengee, N., Sengee, A., & Choi, H. K. (2010). Image contrast enhancement using bi-histogram equalization with neighborhood metrics.Consumer Electronics, IEEE Transactions on,56(4), 2727-2734.
[14] Nur-Hanani, A. (2012). A Comparative Study of Image Quality Assessment Algorithms for Image Contrast Enhancement.MS. Thesis, College of Graduate Studies, Universiti Tenaga Nasional.
[15] Nur H. A., S.-D. Chen (2011). An evaluation of Image Quality Assessment Algorithm for Global Histogram Equalization, SCOReD. [16] Chen, S. D. (2007). Regulating The Degree Of Contrast Enhancement
In Global Histogram Equalization-Based Method For Grayscale Photo Processing (Doctoral dissertation, Universiti Putra Malaysia). [17] Soong-Der Chen &Azizah Suleiman (2008). Scalable Global
Histogram Equalization with Selective Enhancement for Photo Processing. Proceedings of the 4th International Conference on Information Technology and Multimedia, Malaysia.
[18] Video Quality Experts Group. (2003). Final report from the Video Quality Experts Group on the validation of objective models of video quality assessment, phase II.VQEG, Aug.
[19] H.R. Sheikh, M.F. Sabir and A.C. Bovik, "A statistical evaluation of recent full reference image quality assessment algorithms", IEEE Transactions on Image Processing, vol. 15, no. 11, pp. 3440-3451, Nov. 2006.
Objective
Metrics Pearson CC RMSE SROCC OR
AMBE 0.3053 0.1092 0.0210 0.3261