Research Journal
Volume 11, Issue 2, June 2017, pages 103–117
DOI: 10.12913/22998624/70565 Research Article
MODELLING CHARACTERISTICS OF SPARK IGNITION
ENGINE INJECTION SYSTEM
Mieczysław Dziubiński1, Grzegorz Litak1, Artur Drozd1, Piotr Żukowicz1
1 Lublin University of Technology, Faculty of Mechanical Engineering, Nadbystrzycka Street 36, 20-618 Lublin, Poland, e-mail: [email protected], [email protected], [email protected], [email protected]
ABSTRACT
The carried out modelling of SI engine injection system characteristics in various steady-state conditions has been presented in the article. Also, the two ways of deter-mining injection time have been shown: by means of a virtual model made with the use of software worked out by National Instruments LabVIEW and on the experimen-tal test stand ‘’Integrated injection-ignition system of the K16 engine”.
Keywords: modelling, simulation, diagnostics, injection system, experiment.
INTRODUCTION
Diagnostic inference on the grounds of dis-covering and analysing incoherence is a relatively new way of diagnostic inference based on a for-mal theory presented in Reiter`s paper (1987). The inference consists in comparing the observed behaviour of the system with the behaviour antic-ipated on the basis of the knowledge of its model. Thus, such inference does not require expertise, gathering observation and experience or teach-ing the diagnostic system. However, knowteach-ing the model of the system making it possible to antici-pate its proper behaviour is required. To be more exact, what is meant here is the model of proper behaviour of the system, that is the model making it possible to simulate the proper operation of the system in the conditions of the lack of failure.
Both the real system and its model process the same input signals. The output of the system is compared with the expected output signal an-ticipated on the basis of the model. The difference between those signals, the so called residuum R, is directed to the diagnostic system DIAG. When the residuum equals zero (with particular set ex-actness), it means that the current behaviour of the system does not diverge from the expected behaviour obtained on the basis of the familiar
model; in such a case it should be stated that the system works properly.
If the observed behaviour of the system (of its output) measurably differs from the behaviour determined on the basis of the model of system proper behaviour, it should be stated that the current behaviour is incoherent with the model. Discovering such a behaviour proves that there is a failure (correctness and satisfactory accuracy of the model is assumed), so the detection of the system failure takes place. In order to determine potential diagnoses, proper reasoning allowing changes (modifications) of assumptions concern-ing the model of the system should be conducted. In this way, a potential diagnosis (or a set of diag-noses) is obtained.
Modern systems of controlling internal bustion engines with spark ignition are very com-plex units [1, 4, 5, 9]. On the one hand, it means a danger of lower reliability resulting from a grow-ing number of components. However, on the oth-er hand, diagnosing by means of ECU is becom-ing possible. An electronic control unit (so called ECU) gathers information from various sensors: cooling liquid temperature sensor, inlet air tem-perature sensor, sensor of absolute pressure in the suction manifold, engine rotational speed sen-sor or sensen-sor of oxygen in fumes. On the basis
Advances in Science and Technology Research Journal Vol. 11 (2), 2017
of the information from those sensors, it adjusts injection time, so that it is the most optimal for particular working conditions. The results of the diagnosis are recorded in the driver memory and transmitted to ‘‘Check Engine”.
VIRTUAL MODEL OF ELECTRONIC
DEVICE CONTROLLING ZI ENGINE –
‘’VIRTUAL ECU MODEL’’
The simulation model of controlling injec-tion time was made in G language with the use of the Lab VIEW software. The main part of the program is the control panel made in the program Front Panel, which enables modelling injection time depending on input parameters (signals) [10÷12, 15].
Input signals are the following :
• cooling liquid temperature;
• engine rotational speed;
• throttle evasion angle;
• absolute pressure in the suction manifold;
• voltage signal of the oxygen sensor;
• voltage of injection-ignition system supply. The output signal is the calculated injection time and the engine failure control , the so-called ‘’Check engine’’. In order to simulate all kinds of sensor failures, respective logical buttons (true/ false) have been introduced. The following fail-ures can also be simulated in the program:
• lack of signal from lambda sensor,
• lack of signal from cooling liquid temperature
sensor,
• failure of throttle position sensor,
• lack of engine rotational speed signal (CPS sensor).
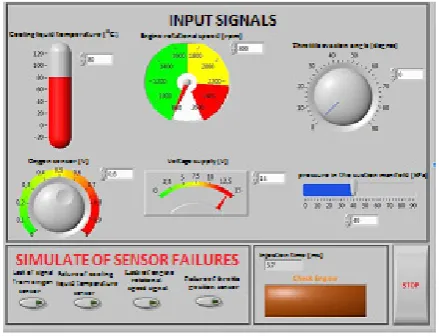
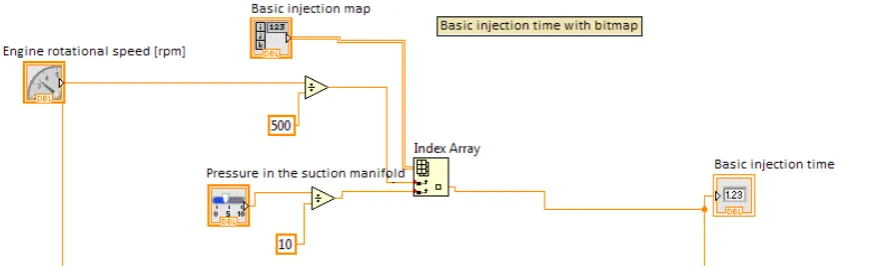
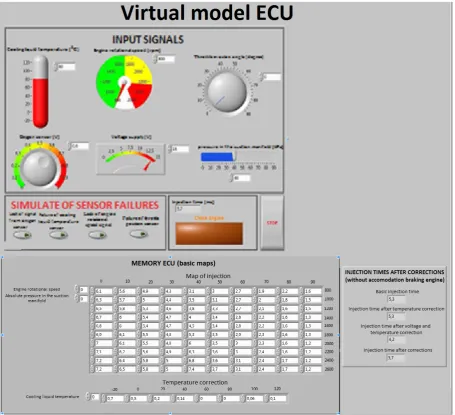
Figure 1 shows the control panel of spark igni-tion engine virtual driver.Basic parameters of mix-ture composition are stored in a form of a three-di-mensional map. In the virtual model, basic injection time value was realized with the use of a three-di-mensional array. The array was searched by means of the Index Array function. The function returns an element from the array or a particular fragment of the array. The function is scaled and can operate on arrays of different sizes. The tested array is con-nected to the n-dimension array input and by means of index 0...n-1 inputs it can be determined which element of the created array will be read.
Fig. 1. Control panel of the virtual control device made in the LabVIEW program
Figure 2 shows a map of injection fed into the Front panel, and Figure 3 presents the way of reading basic injection time in the worked out program. Further in the program, basic in-jection time is subject to certain corrections, such as injection time correction depending on: the signal from cooling liquid temperature sensor, in relation to the voltage in car wiring system, depending on the lambda sensor sig-nal as well as the fuel cut-off while realizing engine work phase, which is the so-called ‘’en-gine braking”. In order to realize the simulation of particular sensors failures, bistate switches ‘’ON-OFF’’ were used.
As it has already been mentioned, the first thing done was correcting basic injection time according to cooling liquid temperature value. The characteristics of temperature correction coefficient is fed into the program as a one-dimensional array, which is shown in Figure 4.
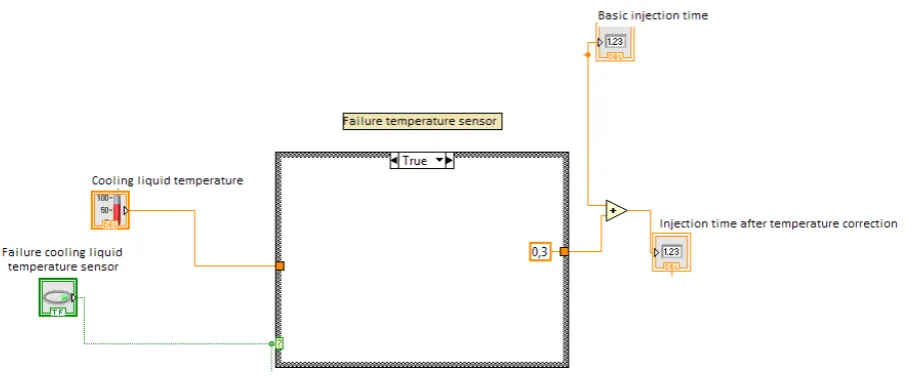
The correction calculated in such a way is then added to basic injection time. The tempera-ture correction is placed in a logical choice struc-ture. Such a procedure aims at taking into account the failure of engine temperature sensor.
When a failure of cooling liquid temperature sensor occurs, the correction coefficient is con-stant [2]. In such a case, 30% of fuel-air mixture enrichment is added to basic injection time. Fig-ure 5 illustrates such a situation.
Another important injection time correction is voltage correction. Voltage correction in the program was made by means of basic mathemati-cal operations. Supply voltage was multiplied by the constant value which equals 0,2 and then 3,6 was added to the obtained value. The outcome of voltage correction was multiplied by injec-tion time after temperature correcinjec-tion and this way injection time after appropriate corrections, temperature and voltage ones, was obtained. The Fig. 3. Reading basic injection time from the introduced array
Advances in Science and Technology Research Journal Vol. 11 (2), 2017
Fig. 5. Temperature correction diagram in case of the lack of signal from engine temperature sensor (damaged cooling liquid temperature sensor - True)
Fig. 6. Concept of injector opening time correction in relation to supply voltage value
concept of realizing the correction of injector opening in relation to supply voltage value has been presented in Figure 6.
The last correction was the correction of sig-nal coming from the sensor of oxygen in fuel. The correction was also made by means of the logical choice structure aiming at signalizing the lack of lambda sensor signal. Injection time correction depending on lambda sensor signal consisted in multiplying the signal from lambda
sensor by the value -1 and then adding the value 0,2 to the obtained result. The purpose of such an operation was to reflect the enrichment and depletion of the mixture ranging from -20% to 20%. The result obtained from the presented cor-rection was multiplied by the result obtained af-ter temperature and voltage corrections. The final result obtained in such a way is the duration of impulse controlled by the injector (Fig.7). In case of lambda sensor failure, the correction has its Fig. 8. Concept of injector opening time correction in the event of oxygen in fuel sensor failure
Advances in Science and Technology Research Journal Vol. 11 (2), 2017
Fig. 10. Diagram of realizing fuel cut-off when the condition of rotational speed is not satisfied
constant value equalling 20% of the previously calculated injection time value [8], which has been presented in Figure 8.
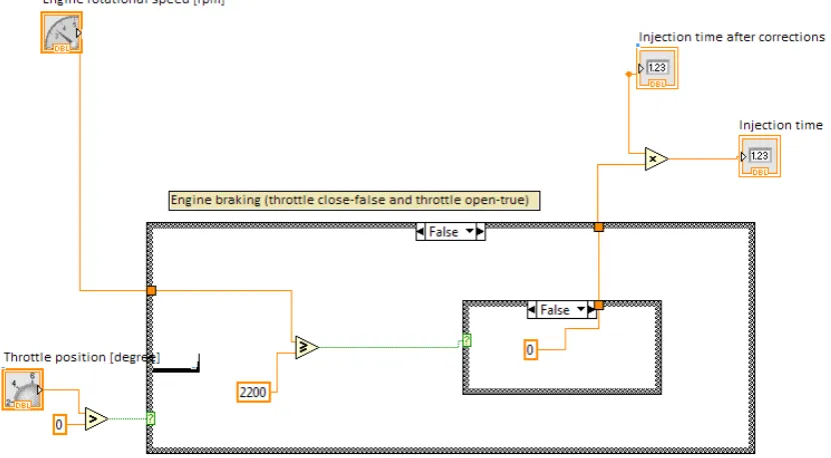
During engine braking, that is in the con-ditions of appropriate engine rotational speed and at closed throttle, the fuel cut-off occurs in order to reduce combustion [3, 6, 7]. Figure 9 illustrates the case of fuel cut-off. It can be seen in the figure that if the condition ‘’throttle position is above zero’’ is not satisfied and the rotational speed exceeds or equals the value of 2200revs/min, engine braking occurs, which
means that injection time after the corrections is multiplied by zero.
When the rotational speed value is lower than 2200 revs/min, the calculated injection time after the corrections is unchanged, so it is multiplied by the value 1, which is presented in Figure 10. Such a concept aims at eliminating error, which can result in no fuel feeding in case of idle engine running.
a)
b)
Fig. 12. Realization of message display at the lack off rotational speed signal
Advances in Science and Technology Research Journal Vol. 11 (2), 2017
the unit works without the impact of fuel cut-off function during engine braking, which is illustrated in Figure 11.
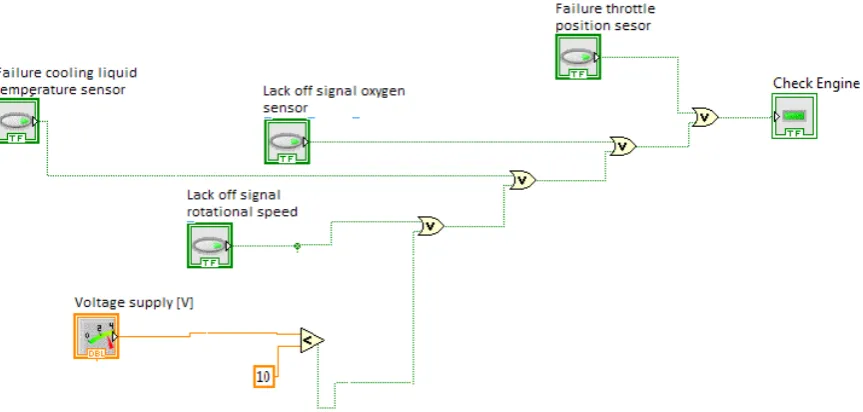
During the simulation of particular sensors failures, apart from the basic injection time cor-rection, the engine control lights as well, which was realized by means of Boolean function just as the simulation of sensors failures. As it has already been mentioned, the failure of the sen-sor (true-1 value of the button) results in the in-crease of injection time and lighting of the men-tioned above ‘’check engine’’ control. In case of supply voltage, the lighting of the control causes voltage decrease below the value of 10V. Error signalling was realized by means of the logic gate OR; the control lights when only one condition is satisfied (in this case it was press-ing the button of failure simulation or supply voltage below the value of 10V).
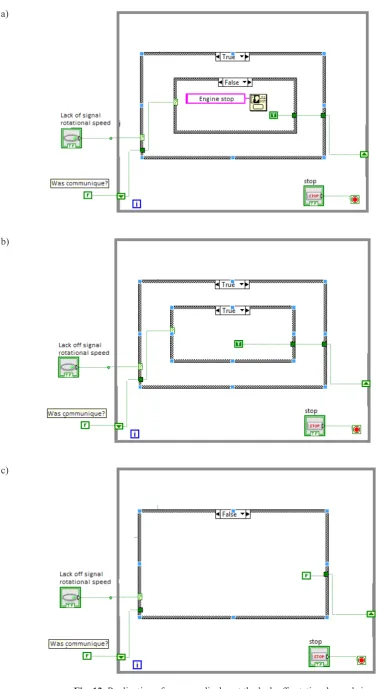
Displaying the massage ‘’Engine stall’’ was also added to the simulation of the lack of signal from engine rotational speed sensor. Leaving such a message would result in the stoppage of program operation because the program works in While Loop, that is in a continuous operating mode (stopping the program results in press-ing the STOP button). Avoidpress-ing such a situa-tion was realized by using the shift register. The shift register was used for temporary storage of data for calculations/message. Thanks to the use of the register, the message appears at the lack of engine rotational speed signal and disappears after clicking on the OK button. The realization of the shift register is shown in Figure 12, and
the diagram of error circuit realization has been presented in Figure 13.
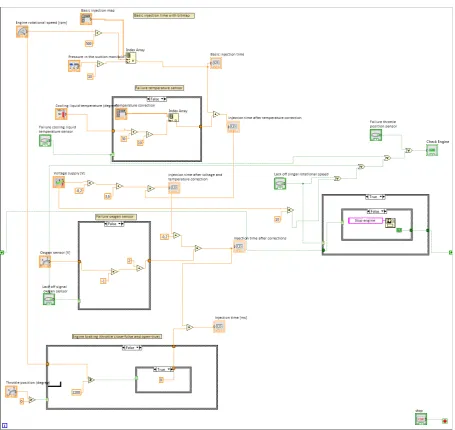
While finishing discussing operation prin-ciples of the program reflecting the work of engine control electronic unit (ECU), it is also worth to present the whole control panel: knobs simulating input signals, array of basic injection time and temperature correction, which reflects driver memory and values of injection times af-ter each realized correction (Fig. 14). The di-agram of the program written in LabVIEW is presented in Figure 15.
STAND FOR TESTING THE
INJECTION-IGNITION SYSTEM OF K16 ENGINE
The stand for testing the injection-ignition system of K16 engine serves the purpose of real simulation and verification of injection system characteristics for the engine with spark igni-tion. An integrated injection system MEMS (Modular Engine Management System), which was worked out thanks to the cooperation of two companies, Rover and Motorola, was used to build the stand. Basic parameters of mixture composition are stored in a form of a three-di-mensional map, and the signals of engine load and speed decide about the choice of parameters from the map. Injection time undergoes appro-priate corrections and then it is calculated by engine ECU. In the discussed injection-ignition system, the following functions are programmed in the memory of a controlling device:
Fig. 14. Control panel of ECU virtual model made in the LabView program
• controlling the injected fuel dose during en-gine start-up;
• choosing optimal advance angle;
• controlling the fuel pump (engine braking);
• adaptation mode;
• self-diagnostics;
• emergency operation mode;
• engine control while idling.
The following sensors and working elements are part of the injection system:
• sensor of pressure in the suction manifold – MAP sensor;
• sensor of the crankshaft position – CPS;
• sensor of cooling liquid temperature (engine temperature) – ECT;
• sensor of sucked-in air temperature – IAT;
• sensor of the throttle position – TPS;
• lambda sensor – sensor of oxygen in fumes;
• valve of fuel vapour absorbent – EVAP valve;
• fuel pump;
• inertial switch;
• pintle injectors.
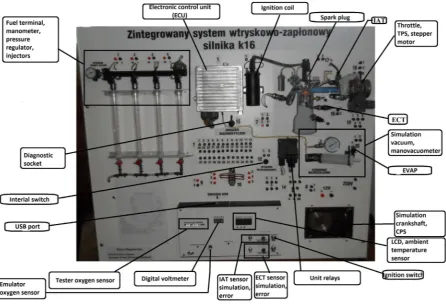
Figure 16 shows a block diagram of the ex-perimental test stand ‘’Integrated injection-igni-tion system’’. Figure 17 presents a photograph of the stand used for modelling characteristics of injection time in an integrated injection-ignition system made by Rover as well as the description of particular component elements.
The fuel pump together with the filter and the fuel tank were placed at the back of the stand.
suc-Advances in Science and Technology Research Journal Vol. 11 (2), 2017
Fig. 15. Program of ECU virtual model written in the G language in the LabView program
tion manifold in real conditions, was performed with the use of the syringe.
The value of pressure can be read by means of a vacuum manometer placed above the syringe. The manometer next to the injection bar is used for reading the fuel pump pressure. The LCD dis-play is used for disdis-playing injection time, engine revolutions, temperature of the environment, and also makes a chart of lambda sensor emulator. By means of the potentiometer of lambda sensor emulator, the frequency of lambda sensor signal can be adjusted.
7-segment LED displays are used to display the voltage of stand supply (a digital voltmeter). Failures of particular sensors of the MEMS system were also simulated on the real stand. The MEMS injection is also equipped with a three-pin diagnostic socket enabling the communication with a PC which has
proper diagnostic software. Revolutions control is carried out with the use of an autotransformer.
RESULTS OBTAINED FROM THE VIRTUAL
MODEL AND THE EXPERIMENT STAND
Fig. 16. Block diagram of the experimental test stand
Advances in Science and Technology Research Journal Vol. 11 (2), 2017
rotational speed value. Such a characteristic is a basic map of injection time in the MEMS sys-tem, stored in the memory of an electronic de-vice controlling the engine. The table was used for realizing the mentioned above three-dimen-sional array of basic injection time, made in the virtual model in the LabVIEW program.
In this simulation, the value of negative pressure in the suction manifold was changed. The rotational speed in the crankshaft simula-tion was also subject to changes. Another mod-elled characteristic was the dependence of injec-tion time change on cooling liquid temperature value. Modelling this characteristic consisted in simulating the change of cooling liquid tem-perature value and rotational speed value. The purpose of such a simulation was to observe the temperature correction of injection time. The surface diagram of this characteristic has been presented in Figure 19.
On the basis of the characteristic shown in Fig. 18, it can be stated that injection time decreases together with the increase of absolute pressure in the suction manifold. It follows from Fig. 19 that the highest injection time was 8,3 [ms] at ro-tational speed of 2600 [revs/min] and simulated cooling liquid temperature of -20ºC. A consider-able decrease in injection time can be observed when the simulated cooling liquid temperature exceeds 70ºC. During the tests, injection time for proper engine temperature (80ºC) amounted to 3,0 ms for idle running (800 revs/min), which is a probable value in real conditions.
Fig. 18. Surface diagram of injection time depending on the simulation of the value of negative pressure in
the suction manifold
Fig. 19. Fuel injection time for the tested injector tw4 = f(Ts)
Fig. 20. Surface diagram presenting the change of fuel injection time for the tested injector depending
on the value of injection system supply voltage
The purpose of modelling this characteris-tic was to reflect phases of engine warm-up in real conditions. After modelling basic charac-teristics, the simulation of various engine fail-ures was started. The first characteristic that was carried out was the simulation of an alternator failure. Modelling this characteristics consisted in changing supply voltage and rotational speed values and observing changes in injection time after the voltage correction. A three-dimensional diagram of this characteristic has been presented in Figure 20.
2,2÷1,6 bar and a considerable lengthening of injector opening time, which results in substan-tial deterioration of the quality of fuel stream sprayed by injectors. The purpose of the simula-tion was to observe injecsimula-tion time changes de-pending on the voltage drop in the wiring system supplying the vehicle.
In reality, such a situation can be observed in the event of alternator failure, which results in voltage value decrease in the car wiring sys-tem. Low charging voltage generated by the
alternating current generator may be caused by bad condition of ‘’altrnator brushes’’, their hang, bad condition of slip rings or a failure of a voltage control. The last simulation which was carried out was modelling the characteristic of supply system depending on the lack of signal from the sensor of cooling liquid temperature and the sensor of oxygen in fumes, and then summing up all those failures. The line chart of injection time depending on a simulated failure is presented in Figure 21.
Fig. 21. Line chart showing changes of injection duration for failures of particular sensors being parts of the injection-ignition system of K16 engine
Advances in Science and Technology Research Journal Vol. 11 (2), 2017
It can be concluded from the above chart that the engine controller ‘’fell into’’ the emer-gency mode, which caused adequate length-ening of injection time. What had the biggest impact on injection time lengthening was the lack of signal from the sensor of cooling liquid temperature and from the lambda sensor. After modelling the characteristic, it can be stated that the engine control, the so-called ‘’Check Engine’’, cannot be neglected because, as it can be observed, it results in the lengthening of injection time and consequently the violation of Euro ecological norms and it also consider-ably increases the cost of vehicle use.
The last stage of investigation was comparing the results obtained from the virtual model made in the G language and from the experimental test stand using the MEMS injection system made by Rover. Figures 22, 23 and 24 illustrate relevant
bar charts presenting the comparison of injection time characteristics depending on the following values: cooling liquid temperature, supply volt-age and system failure simulation.
CONCLUSIONS
The purpose of the virtual model and the experiment stand presented in the article is to simulate the driver operation for selected fail-ures of particular sensors of ZI engine control system. They make it possible to observe sig-nals entering control devices of modern engines with spark ignition. The advantage of the virtual model of the device controlling SI engine is the possibility of changing the introduced bitmap into another one very quickly and also checking if it works correctly.
Fig. 23. Comparison of results obtained from experiment and simulation tests concerning injection time change in relation to the value of supply voltage which was used
The simulation of various failures in the sys-tem directly influencing injection time was car-ried out on the objects. The algorithms worked out in the virtual model and sensor failures simu-lated on the experiment stand of the combustion engine reflect various stages of engine operation: engine start-up, engine warm-up, normal opera-tion, and also engine braking. On the basis of the obtained results a diagnostic model making it possible to recognize a failure can be worked out.
REFERENCES
1. Adamiec M. and Dziubiński M. Alkaline fuel cell - aspect of efficiency. Przegląd Elektrotechniczny,
4, 2009.
2. Andrianov D., Manzie C. and Brear M. Spark igni-tion engine control strategies for minimising cold start fuel consumption under cumulative tailpipe emissions constraints. Control Engineering Prac-tice, 21(8), 2013, 1007–1019.
3. Boguta A. and Styła S. The graphic programming
using simulation in the SI and CI engine manage-ment system. Autobusy. Technika, Eksploatacja, Systemy Transportowe, 2013, 3, 947-950.
4. Dziubiński M., Drozd A., Adamiec M. and Siemi -onek E. Electromagnetic interference in electrical systems of motor vehicles. Materials Science and Engineering. IOP Conference Series, 148, 2016. 5. Dziubiński M., Drozd A., Adamiec M. and Siemi
-onek E. Energy balance in motor vehicles. Ma-terials Science and Engineering. IOP Conference Series, 148, 2016.
6. Dziubiński M. Ecological aspect of electronic ig -nition and electronic injection system. Environ-ment engineering V. CRC Press Taylor and Francis Group, 2016, 299-304.
7. Dziubiński M. Testing of exhaust emissions of vehi -cles combustion engines. Environment engineering V. CRC Press Taylor and Francis Group, 2016, 305-310. 8. Issermann R. Model-based fault-detection and
di-agnosis – status and applications. Annual Reviews in Control, 29(1), 2005, s.71-75.
9. Nouraei H., Ben-Mrad R. and Sinclair A. Devel-opment of a Piezoelectric Fuel Injector. IEEE Transactions on Vehicular Technology, 99, 2015, 1-8.
10. Nyberg M. and Frisk E. A derivation of the min-imal polynominal basis approach to linear re-sidual generation. Journal of Automatica, 37(9), 2001, 1417-1424.
11. Patton R. and Chen J. Design methods for robust fault diagnosis. Control system Robotics and Au-tomation, 26, 2005.
12. Patton R., Uppal F. and Lopez-Toribio J. Soft Computing Approaches To Fault Diagnosis For Dynamic Systems: A Survey Proc. of 4th IFAC Symposium on Fault Detection Supervision and Safety for Technical Processes, Budapest, Hungary 2000, 298-311.
13. Payri R., Salvador F., Manin J. and Viera A. Diesel
ignition delay and lift-off length through different
methodologies using a multi-hole injector. Applied Energy, 162(15), 2016, 541-550.
14. Wang Z., Ding H., Ma X., Xu H. and Wyszynski M. Ultra-high speed imaging study of the diesel spray close to the injector tip at the initial open-ing stage with split injection. Applied Energy, 163, 2016, 105-117.