http://dx.doi.org/10.9717/JMIS.2015.2.2.221
221
I. INTRODUCTION
Applied medical research is becoming rapidly developed and more dependent on imaging for diagnosis the serious and critical diseases of human body. Thus, dedicated image analysis software is needed for quantitative medical imaging [1]. Medical imaging is the technique used to create images of the human body for clinical purposes, especially for analyzing some anatomy related abnormalities.
Several data visualization and analysis environments have been developed over the past decades, which claim to meet the requirements of the users in the field of computer and computational science [2]. Which visualization and analysis environments are available for diagnosis different diseases based on different data types, such as electromagnetic signals and images;
MRI is the most common medical imaging technique used for diagnosing brain-related diseases. The major advantage of MRI is that it provides more detailed images than X-ray, ultrasound or CT [3]. MRI can also produce images in various shades of color, indicating the different conditions of the tissue under the investigation.
The most common way to diagnose the disease is to compare images of suspect organ with images of a healthy person’s organ [4]. However, sometimes, a simple two-dimensional comparison is not sufficient to recognize the disease, so clinicians need to observe the organ in a three dimensional view [5]. The primary purpose in designing this software was to 3D render, visualize and segment the brain MR images to observe and measure volume shrinkage and deformities of the hippocampus.
In this work, we develop a new 3D rendering software for MR images visualization and analysis for hippocampus segmentation [6]. The main framework is based on Microsoft .NET and it integrated with C# wrapper of VTK library (Activiz.NET) as a rendering kernel. Visualization in C# language using VTK potential can be implemented using Activiz.NET library, which is an advanced, open-source software package containing .NET wrapper for all VTK objects.
The Visualization Toolkit (VTK), a widely used library for visualization, is a primary resource for achieving rapid development of medical imaging tools in cost-effective
way [7]. VTK is an open-source, freely available software
system for 3D computer graphics, modeling, image
3D Rendering of Magnetic Resonance Images using Visualization
Toolkit and Microsoft.NET Framework
Author: Nuwan Madusanka
1,
Naim Al Zaben
2,
Alaaddin Al Shidaifat
1,
Heung-Kook Choi
1,*Abstract
In this paper, we proposed new software for 3D rendering of MR images in the medical domain using C# wrapper of Visualization Toolkit (VTK) and Microsoft .NET framework. Our objective in developing this software was to provide medical image segmentation, 3D rendering and visualization of hippocampus for diagnosis of Alzheimer disease patients using DICOM Images. Such three dimensional visualization can play an important role in the diagnosis of Alzheimer disease. Segmented images can be used to reconstruct the 3D volume of the hippocampus, and it can be used for the feature extraction, measure the surface area and volume of hippocampus to assist the diagnosis process. This software has been designed with interactive user interfaces and graphic kernels based on Microsoft.NET framework to get benefited from C# programming techniques, in particular to design pattern and rapid application development nature, a preliminary interactive window is functioning by invoking C#, and the kernel of VTK is simultaneously embedded in to the window, where the graphics resources are then allocated. Representation of visualization is through an interactive window so that the data coul d be rendered according to user’s preference.
Key Words: Rendering, MR images, C# wrapper, VTK.
Manuscript received June 20, 2015 ; Revised August 1, 2015; Accepted August 10, 2015. (ID No. JMIS-2015-16) Corresponding Author(*):Heung-Kook Choi, Dept. of Computer Engineering, u-HARC, Inje University, Injero 197, Gimhae, Gyeongnam, 621-479 Republic of Korea, +82 55 320 3437, [email protected]
1Dept.of Computer Engineering, Inje University, Gimhae, Korea, [email protected],
222 processing, volume rendering, scientific visualization, and
information visualization. VTK also includes ancillary support for 3D interaction widgets, two- and three-dimensional annotation, and parallel computing. At its core, VTK is implemented as a C++ toolkit, requiring users to build applications by combining various objects into an application [8]. The system also supports automated wrapping of the C++ core into Python, Java, and Tcl, so VTK applications may also be written using these interpreted programming languages.
II. PROGRAMMING WITH VTK
The VTK is an object-oriented system; the access of class and instance data members is carefully controlled in VTK. In general, all data members are either protected or private. Access to them is through Set and Get methods, with special variations for Boolean data, modal data, strings and vectors. VTK is the most notable algorithm toolkit that aims to provide an algorithm library for medical image processing and visualization in this application development process [9-12]. VTK possesses the classical object-oriented design for taking full advantage of the C++ language capabilities.
Fig.1. Visualization toolkit architecture (a) building application with VTK, (b) VTK Toolkit architecture.
2.1 VTK Interpreted Language Interface
Computer languages are usually two types: compiled languages are interpreted languages. Compiled languages are usually high performing than interpreted languages, but interpreted languages provide greater flexibility to rapid application development. Our experience has shown that interpreted applications can be built significantly faster than compiled applications, mainly through the elimination of the compile/link cycle. Also, interpreted applications are often written in high level languages than compiled languages. This results in simpler to make the application with more compact code that is faster to write and debug [13]. Compiled systems, however, are absolutely necessary when developing high performance visualization application such as real time medical image
processing and visualization. Compiled systems also provide low-level access computer resources.
2.2 VTK Visualization Pipeline Architecture
Visualization transforms data into images that efficiently and accurately represent information about the data. Hence, visualization deals with the issues of transformation and representation. Transformation is the process of converting data from its original form into graphics primitives, and eventually into computer images. VTK applications are largely constructed by connecting vtkAlgorithms together. Each algorithm inspects the dataset or datasets it is given and produces some derived data for the algorithms connected to it. The connected set of filters forms a data-flow network. VTK uses reference counting heavily to eliminate redundant memory consumption and timestamps in the demand-driven network to eliminate redundant computation. Algorithms are strongly type-checked to enforce compatible filter connectivity [14]. VTK has hundreds of algorithms with which to work, from the vtkAbstractMapper to the vtkXMLWriter. Some algorithms are extremely focused in what they can do, while others are completely general such as the vtkPythonAlgorithm.
VTK consists of several major subsystems. Probably the subsystem the most associated with visualization packages is the data flow/pipeline architecture. In concept, the pipeline architecture consists of three basic classes of objects:
1. vtkDataObjects- objects to represent data 2. vtkAlgorithm-objects to process transform, filter
or map data objects from one form into another
3. vtkExecutive- objects to execute a pipeline
which controls a connected graph of interleaved data and process objects
Fig.2. VTK visualization pipeline
(a) (b)
Compiled C++ Class Library Interpreted Interface
http://dx.doi.org/10.9717/JMIS.2015.2.2.221
223 The algorithm objects also introduce their own special complexity. Some algorithms may take multiple inputs and/or produce multiple outputs of different types. Some can operate locally on data (e.g., compute the center of a cell) while others require global information, for example, to compute a histogram. In all cases, the algorithms treat their inputs as immutable, algorithms only read their input in order to produce their output [15-18]. This is because data may be available as input to multiple algorithms, and it is not a good idea for one algorithm to trample on the input of another.
2.3 Volume Rendering with VTK
Volume rendering is a term used to describe a process where information exists throughout a 3D space instead of simply on a 2D surface defined in 3D space. The 3D sampling points do not have color attributes themselves, including gray values; however, volume rendering calculates sampling points contributing to the screen pixels by an optical model, based on re-sampling. The algorithm can generate a 3D data field as a whole high-quality image with easy application of parallel processing [19-23].
The vtkImageData object can be used to represent one, two, and three-dimensional image data. As a subclass of vtkDataSet, vtkImageData can be represented by a vtkActor and rendered with a vtkDataSetMapper. In the 3D, data can be considered a volume. Alternatively, it can be represented by a vtkVolume and rendered with a subclass of vtkVolumeMapper. Since some subclasses of vtkVolumeMapper use geometric techniques to render the volume data, the distinction between volumes and actors mostly arises from the different terminology and parameters used in volumetric rendering as it is opposed to the underlying rendering method.
Fig.3. VTK visualization pipeline for volume rendering
The vtkFixedPointVolumeRayCastMapper uses a ray casting technique for volume rendering. Algorithmically, it is quite similar to the vtkRayCastMapper. We chose to use ray casting due to the flexibility of this technique, which allows us to support all the features of the software ray cast mapper but with the acceleration of the GPU.
Fig.4. Code example for read DICOM images from directory and render the volume using VTK C# wrapper.
Ray casting is inherently an image-order rendering technique, with one or more rays cast through the volume per image pixel.
224
Fig.5. Reconstructed volume using vtkVolumeRayCastMapper
III. DESIGN AND IMPLIMENTATION
What follows is an outline of some of the important details concerning design and implementation of the software.
3.1 Overview
The software was designed for the development of interactive volume rendering and segmentation application in general, having a number of design goals in mind:
Software should be easy to use on different computers without any pre configuration.
Software should be useable for use with different kind of image formats.
Software should be able to do arbitrary directional volume cutting with segmentation capability.
Logic, model and graphical user interface should be separated where possible, so that the graphical user interface and controller is exchangeable, also easy to extend current application.
Fig.6. Functional representation of software
Besides these general goals, focused the following major tasks need to be accomplished by the implementation:
1. Read series of DICOM files into VTK: Read series of 2D medical images using DICOM image reader
2. Volume rendering and visualization: Reconstruct the 3D image by sequentially stacked images
3. Image interpolation: Linear interpolation algorithm used to generate 3D volume image from existing 2D series of images
4. Slice manipulation: Segmentation tool needs to have different directional (orthogonal and arbitrary) sliced images from 3D volume.
5. Segmentation tool: Tools receive user interaction and call relevant functions to perform segmentation.
6. Undo and Refresh: All slice segmentation operations should be undoable step by step or all at once.
3.2 Object Models
There are two distinct parts in our design. The first is the graphics model, which is abstract model for 3D graphics. The second is the visualization model, which is a data flow model of the visualization process.
3.2.1 The graphic model
The graphic model captures the important features of a 3D graphics system. Our software has eight basic graphic objects in the model.
1. Render Window- mange a window on the display device. One or more renderers draw into a single render window to generate scenes.
2. Renderer- coordinates the rendering of lights, camera, and actors.
3. Light- illuminates the actor and background in a scene.
4. Camera- defines the view position, focal point, and other camera characteristics.
5. Actor- an object drawn by a renderer in the scene. Actors are defined in terms of mapper, properties, and transform objects.
6. Property- represents the rendered attributes of an actor including object color, lighting, texture map, shading style.
7. Mapper- represents the geometric definition of an actor and maps object through a lookuptable. More than one actor may refer to the same mapper.
http://dx.doi.org/10.9717/JMIS.2015.2.2.221
225 3.2.2 The visualization model
The visualization model based on the data flow paradigm adopted in many software systems. In this paradigm, modules are connected together in a pipeline. The modules perform algorithmic operations n data as it flows through the pipeline [25]. The execution of this visualization pipeline is controlled in response to demands driven or event driven. The appeal of this model is that it is flexible, and can be quickly adapted to different data types or algorithms.
Our visualization model consists of two basic types of objects: process objects and data objects (see figure 7). Process objects are the modules of visualization pipeline. Data objects, also referred to as datasets, represent and enable operations on the data flow through visualization pipeline.
Fig.7.Visualization model to process objects A, B, C input and/or output one or more data objects.
3.3 Memory Management
A major concern when implementing visualization in data flow form is the amount of memory consumed. C# employs automatic memory management, which frees developers from manually allocating and freeing the memory occupied by objects. Automatic memory management policies are implemented by a garbage collector. The memory management life cycle of an object is as follows:
1. When the object is created, memory is allocated for it, the constructor is run, and the object is considered live.
2. If the object, or any part of it, cannot be accessed by any possible continuation of execution, other than the running of destructors, the object is considered no longer in use and it becomes eligible for destruction. The C# compiler and the garbage collector may choose to analyze code to determine which references to an object may be used in the future.
3. Once the object is eligible for destruction, at some unspecified later time the destructor for the object is run. Unless overridden by explicit calls, the destructor for the object is run once only.
4. Finally, at some time after the object becomes eligible for collection, the garbage collector frees the memory associated with that object.
The garbage collector maintains information about object usage, and uses this information to make memory management decisions, such as where in memory to locate a newly created object, when to relocate an object, and when an object is no longer in use or inaccessible.
IV. RESULTS AND EVALUATION
In this section, we demonstrate our medical images 3D rendering application software. Fig.8 shows the 3D rendering of series of DICOM images and demonstrate the 3D volume cutting function how to works.
Fig.8. Three axis aligned volume cutting
In order to compare and evaluate, the segmente results of proposed software with existing medical imaging software. Here, we compared our software with FreeSurfer and MRICro software.
Following as the Fig.9 shows hippocampus segmentation and 3D rendering results of segmented hippocampus.
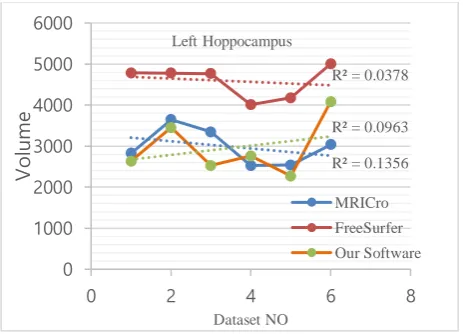
226 We used image datasets from six different patients of the
age group (25-40 years) for comparison of segmented image data using different software. Among them, three patients are male and three patients are female. Following table shows segmented hippocampus volumetric data.
Table 1. The segmentation results of hippocampus
Following figures give graphical representation of segmented hippocampus volumetric measurements of MRICro, FreeSurfer and Our software.
Fig.10. Left hippocampus volumetric data comparison
Fig.11. Right hippocampus volumetric data comparison
V. CONCLUSION
Medical image analysis is more than just the algorithms. Visualization of the original image data and processed results, interaction with the data, and the data itself are also important. VTK is a powerful library of medical imaging algorithms, especially for 3D visualization. However, medical image segmentation is not well-supported by VTK. Furthermore, more complex interaction methods, including undo/redo of interactions and run-time data management, both of which are required for convenient-to-use interactive applications, are beyond the scope of VTK.
In this research, we have implemented 3D rendering software for MR images using VTK and Microsoft .NET framework. Our software provides arbitrary directional volume cutting and segmentation functions which is not provided by many existing medical imaging software. This application software is on-going project and we expect to improve the functionality, user-friendliness, flexibility and robustness though the feedback of the researches. Further work concerns add semi automatic segmentation algorithm to the application software.
Acknowledgement
This research is supported by Basic Science Research Program through the National Research Foundation of Korea (NRF) funded by the Ministry of Education, Science and Technology (2011-0008627).
REFERENCES
[1] E. Heiberg, J. Sjogren, M. Ugander, M. Carlsson, H. Engblom, and H. Arheden, “Design and validation of Segment - freely available software for cardiovascular image analysis,” Journal of BMC Medical Imaging, vol. 10, no. 1, Jan. 2010.
[2] A. Buja, D. Cook, and D.F. Swayne, “Interactive high-dimensional data visualization,” Journal of Computational and Graphic Statistics, vol. 5, no. 1, pp. 78-99, Mar. 1996.
[3] W. Schroeder, K. Martin, and B. Lorensen, The Visualization Toolkit, an Object-Oriented Approach to 3D Graphics, 3rd Edition. Kitware, 2002.
[4] L.G. Nyul, A.X. Falcao, and J.K. Udupa, “Fuzzy-connected 3D image segmentation at interactive speeds,” Graphical Models, vol. 64, no. 5, pp. 259-281, Sep. 2002.
[5] D. Maleike, M. Nolden, H.P. Meinzer, and I.Wolf, “Interactive segmentation framework of the Medical
R² = 0.1356 R² = 0.0378
R² = 0.0963
0 1000 2000 3000 4000 5000 6000
0 2 4 6 8
V
ol
ume
Dataset NO Left Hoppocampus
MRICro
FreeSurfer Our Software
R² = 0.045 R² = 0.001
R² = 0.008
0 1000 2000 3000 4000 5000 6000
0 2 4 6 8
V
ol
ume
Dataset NO Right Hippocampus
http://dx.doi.org/10.9717/JMIS.2015.2.2.221
227 Imaging Interaction Toolkit,” Computer Methods and Programs in Biomedicine, vol. 96, no. 1, pp. 72-83, Oct. 2009.
[6] M. Viceconti, C. Zannoni , D. Testi, M. Petrone, S. Perticoni, P. Quadrani, at. al., “The multimode application framework: A rapid application development tool for computer aided medicine,” Computer methods and Programs in biomedicine, vol. 85, no. 2, pp. 138-151, Oct. 2007.
[7] R.A. Robb, D.P. Hanson, R.A. Karwoski, A.G. Larson, E.L.Workman, and M.C. Stacy, “Analyze: a comprehensive operator-interactive software package for multidimensional medical image display and analysis,” Computerized Medical Imaging and Graphics, vol. 13, no. 6, pp. 433–454, Dec. 1989. [8] K. Cleary, L.Ibanez, S.Ranjan, and B. Blake, “IGSTK:
A Software Toolkit for Image-guided Surgery Applications,” Computer aided radiology and surgery, vol. 39, no. 4, pp. 46-53, 2006.
[9] A. Rosset, L. Spadola, and O. Ratib, “OsiriX:An Open-Source Software for Navigating in Multidimensional DICOM Images,” Journal of Digital Imaging, vol. 17, no. 3, pp. 205-216, Sep. 2004.
[10]K. Martin, L. Ibanez, L. Avila, S. Barre, and J.H. Kaspersen, “Integrating segmentation methods from the Insight Toolkit into a visualization application”, Journal of Medical Image Analysis, vol. 9, no. 6 , pp. 579-593, Dec. 2005.
[11]J.J.Caban, A.Joshi, and P. Nagy, “Rapid Development of Medical Imaging Tools with Open-Source Libraries,” Journal of Digital Imaging, vol. 20, no. 1, pp. 83-93, Nov. 2007.
[12]L.S. Avila, U. Ayachit, S. Barre, J. Baumes, and F. Bertel, The VTK User’s Guide, Install Use and Extend The Visualization Toolkit,11th Edition. Kitware, 2010. [13]F. Rousseau, E. Oubel, J. Pontabry, M. Schweitzer,C.
Studholme, M. Koob, et. al., “BTK: An open-source toolkit for fetal brain MR image processing”, Computer methods and programs in biomedicine, vol. 109, no. 1 ,pp. 65-73, Jan. 2013.
[14]R. Spence, Information Visualization: Design for Interaction, 2nd Edition, Pearson, 2006.
[15]A. Kumar, Y.Y. Wang, C.J. Wu, K.C. Liu, and H.S. Wu, “Stereoscopic visualization of laparoscope image using depth information from 3D model,” Computer Methods and Programs in Biomedicine, vol. 113, no. 3, pp. 862-868, Mar. 2014.
[16]J.P. Helferty, and W.E. Higgins, “Combined endoscopic video tracking and virtual 3D CT registration for surgical guidance in Image
Processing,” in Proceedings International Conference, vol. 2, no. 2, pp. 959–961, 2002.
[17]D. Burschka, M. Li, M. Ishii, R.H. Taylor and G.D. Hager, “Scale-invariant registration of monocular endoscopic images to CT-scans for sinus surgery,” Medical Image Analysis, vol. 9, no. 5, pp. 413–426, Oct. 2005.
[18]T. Zinßer, J. Schmidt, and H. Niemann, “Point set registration with integrated scale estimation,” in proceeding of 8th International Conference on Pattern
Recognition and Image Processing, pp. 116–119, 2005.
[19]W. Qiu, J.R. Tong, T.Marchant, P.Spencer, C.J. Moore, and M. Soleimani, “New iterative cone beam CT reconstruction software: Parameter optimization and convergence study,” Computer methods and programs in biomedicine, vol. 100, no. 2 , pp. 166-174, Nov. 2010.
[20]H.M. Ladak, F. Mao, Y. Wang, D.B. Downey, D.A. Steinman, and A. Fenster, “Prostate boundary segmentation from 2D ultrasound images,” International Journal of Medical Physics Research and Practice, vol. 27, no. 8 , May. 2000.
[21]A.C. Hodge, A. Fenster, D.B. Downey, and H.M. Ladak, “Prostate boundary segmentation from ultrasound images using 2D active shape models: Optimization and extension to 3D,” Computer Methods and Programs in Biomedicine, vol. 84, no. 2, pp. 99-113, Dec. 2006.
[22]H.M. Ladak, J.S. Milner, and D.A. Steinman, “Rapid 3D segmentation of the carotid bifurcation from serial MR images,” Journal of Biomechanical Engineering, vol. 122, no. 1, pp. 96-99, Aug. 1999.
[23]S. Dammert, T. Krings, W. Moller-Hartmann, E. Ueffing, F.J. Hans, K. Willmes, et. al., “Detection of intracranial aneurysms with multi slice CT:comparison with conventional angiography,” Journal of Neuroradiology, vol. 46 , no. 6, pp. 427– 434, Apr. 2004.
[24]A. Lauric, E. Miller, S. Frisken, and A.M. Malek, “Automated detection of intracranial aneurysms based on parent vessel 3D analysis,” Medical Image Analalysis, vol. 14, pp. 149–159, Apr. 2010. [25]Y. Jin, and H.M. Ladak, “Software for interactive
228
A
UTHORSNuwan Madusanka has received the
BSc degree in Computer Science from Uva Wellassa University, Sri Lanka, in 2011, and MSc degree in Computer Engineering from Inje University, Republic of Korea in 2015. His research interests are image visualization and image analysis.
Naim Al Zabenhas received the BSc degree in Software Engineering from Al-Hussein Bin Talal University, Jordan, in 2011, and MSc degree in Medical Imaging Science from Inje University, Republic of Korea in 2015. His research interests are Image processing, analysis and visualization.
Alaaddin Al Shidaifat has received the BSc degree in Software Engineering from Al-Hussein Bin Talal University, Jordan, in 2011, and MSc degree in Computer Engineering from Inje University, Republic of Korea in 2015. His research interests are image enhancement, image segmentation, and image visualization.
Heung-Kook Choi has gone the