A
"H
URST COEFFICIENT
"
ESTIMATION WITH
WAVELETS
:
A
PPLICATION TO THE ENERGY
SECTOR
J
ULIEN
F
OUQUAU
NEOMA Business School, France
P
HILIPPE
S
PIESER
ESCP Europe, France
ABSTRACT
The energy financial products prices could be affected by herding behavior, speculation and also by supply and demand of the physical assets. This situation is likely to generate economic cycles and a rejection of the efficiency market hypothesis. Then, the aim of this paper is to check the presence of memory in the energy Futures prices. We calculate a useful parameter the "Hurst coefficient", by using a specific tool coming from the signal theory, the wavelet decomposition. Our findings with rolling regressions are that most markets, since the beginning of 90ties, are in a process of maturity and show less and less memory of any type (short or long). Electricity displays long memory, whereas the crude oil markets present some short memory.
Keywords:
Energy Futures, Hurst exponent, Wavelet models, Efficient market theory.
JEL Classification: C22, C58, G14, G17.
Corresponding Author:
Julien Fouquau, NEOMA Business School, 1 rue du Maréchal Juin – BP 215 76825 Mont-Saint-Aignan Cedex France.
1. INTRODUCTION
Commodity financial markets are regarded as a class of financial assets but displaying some specificity. Their idiosyncratic behaviors are explained by the importance of the physical market with the pro-cyclical inventory process and the production storage. These elements associated with the portfolio diversification have led to their huge development. Consequently, the question of the efficiency market hypothesis becomes a topical subject of investigation.
This efficient market hypothesis (EMH), defined in seminal papers by Fama (1965, 1970, 1991) is at the core of the functioning of the financial markets. One of the main assumptions is that future value of assets cannot be predicted through identifying possible trends or patterns of price changes: as news are unpredictable, price changes are unexpected and the returns are realizations of a random process. This issue has been largely debated in finance since the early seventies and remains nonetheless the topic of active research, today enlarged to commodity markets. Statistically, the EMH implies that return series are characterized by a lack of memory (Lardic & Mignon, 1996).
From an economic point of view, long-memory in financial market could be justified by the failure of a rational expectation hypothesis which could be represented, for instance, by herding behavior of market participants or the outcome of ``bubbles" (Kirman, 2007). This situation could create recurring cycles and hysteresis phenomena (De Peretti, 2007). For commodities, it is necessary to consider the supply and demand law applied to the physical underlying asset and the seasonality effects.
Seasonality is known to be one of the empirical characteristics that make commodities strikingly different from other conventional financial assets. Let us consider for instance the importance of temperature for the demand of heating oil, which drives up prices in winter months whilst lowering them in the summer where there is little need for it. These consequences could be amplified by global warming. It is also well known that the prices of electricity can be even far more seasonal: since the wave of deregulation, the market is highly volatile. The prices depend not only on the season, but also on working day or holiday effects. The seasonality can induce the existence of memory. However, it is not obvious that such dependence structure of time series contradicts the efficient market hypothesis if we consider that rational expectations and price discovery process are not challenged1.
To test the EMH, it can be useful to apply methods designed to identify the different cyclical components of a time series or seasonality. For that purpose, there are a lot of techniques. One of the most promising is the wavelets analysis, derived from the Fourier approach. This methodology has the advantage of providing a multi-resolution (Meyer, 1992), which is well adapted to studying variations in low frequency as well as high frequency signals.
We decide to use it in the estimation of the ``Range Statistics'' (R/S) given by Hurst (1951) commonly called Hurst coefficient or exponent H. To obtain these coefficients, we choose Daubechies wavelets (``Daublet'', Ingrid Daubechies, 1992). Our choice is mainly justified from a practical point of view, because this
modelization allows for a more precise multi-resolution as well as a better fit with the data.
The main contribution of our approach related to existing literature is threefold. Firstly, we used asymmetrical wavelet function which allows a more realistic representation of the financial returns pattern. This function requests to input a regularity parameter before the estimation. We have chosen not to impose it but find the optimal one and check the results with other regularity parameter values. Secondly, we check the presence of cyclical component or time series dependence on the energy commodity market with very recent data. This choice is important in view of the recent and quick rise of this market and the increasingly part of Futures in financial portfolios. Thirdly, we use rolling regressions to check the evolution of the efficiency and more precisely, the predictability on the oil, gas, coal and electricity markets.
Our paper is organized as follows: in Section I, we present the literature, in Section II the methodology, in Section III the data and in Section IV the findings and conclusions.
2. LITERATURE ON EFFICIENCY
The literature concerning long-term memory in financial markets is extremely vast (e.g. Kirman and Teyssière, 2007; Sewell, 2011). The detection of possible long-term memory has been undertaken on a large class of investment assets: stock returns, exchange rates, and more recently in commodities prices. The new focus on different markets is due to the portfolio diversification in an international framework and also to methodological reasons (disparities in capitalizations, market micro-structures…).
This type of tests is now implemented in commodity markets, primary and also Futures and options, since those have become a new asset class recently. Three main ways of investigation have been followed: dynamics of a specific commodity time series with mainly the cycles and the seasonality effects, macroeconomic links of energy commodities and co-movements between commodities. The EMH is essentially based on this first research track and the objective is to reveal the dependence structure of time series. To do this, different methodologies have been used in the literature and applied in energy markets. The most common one is the Hurst (1951) or R/S statistics which is however subject to theoretical and practical limitations. Lo (1991) pointed out that it is unable to distinguish between long and short memory. To circumvent this issue, the ARFIMA models have been developed to provide a frame for short term as well as long-term dynamics. The estimation is based on the Fast Fourier Transform (FFT). An alternative recently used is the wavelet methodology; the studied variable is transformed not into a frequency domain as Fourier transform but into a time-scale domain. Then, this class of model has the advantage of studying the pattern of the series in relation with business and growth cycles and being particular adapted to study the variations of the signal as the returns. For these reasons, we focus only on the wavelet approach in the context of energy literature.
improved Hurst coefficient “H” estimated with wavelets. The results show evidence of long-range dependence for all 14 commodities and of a non-stationary “H” for 9 of 14 commodities.
Using different approaches of detecting fractional integration (particularly a symmetrical wavelet based estimator, "symlets") applied on a large field of commodities, Fernandez (2010) analyzed a sample of 20 DJ-AIG commodity Futures indices over the period January 1991-June 2008. She concludes that returns series either over-react or under-react to new market information; the violation of the market efficiency would make possible for market participants to devise non-linear statistical models for improved index forecasting and derivatives valuation. Ghoshray and Johnson (2010) analyzed crude oil, natural gas and coal prices. They investigated whether trends changes signs in the regimes which are bounded by the structural breaks. Their results show that the trends for the different materials are not well represented by a single positive or negative figure: energy prices are hard to predict since that there is a permanent change in the trend.
We focus now to the recent references and results obtained in commodity markets by using this technique of wavelets to obtain price forecast. We can mention Yousefi et al. (2005) who used wavelets for prediction of oil prices, whereas Connor and Rossiter (2005) were the first to estimate price correlations between commodity markets by using wavelets (Haar discrete type). De Souza e Silva, Legey and De Souza e Silva (2010) built a Hidden Markov model (HMM), to predict Futures crude oil price movements. The forecasting methodology consists of employing a wavelet analysis to remove high frequency price movements, using then the HMM to forecast the probability distribution of the price return accumulated over the next days in order to infer Futures price trends.
Tonn, Li and Mc Carthy (2010) studied the relationship between Futures prices of natural gas and oil with a wavelet analysis. They found that the prices of natural gas Futures and oil Futures have high covariance at high frequencies but not so much at low frequencies. They also proved that an increase in financialization of commodities commensurate with investors search for yield results in higher covariance between the Futures prices of natural gas and oil and that the volatility of neither time series consistently leads the other even at high frequencies. Naccache (2011) addresses the question of the relations between the MSCI and the oil price, this latter being based upon a wavelet decomposition model. He founds that the cycles which contribute the most to oil price variations are 20 to 40 years cycles which are close to the size of Kuznets infrastructure cycles and, according to the author, represent energy investment cycles. Jammazi (2012) explores how the interactions between crude oil price changes and stock returns in five of the main developed countries. She applies a wavelet tool, namely (Haar) and builds the wavelet variance, correlation and cross-correlation. She finds evidence that the wavelet variances of all the variables decrease with increasing scales. From the analysis of the wavelet correlation, changes in oil and almost all the stock prices do not move together up to the intermediate scale.
heating oil, and natural gas. They uncover dynamics of correlations between energy commodities. With a similar objective, Tiwari, Mutascu and Albulescu (2013) assess the empirical influence of oil prices on the real effective exchange rate in Romania with a discrete wavelet transform and Granger causality tests. They find that oil prices have a strong influence on the real effective exchange rate in the short run, but also for large time horizons. If all previous papers rely on uni - and bivariate wavelet analysis, Sousa, Aguiar-Conraria, Soares (2010) used a multivariate wavelet analysis to investigate the drivers of the carbon market- CO2 versus gas, electricity, coal. They could so identify relations getting stronger or, on the contrary, disappearing over specific time intervals and frequencies.
To conclude, a majority of these studies led to reject the efficient market hypothesis. In the following section, we want to check this result using recent Futures data and asymmetrical wavelets which are more adapted to financial markets. We adopt equally rolling regressions with the objective to allow for a possible changing of the memory across the time.
3. MEASURE OF LONG-MEMORY
The interest to study the dependence structure of time series has not diminished in the article during the last ten years. There is essentially two methodologies that have been using in the literature: the Hurst exponent and ARFIMA models. We focus on more recent approach, the wavelet models. It has been developed by Meyer (1992) particularly in physics (signal theory, geophysics, computer science) but already tested in recent years in some economic papers (Crowley, 2003).
This class of models belongs to the signal theory and consequently it is particularly adapted to the detection of periodic cycles which could be due to seasonal or herding effect mentioned previously. We use this wavelet transform to decompose our time series into different components and then deduce the ``Hurst'' exponent. This approach has been replicated with rolling regression in the objective to evaluate the evolution of the efficiency in the commodity markets in the recent years. Now, we describe the estimation procedure which happens in a loop.
For a discrete signal or function, Abry and Veitch (1998) proposed the following presentation for the multi-resolution analysis (MRA) used in wavelet transforms:
It consists in rewriting the information included in series x(t) as a low-resolution approximation with minimal loss of information, referred to as approxJ, and a
collection of details (detailsj= approxj - approxj-1) at different resolutions (i.e. for a
range of octaves j=1,…,J). The approximation at octave j is obtained from a scaling function2 :
2 The scaling function must satisfy ∫ ( )
J
j
j
j t ails t
approx t
x
1
) ( det )
( )
(
k
k j k j
j t s t
where the functions ( ) with and in the MRA
procedure, the jth details are obtained from a mother wavelet3ψ
0:
where the functions ( ) with . Given a scaling
function and mother wavelet, coefficients dj,k and sj,k are the inner products of two
sets of functions (see Abry and Veitch, 1998):
where j,k (respectively, j,k) are shifted and dilated templates of 0
(respectively, 0the chosen mother wavelet (the scaling function).
Non-zero wavelet coefficients at high scales (low value of octaves) characterize noise inherent in the data. In the opposite way, the coefficients associated with octaves' high value represent the trend of the series i.e the long run dynamic. We use the Daubechies wavelets to obtain these coefficients. The wavelets have the interesting properties of being asymmetrical and smooth.
The Hurst exponent is obtained from a scalogram which is generated from the wavelet power spectrum. For octave j, the spectral estimator ̂ is obtained here from the average of the squares of the wavelet coefficients:
̂( ) ∑
where is an arbitrary reference frequency selected by the choice of 0 and nj is
the number of wavelet coefficients available at octave “j”. It halves with each increase of “j”. Thus, the Hurst exponent4} is deduced by the slope coefficient α of
the linear regression on the wavelet power spectrum minus the bias correction proposed by Abry and Veitch (1998) for all octaves. It is suggested that a regression on a subsample of octaves [j1, j2] should be built, in order to eliminate the smallest
high frequency (noises). We select upper bound j2 in function of log(N)/log(2) and
the vanishing moment of the Daublets, while lower bound j1 depends on a
goodness-of-fit test (see Teyssière and Abry, 2005).
The value of exponent H helps to range times series according to their dependence structure. When H=0.5, there is no long-term dependence and
3 The mother wavelet must satisfy ∫ ( )
4 The Hurst exponent is: H=(α+1)/2.
k
k j k j
j t d t
ails () ( )
det , ,
) ( ,
) ( ,
, ,
, ,
t x d
t x s
k j k
j
k j k j
economically the financial market might be efficient. When 0.5<H<1, the market displays long-term memory –“a persistence effect” –and the time series will show clusters of comparable values. On the other hand, when 0<H<0.5, there is short-term memory and one may speak of an “anti-persistence effect”. We now present the energy data.
4. DATA
The aim of this section is to test the efficiency of the financial markets of energy products and more precisely to check the existence of a possible long-memory, short memory or no memory. We focus our empirical investigation on the Futures contracts for the worldwide energy prices. This choice has been motivated by two reasons: firstly, Futures contracts have completely changed the quotation of crude oil and the valuation by the market way since this commodity is now largely priced at a differential to Futures prices. Real economic conditions are not the main driver for prices. Secondly, financial actors, in their investment or arbitrage strategies, use Futures markets and not spot market, due to obvious reasons of liquidity and physical storage. So we retained the following series, issued by Bloomberg.
First, we have selected two contracts in the view of representing the biggest commodity market in the world, namely the crude oil market. Indeed, it is a strategic natural resource which serves as the underlying asset for many financial instruments such as Futures, options on Futures, as well as oil-linked bonds. It has evolved from a primarily physical activity into a very active and elaborated market with large trading horizons. In parallel, the volatility of oil prices and the will to hedge encouraged the development of a financial sphere of “derivative contracts which dominate the process of price formation” (Geman, 2005). The two Futures contracts retained are:
The light Sweet Crude Oil (WTI) Futures is the world's most actively traded energy product. Key figures about this NYMEX Light Sweet Crude Oil prove that those contracts are the most liquid (trading nearly 850,000 Futures and options contracts daily) and open interest (3 million lots, equivalent to more than 3 billion barrels- source CME Group).
Another active contract is the brent. The last years, brent contracts have registered records in daily trading volume jumping to more than 30,000 contracts at the beginning of 2013. Although less active than the WTI NYMEX Futures contracts market, the IPE brent (London) is also a leading reference. It brings another information concerning short term fluctuations on the spot market featured by a high volatility and a high sensitivity to seasonal effects. It remains nevertheless closely linked to WTI market. To sum up, since trading of crude oil has become a primarily financial activity, most of outright price trading is concentrated in the derivative markets for brent and WTI.
Second, we retained another energy financial product: the heating oil. It is a transformed product and more precisely a liquid petroleum product used as a fuel for furnaces or boilers in buildings. These chemical properties make it very influenced by seasonal and climatic effects.
of coal in the USA. We have retained the Coal Futures contracts because they provide the electricity power industry as well as the coal industry with new risk management tools since electricity utilities can buy coal Futures to hedge against rising prices for their baseload fuels.
Fourth, we retained the series of the Henry Hub Natural Gas Futures contract (NYMEX). This gas market is the most traded and liquid instrument, with the largest maturities, up to 72 months. The Henry Hub in the Gulf of Mexico is by far the most significant point of gas trading in USA because of the network of pipelines intersecting at that point. It is seen also as one of the most important in the world.
Fifth, we kept an electricity contract because it acts as a substitute for oil and gas. Of course, contrarily to those commodities, it is mostly non storable. Matching the supply and demand of electricity on the exchange leads to a public market-clearing price. The prices observed on that competitive wholesale trading facility lead to an exchange index on which Futures are written once liquidity has reached a satisfactory volume. On the NYMEX, different electricity indexes are quoted and we selected one of the most representative ones, the PJM.
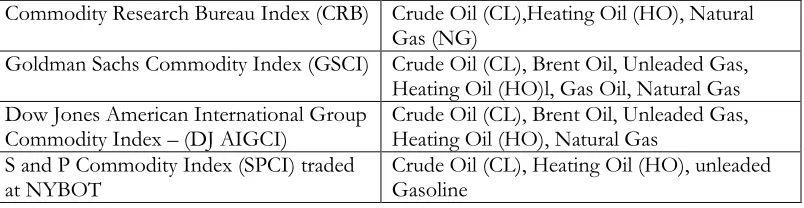
Through all those commodities, we selected the assets that all are concerned by energy fluctuations and climate modification. In addition, we choose the specific instruments that enter in the composition of useful commodity indexes. The indices that allow passive strategies and the corresponding contracts we take into account are reported in table 1.
Table 1: Passive strategies and the corresponding contracts
Commodity Research Bureau Index (CRB) Crude Oil (CL),Heating Oil (HO), Natural Gas (NG)
Goldman Sachs Commodity Index (GSCI) Crude Oil (CL), Brent Oil, Unleaded Gas, Heating Oil (HO)l, Gas Oil, Natural Gas Dow Jones American International Group
Commodity Index – (DJ AIGCI) Crude Oil (CL), Brent Oil, Unleaded Gas, Heating Oil (HO), Natural Gas S and P Commodity Index (SPCI) traded
at NYBOT Crude Oil (CL), Heating Oil (HO), unleaded Gasoline
5. RESULTS
We begin our analysis by focusing on the return of our energy5 series on the
entire sample (maximum length available on Bloomberg). To obtain the Hurst exponent with the wavelet model estimation, two preliminary choices are required. The first one is to select the regularity parameter of the Daubechies mother function. A high regularity parameter indeed implies a clearer signal but the very high frequency dynamics are eliminated, leading to a lower precision.
We propose to select the regularity parameter according to the goodness-of-fit test designed by Abry and Veitch (1998). As in Fouquau and Spieser (2014), we have chosen the regularity parameter which gives the highest p-value, in other words, which gives the best log linear regression quality between octaves and average square wavelet coefficients. We keep this best regularity parameter for the rolling regressions in order that the possible evolution of the estimated Hurst coefficient is not due to a modification of the regularity parameter value6.
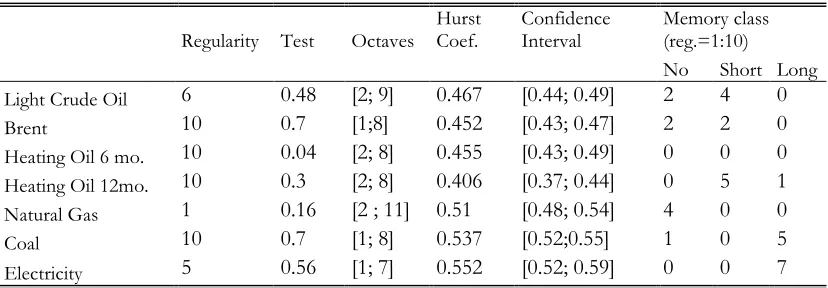
Still according to the goodness-of-fit procedure, the second step is to select the subsample of the octaves [j1, j2] on which the Hurst exponent will be estimated (Teyssière and Abry, 2005). The results are reported in the Table 2. We have summed up the information herein: the Daubechies regularity parameter, the p-value
of the goodness-of-fit test and the Hurst coefficient with its confidence interval (at 95%). To comfort our conclusions, the three last columns report for other regularity parameter values, the number of cases which found short-memory process, the absence of memory process and long-memory process. The regularity parameter which rejects7 the null hypothesis of linearity in the goodness-of-fit test is dropped.
Table 2: Wavelet results
Regularity Test Octaves Hurst Coef. Confidence Interval Memory class (reg.=1:10)
No Short Long
Light Crude Oil 6 0.48 [2; 9] 0.467 [0.44; 0.49] 2 4 0 Brent 10 0.7 [1;8] 0.452 [0.43; 0.47] 2 2 0 Heating Oil 6 mo. 10 0.04 [2; 8] 0.455 [0.43; 0.49] 0 0 0 Heating Oil 12mo. 10 0.3 [2; 8] 0.406 [0.37; 0.44] 0 5 1 Natural Gas 1 0.16 [2 ; 11] 0.51 [0.48; 0.54] 4 0 0 Coal 10 0.7 [1; 8] 0.537 [0.52;0.55] 1 0 5 Electricity 5 0.56 [1; 7] 0.552 [0.52; 0.59] 0 0 7
Notes: Regularity (reg.) parameter indicates the Daubechies used; Test report the p-value of the goodness of fit (this test have for null hypothesis the goodness of linear fit). Octave is the range of the octaves [j1, j2] on which the Hurst exponent will be estimated. The confidence interval is done at 95%. Class memory represents the number of processes where no memory or short-memory or long-memory is found for all other regularity values. We do not consider the Hurst exponent result when the p-value of the goodness of fit is inferior to 5%.
5 Classical unit root tests have been implemented (ADF, PP, KPSS), and all the series in return are
stationary. Results are available upon request.
6 However, the results of the rolling regressions with others regularity parameters are available upon request.
As previously mentioned, a high p-value is consistent with a good linear fit and an accurate Hurst exponent. The estimated values are largely superior to 10% for all our series except for heating oil Futures. For this series, the average of the squares of the wavelet coefficients of the octaves (1,2,3,7 and 8) are largely superior to the 4th,5th and 6th octave. So the linear regression cannot be regarded as significant; in other words, it does not allow to have a significant linear regression. Then, the obtained Hurst exponent cannot be interpreted. For this reason, we replace thereafter the heating oil contract by a longer maturity of the 12 months in the rolling regression and add the Hurst exponent result for the entire sample in the Table 2. In all other series, the p-values range from 15.8% (natural gas 6 months) to 70.5% (brent ICE Futures contracts).
In the estimation process, we have allowed a range value between 1 to 10 for the regularity parameter. The optimal value is relatively large except for Henry Hub Natural Gas Futures contract. For instance, the value is 10 for the coal, the Brent Futures contracts and 6 for the light sweet crude oil contract. A justification of these results is that energy price series contained many spikes due to the adjustment of supply to demand. Then, very high frequencies must be dropped to obtain a clearer signal and a more reliable Hurst exponent with lower variance.
Now, if we focus directly on the Hurst exponent, three cases appear depending on the confidence interval: for those which include 0.5, the efficiency market hypothesis can not be rejected in view of the dependence structure of the time series, those which are inferior to 0.5 which exhibit short-memory processes and those which are superior to 0.5 which exhibit long-memory processes. The Henry Hub Natural Gas displays no memory. In a more surprising way, the biggest commodity markets of crude oil (Brent, light sweet crude oil and heating oil) show short memory. The coal and electricity market display long memory, this result being coherent with the strong seasonality included in these variables (Taylor 2004, Bessec Fouquau & Meritet 2014). All these conclusions are strengthened in view of the results of the other regularity parameter values reported in the three last columns of the Table 2. The presence of memory implies that a prediction of Futures returns based on the past might be then possible and consequently, predictability of the returns, adequately measured and utilized, should historically enable profitable trading strategies to be implemented.
The rolling regressions methodology leads us to estimate the Hurst coefficient for moving observation windows. The width of the window, 1000 days, is a good compromise between two constraints: to be large enough to allow for an accurate H coefficient and simultaneously, to be short enough as to display a significant pattern of the coefficient. Since the estimation method by wavelets is time consuming, we selected a loop of 250 days8 (approximately one year of return quotation). For
instance, in the case of the light crude oil, the range of the first sample is between the 2 November 1983 to the 31 October 1987, for the second sample between the 30 October 1984 to the 27 October 1988... Till for the last sample, the observation period is between the 29 September 2010 to the recent deadline of 14 September 2014.
8 if we select a loop of 125 observations, the conclusion remains the same. The results are available
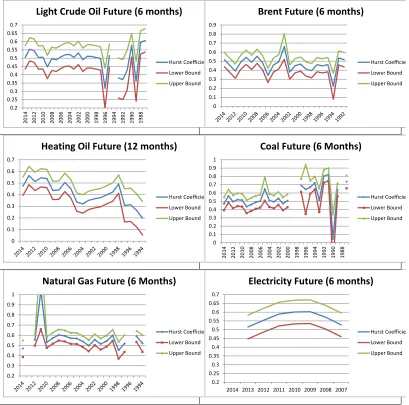
Results of the rolling regression are represented in Figure 1.
Notes: Each point is the estimation of the H coefficient for the 1000 previous observations. The three curves represent the H coefficient and its confidence interval at 95%. We have chosen to remove Hurst coefficients when the linearity hypothesis checked by the goodness-of- fit test is rejected at 5% level.
Figure 1: Rolling regression on Hurst exponent
Each graph plots three curves: the H coefficient and its confidence interval at 95%. The horizontal axis is in inverted scale: the observation at the left is for the date of 17/09/2014, then the others are for the 250, 500, 750 .... days before. In our figures, we have chosen to remove Hurst coefficients when the linearity hypothesis checked by the goodness-of- fit test is rejected at 5% level. In these cases, the
0.2 0.25 0.3 0.35 0.4 0.45 0.5 0.55 0.6 0.65 0.7 20 14 20 12 20 10 20 08 20 06 20 04 20 02 20 00 19 98 19 96 19 94 19 92 19 90 19 88
Light Crude Oil Future (6 months)
Hurst Coefficient Lower Bound Upper Bound 0 0.1 0.2 0.3 0.4 0.5 0.6 0.7 0.8 0.9
Brent Future (6 months)
Hurst Coefficient Lower Bound Upper Bound 0 0.1 0.2 0.3 0.4 0.5 0.6 0.7
Heating Oil Future (12 months)
Hurst Coefficient Lower Bound Upper Bound 0 0.1 0.2 0.3 0.4 0.5 0.6 0.7 0.8 0.9 1 20 14 20 12 20 10 20 08 20 06 20 04 20 02 20 00 19 98 19 96 19 94 19 92 19 90 19 88
Coal Future (6 Months)
Hurst Coefficient Lower Bound Upper Bound 0.2 0.3 0.4 0.5 0.6 0.7 0.8 0.9 1
Natural Gas Future (6 Months)
Hurst Coefficient Lower Bound Upper Bound 0.2 0.25 0.3 0.35 0.4 0.45 0.5 0.55 0.6 0.65 0.7
2014 2013 2012 2011 2010 2009 2008 2007
Electricity Future (6 months)
Hurst Coefficient
Lower Bound
regularity parameter is not optimal for the estimation window9. As for the crude oil
market for 6 months maturity, we can draw the following conclusions.
From 1995 to nowadays, the market displays an absence of memory. Indeed, the confidence interval at 95% includes always, for the Hurst coefficient, the expected value of 0.5. During its early period of birth and maturation, the market would alternate long and short memory. The first two observation windows display a long memory, then follows a short memory for one window, then comes one long memory period and, at last, we see short memory till 1995 for about five periods.
A concluding remark must be made at this step. The market was far from efficient in the nineties. At its very beginning, the prices incorporate all the available information because precisely it has no long reference or benchmark. This type of market rational expectations, based on extrapolation, is similar to emerging stock markets (see Sewell 2011). As for the Brent, the conclusion is alike that for the crude oil. We see in majority no memory after the period 1992. Then we have efficient market and relatively few periods of short or even very short memory, for example 1994, 2001 and 2005. As for the heating oil, we can conclude that a short memory process dominates the market, with exception of the last nine years (no memory). This result is coherent with the conclusion of related to that obtained with the global sample and with other crude oil series above.
The Natural Gas was efficient for the broad sample but with a weak p-value of the goodness-of-fit test (15.8%) and for one regularity parameter. For the subsamples, the time structure dependence, on the contrary, shows few absence or often long memory. The p-values10display a better significance, going up to 0.93.
Concerning the coal market, for the recent period of time (after 1999 until nowadays) we are in presence of an efficient market whereas for the previous one (before 1999), we alternate between short and long memory markets periods. This global pattern of the market might be explained by the magnitude of the trading of coal since the beginning of this century (Höök, Zittel, Schindler, Aleklett, 2010).
The global sample for electricity displayed long memory. This result is mainly confirmed by rolling regressions. We can therefore conclude that strong seasonality observed in this market generates a cyclical pattern detected by our Hurst coefficient.
In a political point of view, it would be important to make commodity financial markets more efficient and so a better resources allocation, it is necessary if not sufficient to lower their costs of information research (Grossman & Stiglitz 1980). One useful measure would be to increase the number of professionals as markets participants by allowing specialized commodity companies and brokers to enter them. This helps to enlarge the information flow and to make any market manipulation unlikely. However, this deregulation could be accompanied by a monitoring of financial Authorities to avoid a loss of efficiency, these resources being fundamental for economic development.
9 We decided to remove the Hurst exponent result and to not replace it by the result obtained with
other regularity parameter because we do not know exactly if the change was due to a gain in market efficiency or to an actual parameter change.
6. CONCLUSION
The aim of this paper was to investigate if the energy commodity markets display the presence of any type of memory. We have found a common result in the literature on stock markets in the emerging countries.
These oil or the coal Futures markets seem to be not efficient, under this respect of memory, in the beginning of their quotation. However, with the rise and the gain in maturity of those financial products, memory vanishes. Those findings are in accordance of the weak efficiency financial theory, preventing successful forecasts and arbitrage opportunities.
The only market where structure dependence could exist is the electricity market. Several reasons would justify this result: it is more recent market, this energy production is not storable and the consumption is influenced by the temperature. Then, the presence of memory could be due to the presence of seasonality which could exacerbate with the global warning.
There are a number of potential extensions to this paper. In particular, it could be interesting to explore the volatility of the return as Fernandez (2010) and wonder about persistence effect and speculation. Concerning specifically this point and considering our conclusions, one has to stress that any attempt to limit speculation, which could be justified according to regulation objectives based on political reasons on one hand, could lead to a possible reduction in market efficiency, on the other hand. To this purpose, we could use the same methodologies applied to absolute values of return or also to square returns.
REFERENCES
Abry, P. and Veitch, D. (1998), "Wavelet analysis of long-range-dependent traffic",
IEEE Trans. Inform. Theory, 44, 2-15.
Aguiar-Conraria, L. and Soares, M.J. (2011), "Oil and the macroeconomy: using wavelets to analyze old issues", Empirical Economics, 40, 645—655.
Bessec, M., Fouquau, J. and Méritet, S. (2014), "Forecasting electricity spot prices using time-series models with a double temporal segmentation", Economics Papers from University Paris Dauphine 123456789/13532.
Connor, J. and Rossiter, R. (2005), "Wavelet transforms and commodity prices."
Studies in Nonlinear Dynamics & Econometrics, 9(1).
Crowley, P. (2005), "An intuitive guide to wavelets for economists", Research Discussion Papers, Bank of Finland.
Davidson, R., Labys, W. C. and Lesourd, J. (1997), “Wavelet analysis of commodity price behaviour", Computational Economics, 11(1), 103–128.
De Peretti, C. (2007), "Long memory and Hysterisis", in Long memory in economics, Kirman, A.P. and Teyssière (eds), Springer Verlag, 363-388.
De Souza e Silva E.G, Legey, L.F.L. and De Souza e Silva, E.A. (2010), "Forecasting oil price trends using wavelets and hidden Markov models", Energy Economics, 32(6), 1507–1519.
Fama, E.F. (1965), "The Behavior of stock market prices", Journal of Business, 38(1), 34-105.
Fama, E.F. (1965), "Random Walk in Stock Market prices", Financial Analysts Journal, 21(5), 55–59.
Fama, E.F. (1970), "Efficient Capital Markets: a review of theory and empirical work", Journal of Finance, 25, 383-417.
Fama, E.F. (1991),"Efficient capital markets", Journal of Finance, 46(5), 1575-1617.
Fernandez, V., (2010), "Commodity Futures and market efficiency: A fractional integrated approach", Resources Policy, 35(4), 276-282.
Fouquau, J. and Spieser P. (2014), "Stock Returns Memories: a "Stardust" Memory?", Finance, 35(2), 57-85.
Geman, H. (2005), Commodity and commodity derivatives, Wiley.
Ghoshray, A. and Johnson, B. (2010), "Trends in world energy prices", Energy Economics 32(5), 1147–1156.
Grine, S. and Diko, P., (2010), "Multi-layer model of correlated energy prices",
Journal of Computational and Applied Mathematics, 233, 2590–2610.
Grossman, S. J. and Stiglitz, J., (1980), "On the Impossibility of Informationally Efficient Markets" American Economic Review 70(3), 393–408.
Höök, M., Zittel, W., Schindler, J., and Aleklett, K. (2010),"Global coal production outlooks based on a logistic model", Fuel, 89(11), 3546-3558.
Jammazi, R. (2012), "Cross dynamics of oil-stock interactions: a redundant wavelet analysis" Energy, 44, 750-777.
Kirman, A.P. and Teyssière, G. (2007), Long memory in economics, Springer Verlag.
Lanza, A., Manera, M. and McAleer M. (2006), "Modeling dynamic conditional correlations in WTI oil forward and Futures returns", Finance Research Letters, 3, 114–132.
Lardic, S. and Mignon, V. (2002), "Econométrie des séries temporelles macroéconomiques et financières", Economica.
Lo, A. W. (1991), "Long-term memory in stock market prices", Econometrica 59(5), 1279–1313.
Meyer, Y. (1992), Wavelets and Operators, Cambridge University Press.
Naccache, T. (2011), "Oil price cycles and wavelets", Energy Economics, 33(2), 338– 352.
Power G. and Turvey C. (2010), "Long-range dependence in the volatility of commodity Futures prices: Wavelet-based evidence", Physica A, 389(1), 79-90.
Sewell, T. (2011), "Characterization of Financial Time Series" Research Note RN/11/01.
Taylor, J.W. (2010), "Triple seasonal methods for short-term electricity demand forecasting", European Journal of Operational Research, 204, 139-152.
Teyssiere, G. and Abry, P. (2005), "Wavelet Analysis of Nonlinear Long-Range Dependent Processes. Applications to Financial Time Series", in Long-Memory in Economics, G. Teyssière and A. Kirman eds, 173-238, Springer Verlag.
Tonn V.L., Li, H.C. and Mc Carthy J. (2010), "Wavelet Domain Correlation Between Futures Prices of Oil and Natural Gas," Quarterly Review of Economics and Finance, 50(4).
Tiwari, A.K., Mutascu, M.I., and Albulescu C.T. (2013), "The influence of the international oil prices on the real effective exchange rate in Romania in a wavelet transform framework", Energy Economics 40, 714-733.
Vacha, L. and Barunick, J. (2012), "Co-movement of energy commodities revisited: Evi- dence from wavelet coherence analysis" Energy Economics 34, 241—247.