Cite as
Bronowicka-Szydełko A, Krzystek-Korpacka M, Kuzan A, et al. Non-standard AGE4 epitopes that predict polyneuropathy independently of obesity can be detected by slot dot-blot immunoassay. Adv Clin Exp Med. 2020;29(1):91–100. doi:10.17219/acem/112612
DOI
10.17219/acem/112612
Copyright
© 2020 by Wroclaw Medical University This is an article distributed under the terms of the Creative Commons Attribution 3.0 Unported (CC BY 3.0) (https://creativecommons.org/licenses/by/3.0/)
Address for correspondence
Agnieszka Bronowicka-Szydełko
E-mail: [email protected]
Funding sources
The study was supported by National Science Centre with a grant No. 2012/05/N/NZ5/00836.
Conflict of interest
None declared
Received on November 8, 2018 Reviewed on December 3, 2018 Accepted on September 25, 2019
Published online on February 4, 2020
Abstract
Background. Advanced glycation end-products (AGEs) are formed during cascade reactions between reducing sugars or reactive aldehydes and proteins, lipids or DNA molecules. They constitute a group of vari-ous stable compounds. Advanced glycation end-products are considered potential biomarkers of metabolic disorders. However, so far only a few methods to determine the level of individual AGEs have been developed. Objectives. The aim of the study was to compare the efficiency of the slot-dot blot method and direct enzyme-linked immunosorbent assay (ELISA) in detecting non-standard epitopes of methylglyoxal (MGO)-modified proteins (AGE4) found in diabetes serum in trace amounts, and to assess AGE4 in diabetes and associated metabolic abnormalities.
Material and methods. The presence of AGE4 was detected using 2 methods: direct ELISA and the slot-dot blot method – a newly developed immunoassay based on monoclonal, commercially available antibody detection of non-standard AGE epitopes. AGE4 quantification, expressed as median AGE4 in arbitrary units (AU) and AGE4 positivity (the percent of samples with detectable AGE4) was related to diabetes-associated metabolic abnormalities, complications and treatment.
Results. Slot-dot blot was significantly more efficient than ELISA in detecting non-standard AGE4 epitopes. AGE4 positivity was less frequent in patients with microangiopathy and in those with polyneuropathy. In patients with abnormal glucose metabolism, metformin treatment was associated with higher AGE4. AGE4 positivity was significantly lower in gliptin-treated patients. Multivariate analysis showed that poly-neuropathy and obesity were independently associated with AGE4 positivity, with odds ratios (ORs) of 0.21 and 3.02, respectively. Moreover, logistic regression showed that AGE4 positivity and HbA1c are independent predictors of polyneuropathy. Considering both indicators allows correct classification of 70.4% of cases with a general accuracy of 76%.
Conclusions. The slot dot-blot method detects compounds found in serum in trace amounts. Accumulation of AGE4 was associated with glucose metabolism abnormalities. A tendency toward AGE4 positivity was less frequent in patients with microangiopathy and in non-treated and gliptin-treated diabetes patients. Key words: ELISA, diabetes, methylglyoxal, advanced glycation end-products (AGEs), slot dot-blot
Non-standard AGE4 epitopes that predict polyneuropathy
independently of obesity can be detected by slot dot-blot immunoassay
Agnieszka Bronowicka-Szydełko
1,A,D, Małgorzata Krzystek-Korpacka
1,C,D, Aleksandra Kuzan
1,C, Kinga Gostomska-Pampuch
1,2,C,
Małgorzata Gacka
3,B, Urszula Jakobsche-Policht
3,B, Rajmund Adamiec
3,D,E, Andrzej Gamian
1,2,D,F1 Department of Medical Biochemistry, Wroclaw Medical University, Poland
2 Laboratory of Medical Microbiology, Hirszfeld Institute of Immunology and Experimental Therapy, Polish Academy of Sciences, Wrocław, Poland 3 Department of Angiology, Diabetes and Hypertension, Wroclaw Medical University, Poland
A – research concept and design; B – collection and/or assembly of data; C – data analysis and interpretation; D – writing the article; E – critical revision of the article; F – final approval of the article
Introduction
Advanced glycation end-products (AGEs) play a pivotal role in the development of complications in individuals with diabetes.1 They have recently gained attention as pro-spective biomarkers and targets for pharmacotherapy for diabetes, atherosclerosis and related metabolic abnormali-ties. They are also being investigated as probable contrib-utors to the pathogenesis of neurodegenerative diseases and cancer.2 Advanced glycation end-products are formed as a result of non-enzymatic reaction between reduc-ing carbohydrates or oxo-aldehydes and amino groups of proteins, nucleic acids or lipids. Glycation negatively affects the functionality of modified macromolecules. It is a multi-step cascade prompted by hyperglycemia and oxidative stress, yielding compounds of varying struc-tures and stability.3 Glycation usually affects proteins with a long half-life, such as extracellular matrix proteins, myelin sheath proteins, crystallins in the eye, or serum albumins.4 Proteins with a short half-life also undergo glycation. However, the resulting products are not AGEs, but Amadori compounds, such as glycated hemoglobin (HbA1c), a routinely assessed marker of glycemic control.5
Studies on the importance of AGEs in human pathol-ogy and potential applications of AGEs in diagnostics and therapy are hindered by their heterogeneity and difficulties in quantification. Only a limited number of AGE struc-tures have been identified, characterized and evaluated in a clinical context. At present, Nε-carboxymethyl-lysine (CML) is the most extensively studied AGE, followed by Nε-(1-carboxyethyl)-lysine (CEL), pentosidine, argpyri-midine (AP), methylglyoxal (MGO)-derived hydroimid-azolone, glyoxal-derived hydroimidasolone, and MOLD (MGO-lysine dimer).6 The relevance of other AGEs remains largely unknown.7 The detection and quantification of AGEs in easily available biological material, such as blood, is dif-ficult. They are characterized by low solubility combined with high viscosity, and unlike in tissues, AGEs in blood are present in trace amounts. Therefore, sophisticated instrumental techniques, such as mass spectrometry, are employed to detect specific AGE epitopes.8 Moreover, ex-traction of AGEs from sera using affinity or liquid chroma-tography is frequently required prior to their identification and quantification.9 The necessity of advanced equipment and specialists limits the possibilities of applying these techniques in clinical practice on a large scale. More ac-cessible techniques such as immunoassays are used mostly to quantify so-called “total AGEs”, a pool of various AGEs with fluorescent properties. Although useful for getting a general overview of the degree of glycation, “total AGEs” do not encompass all AGEs (non-fluorescent species are not accounted for), nor discern the concentrations of any specific AGE. This makes the assessment of their individual contributions to a pathology impossible. Data on specific AGEs determined using immunoassays is scanty, and lim-ited mostly to CML and pentosidine.10
Methylglyoxal is a low-molecular-weight reactive alde-hyde formed endogenously as a by-product of glycolysis and lipid peroxidation.11 It evokes inflammatory12 and immune responses,13 and contributes to mitochondrial dysfunction and the formation of both AGEs and advanced lipoxidation end-products (ALEs). Methylglyoxal has been implicated in the development of complications in diabetes patients13 as well as those with cancer14 and multiple scle-rosis.15 The presence of MGO-modified proteins is usually detected indirectly, by evaluating the titer of the respective autoantibodies. Hydroimidazolone-1 (MG-H1) is the only known specific epitope formed on MGO-modified pro-teins. Others, namely CML and CEL, can be formed not only by MGO but also by glucose modification. Hydro-imidazolone-1 has recently been proposed as a biomarker of reduced diastolic heart function in type 1 diabetes mel-litus (T1DM).16
To our knowledge, no immunoassay allowing quantifica-tion of MGO-derived epitopes (AGE4) other than CML, CEL or MG-H1 has been published. In this paper, we there-fore present a slot dot-blot method for determining MGO-derived non-standard epitopes using commercially avail-able monoclonal antibodies. The suitability of the assay for patient evaluation was tested on individuals with diabetes and related metabolic abnormalities and complications.
Material and methods
Serum samples
Serum samples were obtained from clotted (15 min, room temperature) and centrifuged (15 min, 400 × g) blood drawn by venipuncture following a 12-hour overnight fast and collected into serum-separator tubes.
For the purpose of validation of the method performance in a clinical setting, serum samples were obtained from 46 individuals, of whom 26 were diagnosed with diabetes (10 men and 16 women), and the remaining 20 were ap-parently healthy blood donors (10 men and 10 women). Similarly, AGE4 was determined in 131 individuals: 91 with abnormalities in glucose metabolism (85 diagnosed with diabetes) and 30 apparently healthy blood donors.
Patients with deregulated glucose metabolism were re-cruited from the Department of Angiology, Diabetes and Hypertension of Wroclaw Medical University (Poland). Apparently healthy blood donors, without known glucose metabolism abnormalities, were recruited from the Regio-nal Center of Blood Donation and Therapy (Wrocław, Po-land) using the following inclusion criteria: age >50 years; no known systemic disease, dementia or depression; no ongoing inflammation; and fasting glucose <100 mg/dL.
25–30 kg/m2, and obesity as BMI ≥ 30 kg/m.2,18 Metabolic syndrome (MetS) was diagnosed using the International Diabetes Federation (IDF) criteria19 as the coexistence of central obesity plus any 2 of the following: hypertriglyc-eridemia (≥150 mg/dL) or receiving treatment, low high-density lipoprotein (HDL)-cholesterol (<40 mg/dL in men and <50 mg/dL in women), hypertension (≥130 mm Hg for systolic or ≥85 mm Hg for diastolic) or receiving treat-ment, glucose ≥100 mg/dL or diagnosed with diabetes and receiving treatment. Hyperlipidemia was diagnosed us-ing the guidelines of the European Society of Cardiology (ESC) and the European Atherosclerosis Society (EAS)20 as elevated triglycerides (≥150 mg/dL) and/or low-density lipoprotein (LDL)-cholesterol (≥115 mg/dL) and/or total cholesterol (≥190 mg/dL), or receiving treatment. Hyper-uricemia was diagnosed using the National Health and Nutrition Examination Survey III ( NHANES-III) criteria21 as uric acid ≥7.0 mg/dL in men and ≥5.7 mg/dL in women. Macroangiopathy (atherosclerosis of the arteries) was di-agnosed if any of the following was present: myocardial in-farct, stroke, percutaneous coronary intervention, coronary artery bypass graft, acute coronary syndrome, objective evidence of coronary artery disease (defined as a positive exercise test and angiography with at least 1 stenosis >50), symptomatic peripheral arterial obstructive disease (con-firmed by an ankle/brachial pressure index <0.90 or an am-putation), stenosis of the carotid artery, or cardiovascular death. Microangiopathy was diagnosed in patients with di-abetic nephropathy (albuminuria >30 mg/g, creatinine and glomerular filtration rate (eGFR) using the Chronic Kidney Disease Epidemiology Collaboration Equation (CKD-EPI)), diabetic retinopathy (microaneurysms, dot-blot hemor-rhages, flame-shaped hemorhemor-rhages, retinal edema and hard exudates, soft exudates, venous loops and venous beading, intraretinal microvascular abnormalities, hemorrhage into the vitreous, traction retinal detachments, macular edema etc., detected using ophthalmoscopy, fundus fluorescein angiography or optical coherence tomography) or polyneu-ropathy (diagnosed after excluding other possible causes with the pinprick test to establish absent or reduced pain sensations, electromyography and clinical evaluation us-ing a quantitative diagnostic tool such as the Neuropathy Impairment Score).
The patients’ demographic, laboratory and clinical data was collected prospectively and is presented in Table 1. Data on the implemented treatment as well as the co-ex-istence of other abnormalities is given in Table 2.
Ethical considerations
The study protocol was approved by the Medical Ethics Committee of Wroclaw Medical University (approvals No. KB-303/2010 and No. KB-384/2012) and was in accordance with the ethical standards formulated in the Helsinki Dec-laration of 1975. Informed consent was obtained from all participating individuals.
Antibodies
Specific anti-AGE4 monoclonal antibodies (clone No. 14B5; Cosmo Bio Co. Ltd., Tokyo, Japan) − i.e., MGO-modified bovine serum albumin (BSA) − were used as the primary antibodies. These antibodies have been shown not to cross-react with glucose-modified BSA (AGE-1), glyceraldehyde-modified BSA (AGE-2), glycolaldehyde-modified BSA (AGE-3), glyoxal-glycolaldehyde-modified BSA (AGE-5), an-ti-3-deoxyglucose-modified BSA (AGE-6), CML-modified BSA, CEL-modified BSA, or with native BSA. The method for obtaining and purifying AGE4 monoclonal anti-bodies was described by Takeuchi et al.22
Table 1. Characteristics of patients according to metabolic abnormalities
Metabolic abnormalities n (%)
Diabetes T1DM T2DM T3DM
85 (93.4) 3 (3.5) 76 (89.4)
6 (7.1) Overweight/obesity
overweight obesity I/II/III
28 (30.8) 37 (40.7) Macroangiopathy
IHD ACS IS AO CAP
69 (75.8) 32 (35.2) 18 (19.8) 11 (12.1) 28 (30.8) 62 (68.1) Microangiopathy
retinopathy nephropathy polineuropathy
46 (50.5) 11 (12.1) 20 (22.0) 35 (38.5)
Hypertension 83 (91.2)
Hyperlipidemia 78 (85.7)
Hyperurykemia 26 (33.8)
FLD 12 (13.2)
CKD 10 (11.0)
IHD – ischemic heart disease; ACS – acute coronary syndromes; IS – ischemic stroke; AO – arteriosclerosis obliterans; CAP – carotid artery plaques; FLD – fatty liver disease; CKD – chronic kidney disease.
Table 2. Characteristics of patients according to treatment
Treatment n (%)
Antihypertensive drugs 77 (84.6)
Dyslipidemia medications 55 (60.4)
Aspirin 60 (65.9)
Anticoagulants 13 (14.3)
Clopidogrel 11 (12.1)
Metformin 65 (71.4)
Acarbose 10 (11.0)
Sulphonylureas 31 (34.1)
Gliptins 12 (13.2)
Polyclonal goat anti-mouse IgG (H+L) antibodies con-jugated with horseradish peroxidase (HRP) (Jackson Im-munoResearch Europe Ltd., Ely, UK; cat. No. 115-035-166) were used as secondary antibodies at the dilution recom-mended by the manufacturer (1:2,000).
Direct ELISA assay
The wells of flat-bottom Maxisorp microtiter plates (Nunc A/S, Roskilde, Denmark) were coated with 50 μL of serum samples diluted in 50 mM carbonate buffer (pH 9.6) and incubated for 4 h at 37°C, followed by overnight incubation at 4°C. The following serum dilutions were tested: ×200, ×100, ×50, ×20, ×10, ×5, ×4, ×2, and undiluted. After inten-sive washing with 3 changes of 300 μL of tris buffered saline with tween 20 (TBS-T), pH 7.4, the plates were blocked with 300 µL of 5% skimmed milk for 20 h at 4°C. Unbound milk was removed by washing with TBS-T, pH 7.4 (3 × 300 µL), and the plates were incubated for 2 h at 37°C with 50 µL of the primary antibodies per well. The following dilutions of the primary antibodies were tested: 1:2,000, 1:1,000, 1:500, and 1:250. Subsequently, following a wash step (3 × 300 µL of TBS-T, pH 7.4), the plates were treated with the secondary antibodies conjugated with HRP (50 µL per well; 1:2,000) for 1.5 h at 37°C. After washing (3 × 300 µL of TBS-T, pH 7.4), the emptied wells were filled with 50 µL of o-phenylenediamine dihydrochloride (OPD) (Thermo Fisher Scientific, Rockford, USA) and incubated for 10 min at room temperature. The appearance of an orange-brown product, proportional to the AGE4 concentration in serum samples, was measured at λ = 450 nm using an EnSpire®
microplate reader (Perkin Elmer Inc., Waltham, USA). Additionally, the following negative controls were run si-multaneously with the samples: antigen control (no antigen), blockage control (without the primary or secondary anti-bodies), primary antibody control (no secondary antibody), and secondary antibody control (without the primary anti-body). All the samples and controls were run in triplicate.
Slot dot-blot assay
Fifty microliters of twice-diluted sera in phosphate-buffered saline (PBS) pH 7.2 were applied in duplicate to methanol-activated polyvinylidene difluoride mem-brane (Immobilon®-P Transfer Membrane; Bio-Rad
Labo-ratories, Hercules, USA) using slot apparatus (Bio-Rad Laboratories). The prepared membranes were soaked in 5% skimmed milk in TBS-T for 2 h at room tempera-ture, and then for 18 h at 4°C. After this and every sub-sequent step, the membranes were rinsed 3 times with TBS-T, pH 7.4. Subsequently, the membranes were incu-bated with the primary antibodies for 2.5 h at 37°C, using the following dilutions: 1:2,000, 1:1,000, 1:500, and 1:250 in TBS. After washing, the membranes were incubated for 1.5 h at 37°C with the secondary antibodies conju-gated with HRP, using the 1:2,000 dilution recommended
by the manufacturer. 3-amino-9-ethylcarbazole (Sigma-Aldrich, St. Louis, USA) was used as a substrate for per-oxidase. The density of the developed bands, proportional to AGE4 concentration, was determined using densitom-etry and was expressed in arbitrary units (AU). The read-ings were conducted using the Gel Doc XR+ (Bio-Rad Laboratories), and the band density was analyzed using Image Lab software (Bio-Rad Laboratories). All detected signals were normalized against the background density of the membrane.
Except for determination of the coefficients of variation (CV%), all samples were run in duplicate. Parallel control assays were performed, in which the incubation step with the primary antibodies was omitted to control for the spec-ificity of the secondary antibodies. Any signals observed in the control assays were subtracted from the correspond-ing samples in the test assay.
Statistical analysis
Prior to the analysis, the results of the technical repli-cates were averaged. Data distribution was tested using the Kolmogorov–Smirnov test. Data on AGE4 is presented as medians with 95% confidence intervals (95% CI) and was analyzed using the Mann–Whitney U test. Normally distributed data was analyzed using the t-test for inde-pendent samples with Welch’s correction if appropriate. The frequency analysis was conducted using Fisher’s exact test. Comparisons of 2 proportions were conducted using χ2 statistics. Correlations were analyzed using Spearman’s rank correlation coefficient. Stepwise logistic regression with p < 0.05 as inclusion and p > 0.1 as exclusion criteria was applied to identify independent predictors of AGE4 positivity or polyneuropathy. Odds ratios (ORs) with 95% CI were calculated for significant variables. The accuracy of the model based on explanatory variables was deter-mined using receiver operating characteristics (ROC) curve analysis and expressed as the area under the ROC curve (AUC). Additionally, the sensitivity and specificity of the model corresponding with the optimal cut-off were calculated.
All calculated p-values were two-sided and p ≤ 0.05 was considered statistically significant. The statistical analysis was conducted using MedCalc Statistical Software v. 17.9.6 (MedCalc Software bvba, Ostend, Belgium).
Results
Assay development
Competitive ELISA
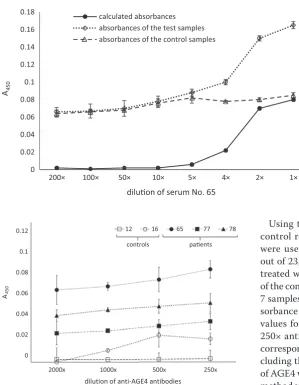
to establish the optimal assay conditions, microtiter plate wells were coated with different dilutions of serum sam-ples, from undiluted sera up to 200-fold dilutions. Except for the least diluted sera, the readings recorded were almost identical with their respective controls (without anti-AGE4 antibodies). Therefore, when the control readings were subtracted from the samples, only the undiluted sera and 200-fold diluted sera had absorbance readings exceeding 0.05. An example of the effect of serum dilution on AGE4 detection is presented in Fig. 1.
The assay was further optimized by testing various di-lutions of anti-AGE4 antibodies using plates coated with either undiluted or 200-fold diluted sera. Of the tested an-tibody dilutions, the highest sample-to-control absorbance ratios were obtained for the lowest dilution (1:250). There was no significant difference between assays conducted using undiluted or 200-fold diluted sera for the coating. The effect of antibody dilution factors on AGE4 detection is presented in Fig. 2 for 6 different sera (2 derived from healthy individuals and 4 from patients with diabetes).
Using the conditions yielding the highest sample-to-control readings, 23 randomly selected serum samples were used to detect and quantify AGE4. In 7 samples out of 23, reactions were clearly observed in anti-AGE4-treated wells, yielding 30% AGE4 positivity. Absorbance of the control wells (sera untreated by anti-AGE4) for these 7 samples was significantly lower. The median AGE4 ab-sorbance was 0.118 (95% CI = 0.13–0.09). The abab-sorbance values for the samples were in the 0.06–0.17 range for 250× anti-AGE4 dilution and in the 0.06–0.09 range for corresponding control samples. Based on the results in-cluding the control test, it was found that trace amounts of AGE4 were detected in some sera, but the direct ELISA method was insufficiently sensitive.
Slot dot-blot
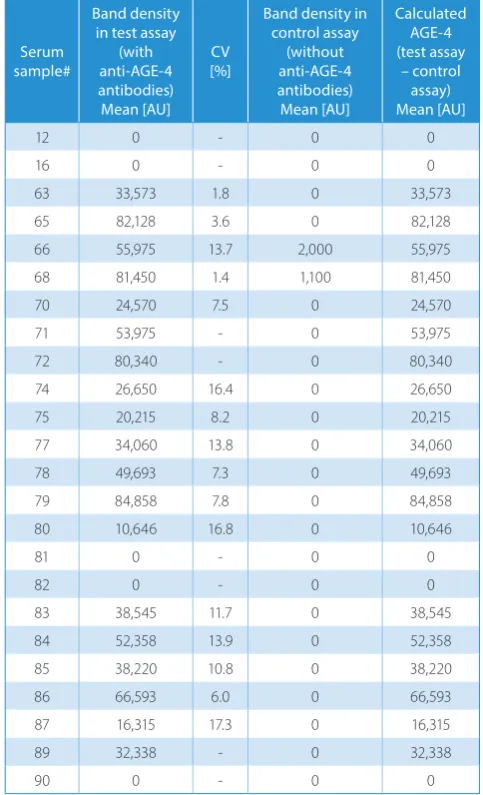
Since the control-adjusted readings in ELISA were gen-erally low, the slot dot-blot method, which allows more antigens to be loaded on a membrane, was tried. The serum dilution was fixed at 1:200 and only the AGE4 anti-body step was adjusted. As in the ELISA test, the starting antibody dilution was 1:2,000. Since there was no signal on the membranes, lower dilutions were tested; a 1:250 di-lution was found to yield signals in a number of sera (Fig. 3). Using a 1:250 antibody dilution, 24 randomly selected sera were tested (22 from individuals with abnormalities in glucose metabolism and 2 from healthy blood donors). Simultaneously, a control assay, without anti-AGE4 an-tibodies, was run. A number of bands could be clearly observed in an anti-AGE4-treated blot: 17 samples out of 24, yielding 71% AGE4 positivity. However, there were only 2 responses in the control assay (Fig. 4, samples #66 and #68). The density of these control bands was relatively small, constituting 3.6% and 1.4% of the density recorded for corresponding samples treated with anti-AGE4. Non-specific signals from the controls were subtracted from the test samples to calculate AGE4 levels. The median AGE4 level was 29,494 AU (95% CI = 7,950–41,369). Data
Fig. 1. The absorbance values of the test samples (serum No. 65), control samples and the calculated absorbance
Fig. 2. Absorbance values (results after taking into account the absorbance values of the control samples, i.e., corresponding anti-AGE4 untreated sera) obtained using direct ELISA. Serum dilutions in carbonate buffer were ×1. The anti-AGE4 dilution in TBS was ×250
0 0.02 0.04 0.06 0.08 0.1 0.12 0.14 0.16 0.18
200× 100× 50× 10× 5× 4× 2× 1×
A450
diluon of serum No. 65 calculated absorbances
absorbances of the test samples absorbances of the control samples
2000x
12
controls paents
16 65 77 78
0.12
0.1
0.08
0.06
0.04
0.02
0
1000x 500x 250x
A45
0
on individual AGE4 levels for both assays (test and control) is presented in the Table 3. The mean CV% calculated for technical replicates was 9.9%.
In order to determine the intra- and inter-assay CV%, 12 replicates of selected serum samples were run within the same assay on 9 separate runs. The calculated intra-assay CV% was 10.8% and the inter-intra-assay CV% was 10.6%, both within the range acceptable for immunoassays.
The slot dot-blot method was used to quantify AGE4 levels in the healthy individuals and in the patients with diabetes with respect to disease complications, other meta-bolic abnormalities and treatment.
AGE4 and diabetes
As shown in Table 1, the healthy controls had low-er AGE4 and AGE4 positivity than the patients. When analyzed in terms of the relationship with diabetes,
the non-diabetic study participants had lower median AGE4 than the diabetics: 0 AU (0–0) vs 11,501 AU (3,061– 26,905) (p < 0.0001) as well as lower AGE4 positivity (19.4% vs 64.7%, p < 0.0001).
There was no significant difference between the diabet-ics and the controls in terms of median AGE4 (p = 0.485) or AGE4 positivity (p = 0.992). However, the patients with un-controlled disease had significantly lower median AGE4 than the patients with controlled disease (3,906 AU (0–21,426) vs 26,979 AU (6,605–45,322), p = 0.033) and tended to have low-er AGE4 positivity (58.2% vs 76.6%, p = 0.102). Thlow-ere was also a negative correlation between AGE4 and HbA1C: ρ = −0.29, p = 0.008, particularly in males: ρ = −0.42, p = 0.018.
AGE4 and other metabolic abnormalities
To evaluate correlations between AGE4 and various metabolic abnormalities, we compared the median AGE4 Fig. 4. Slot dot-blot results of diabetes sera treated with A) anti-AGE4 and secondary anti-mice IgG antibodies, and B) only secondary anti-mice IgG antibodies (control slot dot-blot). The number of sample tested is given on the left side of the blot and the number of the technical replicate is given at the bottom
Fig. 3. Results of the slot dot-blot test carried out at the following anti-AGE4 dilutions: ×2,000, ×1,000, ×500, and ×250. The number of the sample tested is given on the left side of the blot and the number of the technical replicate is given at the bottom ×2000
61
62 63 65
66
68
70
71
1st 2nd 1st 2nd 1st 2nd 1st 2nd 61
62 63 65
66
68
70
71
61
62 63 65
66
68
70
71
61
62 63 65
66
68
70
71
×1000 ×500 ×250
1st
blot with anti-AGE4 antibodies
control blot – without anti-AGE4
and the distribution of AGE4-positive samples among patients with and without obesity, hypertension, hyper-lipidemia, hyperuricemia, fatty liver disease, and chronic kidney disease. Of these, obese patients had a significantly higher median AGE4 than non-obese ones: 33,573 AU (15,786–46,033) vs 3,242 AU (0–11,391) (p = 0.004) and a higher percentage of AGE4 positivity: 75.7% vs 55.6% (p = 0.051). Moreover, there was a positive correlation be-tween AGE4 and BMI: ρ = 0.27, p = 0.018.
AGE4 and diabetic complications
We also compared the median AGE4 and the distri-bution of AGE4-positive samples between patients with and without diabetic complications: macroangiopathy in general and as ischemic heart disease, acute coronary syndromes, ischemic stroke, arteriosclerosis obliterans, and carotid artery plaques; as well as microangiopathy
in general and as retinopathy, nephropathy and neuropa-thy. AGE4 positivity tended to be less frequent in patients with microangiopathy in general as compared to patients without microangiopathy (54.3% vs 73.3%; p = 0.061). De-tailed analysis showed a significant correlation between AGE4 positivity and polyneuropathy: Patients with this complication had significantly lower AGE4 positivity than those without it (45.7% vs 75%, p = 0.005).
AGE4 and treatment
We compared the median AGE4 and the distribution of AGE4-positive samples between patients treated and untreated with insulin, sulfonylurea, metformin, gliptins, acarbose, antihypertensive drugs, dyslipidemia medica-tions, anticoagulants, aspirin, and clopidogrel. The median AGE4 was higher in metformin-treated than in non-treated patients: 20,215 AU (6,533–35,430) vs 384 AU (0–11,318) (p = 0.011). AGE4 positivity tended to be higher in metfor-min-treated patients as well (69.2% vs 50% for non-treated; p = 0.086) but was significantly lower in gliptin-treated than non-treated patients (33.3% vs 68.4%; p = 0.019).
Independent predictors of AGE4 positivity:
multivariate analysis
To identify independent factors associated with AGE4 positivity, stepwise logistic regression was employed. Obe-sity, HbA1C, polyneuropathy, and treatment with gliptins were entered as explanatory variables. Polyneuropathy (coefficient 1.55, p = 0.003) and obesity (coefficient 1.1, p = 0.039) were found independently associated with AGE4 positivity with the following odds ratios (ORs): 0.21 (95% CI = 0.08–0.58) for polyneuropathy and 3.02 (1.1–8.6) for obesity. The model built on both variables correctly clas-sified 71.1% of the cases and its overall accuracy was 73%. When treatment with metformin was entered as an addi-tional explanatory variable, it replaced obesity in the mod-el. Polyneuropathy had a coefficient of −1.67 (p = 0.002), while the coefficient for metformin was 1.33 (p = 0.027). The ORs for polyneuropathy and metformin treatment were 0.19 (0.07–0.53) and 3.76 (1.16–12.18), respectively. The model correctly classified 70% of the cases and its accuracy was 72%.
AGE4 positivity as an independent
predictor of polyneuropathy
To test the strength of the association of AGE4 positivity with polyneuropathy, stepwise logistic regression was em-ployed. To select variables associated with polyneuropathy in a univariate analysis, categorical data was tested using Fisher’s exact test, while continuous data was submitted to a t-test for independent samples. Fasting glucose, HbA1C, and triglycerides were significantly increased in patients with polyneuropathy. They were therefore entered into Table 3. Band density of studied samples and controls. Errors
of measurement
Serum sample#
Band density in test assay
(with anti-AGE-4 antibodies) Mean [AU]
CV [%]
Band density in control assay
(without anti-AGE-4 antibodies) Mean [AU]
Calculated AGE-4 (test assay
– control assay) Mean [AU]
12 0 - 0 0
16 0 - 0 0
63 33,573 1.8 0 33,573
65 82,128 3.6 0 82,128
66 55,975 13.7 2,000 55,975
68 81,450 1.4 1,100 81,450
70 24,570 7.5 0 24,570
71 53,975 - 0 53,975
72 80,340 - 0 80,340
74 26,650 16.4 0 26,650
75 20,215 8.2 0 20,215
77 34,060 13.8 0 34,060
78 49,693 7.3 0 49,693
79 84,858 7.8 0 84,858
80 10,646 16.8 0 10,646
81 0 - 0 0
82 0 - 0 0
83 38,545 11.7 0 38,545
84 52,358 13.9 0 52,358
85 38,220 10.8 0 38,220
86 66,593 6.0 0 66,593
87 16,315 17.3 0 16,315
89 32,338 - 0 32,338
90 0 - 0 0
the model of logistic regression as explanatory variables in addition to AGE4 positivity. Of these, AGE4 positiv-ity (coefficient −1.42, p = 0.015) and HbA1C (coefficient 0.37, p = 0.010) were found to be independent predictors of polyneuropathy with ORs of 0.24 (95% CI = 0.08−0.75) for AGE4 positivity and 1.6 (1.1−2.3) for HbA1C. The model built on both variables correctly classified 70.4% of the cas-es and its overall accuracy was 76%. The combined markers were characterized by perfect specificity but low sensitivity in detecting polyneuropathy (Fig. 5).
Discussion
There is growing interest in detecting and quantifying individual AGE epitopes, as various AGEs may evoke dif-ferent, even contradictory, responses in the body.23 How-ever, the available tools remain limited. Of these, immu-noassays are likely to have a potential for a widespread application due to their relative simplicity and low cost, but the available ELISAs for AGEs are usually universal assays not dedicated to quantifying individual AGEs epitopes.22,24
In this paper, we present a slot dot-blot method for the semi-quantitative determination of non-standard epi-topes of AGE4 present in trace amounts in sera. In a clas-sic ELISA using a microtiter plate format, the sensitivity of the assay is limited by the volume of the serum sample loaded into the well. The amount of antigen successfully bound to the microtiter plate well is directly correlated with its concentration in a medium. Therefore, the lower
the concentration of an antigen of interest in the medium, the lower the probability of its being bound and not re-moved in subsequent washing steps. Moreover, the more complex the medium, the greater the presence of com-peting antigens, and the binding of a particular antigen of interest is even less probable. Although the problem can be solved by prior extraction of the antigen of interest, allowing for its relative concentration, such an approach is expensive and time- and labor-consuming. It may also require sophisticated procedures and equipment, thus hin-dering the widespread application of such a method in clin-ical and diagnostic laboratories. In this respect, the slot dot-blot method is superior, as it allows for more of the an-tigen of interest to be loaded on a carrier membrane. There is no volume limit of the serum sample to be loaded, and the use of a vacuum ensures that all the antigens are suc-cessfully bound and retained on the membrane. There-fore, as our study demonstrated, the slot dot-blot method allowed us, with satisfying reproducibility, to detect and semi-quantify AGE4 antigens undetectable with a com-petitive ELISA. The superior sensitivity of the slot dot-blot method as compared to a classic ELISA has also been demonstrated by others, as it was previously used to detect the presence of malaria-causing Plasmodium falciparum
in mosquitos.25,26
Using monoclonal antibodies to target non-standard epitopes of AGE4 (MGO-modified albumin) that do not cross-react with other AGEs or albumin modified by stan-dard AGE epitopes such as CML and CEL, we showed that their increased serum levels correlate with diabetes and obesity. This observation is in line with AGE formation being accelerated not only by hyperglycemia but by hyper-lipidemia, as well as by the oxidative stress and low-grade inflammation accompanying these conditions.27 Methyl-glyoxal represents low-molecular aldehydes derived from normal metabolism as well as pathological glycation and lipoxidation. The reactivity of MGO is about 20,000 times higher than the reactivity of glucose. As such, MGO has been called (by van der Heijden et al.) “a key compound involved in the very fast generation of glycation adducts”, also produced in reactions with short-lived proteins.28 El-evated concentrations of MGO in serum have previously been shown in diabetes20 and held responsible for induc-ing maladaptive responses in the vasculature.29 Similarly, MGO has been linked with diabetic complications, increas-ing risk of cardiovascular events and mortality,31 as well as impairing bone regeneration in patients with diabe-tes.32 Mechanistically, MGO has been shown to interfere with the platelet-derived growth factor B/platelet-derived growth factor receptor β (PDGFB/PDGFRβ) axis in smooth muscle cells and fibroblasts through formation of CML and CEL adducts on the PDGFB receptor. PDGFRβ inhibi-tion, in turn, destabilizes the fibrous cap on atherosclerotic plaque, contributing to its rapture by inducing growth ar-rest and apoptosis of smooth muscle cells and fibroblasts.33 However, animal studies have shown that MGO-derived Fig. 5. Receiver operating characteristic (ROC) curve for combined AGE4
positivity and HbA1c as markers of polyneuropathy. Data is presented as area under ROC curve (AUC) with 95% CI and sensitivity (sens.) and specificity (spec.) corresponding with the optimal cut-off (represented as solid circle on the graph)
0 20 40 60 80 100
0 20 40 60 80 100
100-specificity
sensitivit
y
AGEs also accumulate in the pancreatic β cells of healthy rats, and the levels of these AGEs were not affected by strep-tozotocin-induced diabetes. Therefore, it has been sug-gested that MGO-derived AGEs may play a positive role in the post-translational maturation of insulin.34
To our knowledge, there are no studies in the literature that analyze the amount of a specific epitope of an MGO-modified protein in the context of metformin; only the in-fluence of metformin on MGO content in human serum has been checked.35 Beisswenger et al. used high-perfor-mance liquid chromatography to examine MGO in plasma from 57 subjects with T2DM, half of whom were being treated with metformin. Those authors found that metfor-min reduces MGO in a dose-dependent fashion and metfor- mini-mizes the effect of worsening glycemic control on MGO levels.36 A similar conclusion was reached by Kiho et al., who incubated BSA or RNase with MGO, and metfor-min turned out to be an inhibitor of AGE formation.37 In our study we found that the level of AGE4 is higher in patients treated with metformin. This is somewhat con-tradictory to the finding that the drug reduces systemic MGO levels in T2DM, because it is logical that the more MGO is present, the higher AGE4 levels are expected. Additional studies of the potential effects of metformin on MGO production and modifying proteins by MGO are required to further elucidate the role of metformin in diabetic complications.
The effect of gliptins (dipeptidyl peptidase-4 inhibitors, an established anti-inflammatory drug) on MGO-induced glycation has not been thoroughly researched. It has been reported that linagliptin improves MGO-induced peritone-al fibrosis. In a study carried out on mice, it was found that linagliptin suppressed the expression of fibrotic markers, such as alpha-smooth muscle actin (α-SMA), fibroblast-specific protein-1 (FSP-1) and type I and III collagen, and inhibited macrophage infiltration in MGO-induced peri-toneal fibrosis.38 It has also been shown that gemigliptin inhibits MGO-modified AGE-BSA formation and traps MGO in a concentration-dependent manner.39 Regarding drugs of this group, our study found the expected results: AGE4 positivity was significantly lower in gliptin-treated patients than in non-treated patients, which confirmed its anti-glycation properties.
Conclusions
The extent to which high glucose levels in diabetic pa-tients, as estimated by measuring HbA1c levels, contributes directly to vascular disease remains controversial. Recent studies have suggested that postprandial spikes of high glucose may be a more robust determinant of vascular risk than average glucose levels as determined by HbA1c. However, we should recognize that HbA1c levels are un-likely to provide a fully accurate picture of temporal gly-cemic fluctuations, and thus there is a difference between
diabetic individuals with and without regular occurrences of hyperglycemic spikes. This may be one of the underlying reasons why glycemic control, as measured by decreasing HbA1c levels, has not been consistent in successfully reduc-ing vascular disease.40 The formation of MGO might be a mechanism that causes repeated glucose spikes to have a more damaging effect than high fasting or mean glucose levels on endothelial cells and the development of vascular complications. Methylglyoxal is a strong candidate for use as a more robust clinical marker of glycemic fluctuation than HbA1c. A major challenge for the future would be to systematically analyze MGO-modified proteins in order to identify a better risk predictor than HbA1c. Methylg-lyoxal triggers maladaptive responses in vascular tissue.41 AGE4 positivity and HbA1c were found to be independent predictors of polyneuropathy.
ORCID iDs
Agnieszka Bronowicka-Szydełko
https://orcid.org/0000-0001-9967-036X
Małgorzata Krzystek-Korpacka https://orcid.org/0000-0002-2753-8092 Aleksandra Kuzan https://orcid.org/0000-0003-4264-8174 Kinga Gostomska-Pampuch https://orcid.org/0000-0002-0771-3893 Małgorzata Gacka https://orcid.org/0000-0001-5760-1534
Urszula Jakobsche-Policht https://orcid.org/0000-0002-5510-2675 Rajmund Adamiec https://orcid.org/0000-0002-5616-5088 Andrzej Gamian https://orcid.org/0000-0002-2206-6591
References
1. Singh VP, Bali A, Singh N, Jaggi AS. Advanced glycation end products and diabetic complications. Korean J Physiol Pharmacol. 2014;18(1): 1–14.
2. Ott C, Jacobs K, Haucke E, Navarrete Santos A, Grune T, Simm A. Role of advanced glycation end products in cellular signaling. Redox Biol. 2014;2:411–429.
3. Singh R, Barden A, Mori T, Beilin L. Advanced glycation end-prod-ucts. Diabetologia. 2001;44(2):129–146.
4. Goh SY, Cooper ME. Clinical review: The role of advanced glycation end products in progression and complications of diabetes. J Clin
Endocrinol Metab. 2008;93(4):1143–1152.
5. Neelofar K, Arif Z, Ahmad J, Alam K. Non-enzymatic glucosylation induced neo-epitopes on human serum albumin: A concentration based study. PLoS One. 2017;13:2(2):e0172074.
6. Kaur N, Kishore L, Singh R. Dillenia indica L. attenuates diabetic nephrop-athy via inhibition of advanced glycation end products accumulation in STZ-nicotinamide induced diabetic rats. J Tradit Complement Med. 2017;8(1):226–238.
7. Bär KJ, Franke S, Wenda B, et al. Pentosidine and N-ε carboxymethyl)-lysine in Alzheimer’s disease and vascular dementia. Neurobiol Aging. 2003;24(2):333–338.
8. de Vos LC, Lefrandt JD, Dullaart RP, Zeebregts CJ, Smit AJ. Advanced glycation end products: An emerging biomarker for adverse out-come in patients with peripheral artery disease. Atherosclerosis. 2016; 254:291–299.
9. Lopez-Clavijo AF, Duque-Daza CA, Soulby A, Canelon IR, Barrow M, O’Connor PB. Unexpected crosslinking and diglycation as advanced glycation end-products from glyoxal. J Am Soc Mass Spectrom. 2014; 25(12):2125–2133.
10. Haddad M, Knani I, Bouzidi H, Berriche O, Hammami M, Kerkeni M. Plasma levels of pentosidine, carboxymethyl-lysine, soluble recep-tor for advanced glycation end products, and metabolic syndrome: The metformin effect. Dis Markers. 2016;2016:6248264.
12. Lin CC, Chan CM, Huang YP, Hsu SH, Huang CL, Tsai SJ. Methylglyoxal activates NF-κB nuclear translocation and induces COX-2 expres-sion via a p38-dependent pathway in synovial cells. Life Sci. 2016;149: 25–33.
13. Jyot, Mir AR, Habib S, Siddiqui SS, Ali A, Moinuddin. Neo-epitopes on methylglyoxal modified human serum albumin lead to aggres-sive autoimmune response in diabetes. Int J Biol Macromol. 2016;86: 799–809
14. Mir AR, Moinuddin, Habib S, Khan F, Alam K, Ali A. Structural changes in histone H2A by methylglyoxal generate highly immunogenic amorphous aggregates with implications in auto-immune response in cancer. Glycobiology. 2016;26(2):129–141.
15. Wetzels S, Wouters K, Schalkwijk CG, Vanmierlo T, Hendriks J. Methyl-glyoxal-derived advanced glycation endproducts in multiple scle-rosis. Int J Mol Sci. 2017;18(2). doi:10.3390/ijms18020421
16. Brunvand L, Heier M, Brunborg C, et al. Advanced glycation end products in children with type 1 diabetes and early reduced dia-stolic heart function. BMC Cardiovasc Disord. 2017;17(1):133. 17. WHO. Global report on diabetes. Geneva, Switzerland: World Health
Organization; 2017.
18. WHO. Obesity: Preventing and managing the global epidemic. Report of a World Health Organization Consultation. WHO Technical Report Series 894. Geneva, Switzerland: World Health Organization; 2000. 19. Peralta C, Hamid P, Batool H, Al Achkar Z, Maximus P. Psoriasis and
Metabolic Syndrome: Comorbidities and Environmental and Thera-peutic Implications. Cureus. 2019;11(12):e6369. doi: 10.7759/cureus. 6369
20. Catapano AL, Graham I, De Backer G, et al. 2016 ESC/EAS Guide-lines for the Management of Dyslipidaemias. Eur Heart J. 2016;37(39): 2999–3058.
21. Centers for Disease Control and Prevention. The Third National Health and Nutrition Examination Survey (NHANES III 1988-94) reference manuals and reports. Hyattsville, MD: National Center for Health Statistics; 1996.
22. Takeuchi M, Yanase Y, Matsuura N, et al. Immunological detection of a novel advanced glycation end-product. Mol Med. 2001;7(11): 783–791.
23. Heier M, Margeirsdottir HD, Torjesen PA, Seljeflot I, Stensaeth KH, Gaarder M. The advanced glycation end product methylglyoxal-derivedhydroimidazolone-1 and early signs of atherosclerosis in childhood diabetes. Diab Vasc Dis Res. 2015;12(2):139–145.
24. Adisakwattana S, Thilavech T, Chusak C. Mesona chinensis Benth extract prevents AGE formation and protein oxidation against fruc-tose-induced protein glycation in vitro. BMC Complement Altern Med. 2014;14:130.
25. Stone W, Grabias B, Lanke K, et al. A comparison of Plasmodium
fal-ciparum circumsporozoite protein-based slot blot and ELISA
immu-no-assays for oocyst detection in mosquito homogenates. Malar J. 2015;14(1):451.
26. Kumar S, Zheng H, Sangweme DT, et al. A chemiluminescent-west-ern blot assay for quantitative detection of Plasmodium falciparum
circumsporozoite protein. J Immunol Methods. 2013;390(1–2):99–105.
27. Khuhawar MY, Zardari LA, Laghari AJ. Capillary gas chromatographic determination of methylglyoxal from serum of diabetic patients by precolumn derivatization with 1,2-diamonopropane. J Chromatogr
B Analyt Technol Biomed Life Sci. 2008;873(1):15–19.
28. van der Heijden RA, Bijzet J, Meijers WC, et al. Obesity-induced chronic inflammation in high fat diet challenged C57BL/6J mice is associated with acceleration of age-dependent renal amyloidosis. Sci Rep. 2015; 5:16474. doi:10.1038/srep16474
29. Mirza MA, Kandhro AJ, Memon SQ, Khuhawar MY, Arain R. Determina-tion of glyoxal and methylglyoxal in the serum of diabetic patients by MEKC using stilbenediamine as derivatizing reagent. Electro phoresis. 2007;28(21):3940–3947.
30. Kandhro AJ, Mirza MA, Khuhawar MY. Capillary gas chromatographic determination of methylglyoxal from serum of diabetic patients by precolumn derivatization using meso-stilbenediamine as derivatiz-ing reagent. J Chromatogr Sci. 2008;46(6):539–543.
31. Hanssen NMJ, Scheijen JLJM, Jorsal A, et al. Higher plasma methyl-glyoxal levels are associated with incident cardiovascular disease in individuals with type 1 diabetes: A 12-year follow-up study.
Dia-betes. 2017;66(8):2278–2283.
32. Aikawa T, Matsubara H, Ugaji S, et al. Contribution of methylgly-oxal to delayed healing of bone injury in diabetes. Mol Med Rep. 2017;16(1):403–409.
33. Cantero AV, Portero-Otín M, Ayala V, et al. Methylglyoxal induces advanced glycation end product (AGEs) formation and dysfunc-tion of PDGF receptor-beta: Implicadysfunc-tions for diabetic atherosclerosis.
FASEB J. 2007;21(12):3096–3106.
34. Morioka Y, Teshigawara K, Tomono Y, et al. The specific localization of advanced glycation end-products (AGEs) in rat pancreatic islets.
J Pharmacol Sci. 2017;134(4):218–224.
35. Peters AS, Wortmann M, Fleming TH, et al. Effect of metformin treat-ment in patients with type 2 diabetes with respect to glyoxalase 1 activity in atherosclerotic lesions. Vasa. 2019;48(2):186–192. 36. Beisswenger PJ, Howell SK, Touchette AD, Lal S, Szwergold BS.
Met-formin reduces systemic methylglyoxal levels in type 2 diabetes.
Diabetes. 1999;48(1):198–202.
37. Kiho T, Kato M, Usui S, Hirano K. Effect of buformin and metformin on formation of advanced glycation end products
by methylglyox-al. Clin Chim Acta. 2005;358(1–2):139–145.
38. Nagai T, Doi S, Nakashima A, et al. Linagliptin ameliorates methylglyoxal- induced peritoneal fibrosis in mice. PLoS One. 2016;11(8):e0160993 39. Jung E, Kim J, Kim SH, Kim S, Cho MH. Gemigliptin, a novel
dipepti-dyl peptidase-4 inhibitor, exhibits potent anti-glycation properties in vitro and in vivo. Eur J Pharmacol. 2014;744:98–102.
40. Prázný M, Škrha J, Šoupal J, Škrha J Jr. Glycemic variability and micro-vascular complications of diabetes. Cas Lek Cesk. 2017;156(6):308–313. 41. Beisswenger PJ, Howell SK, Russell GB, Miller ME, Rich SS, Mauer M.