Journal on Today’s Ideas - Tomorrow’s Technologies Vol. 1, No. 1 June 2013 pp. 29–43
©2013 by Chitkara University. All Rights Reserved.
DOI: 10.15415/jotitt.2013.11003
Concrete Mix Design
Using Artificial Neural Network
Sakshi Gupta
National Institute of Technology, Kurukshetra 136118, Haryana, India
Abstract
Concrete mix design is a process based on sound technical principles for proportioning of ingredients in right quantities. This paper demonstrates the applicability of Artificial Neural Networks (ANN) Model for approximate proportioning of concrete mixes. For ANN a trained back propagation neural network is integrated in the model to learn experimental data pertaining to predict 7, 14 and 28-day compressive strength which have been loaded into a model, containing 55 concrete mixtures. The ANN model proposed is based on 5 input parameters such as cement, sand, coarse aggregate, and water and fineness modulus. The proposed concrete mix proportion design is expected to reduce the number of trials in laboratory as well as field, saves cost of material as well as labor and also saves time as it provides higher accuracy. The concrete designed is expected to have higher durability and hence is economical.
Keywords: concrete mix, artificial neural network (ANN), 7-days strength, 14-days strength, 28-days compressive strength, fineness modulus, activation function, modeling.
INtroDUCtIoN
C
oncrete is the most widely used construction material because of its flowability in most complicated form i.e. its ability to take any shape while wet, and its strength development characteristics when it hardens. Concrete production is a complex process that involves the effect of several processing parameters on the quality control of concrete pertaining to workability, strength etc. These parameters are all effective in producing a single strength quantity of compressive strength.Artificial intelligence has proven its capability in simulating and predicting the behaviour of the different physical phenomena in most of the engineering fields. Artificial intelligence is receiving greater attention from the building industry to aid in the decision-making process in areas such as diagnostics, design, and repair and rehabilitation. In civil engineering, design of concrete mix is difficult and sensitive. The classical way for the determination of concrete mix design is based on uncertainty and depends on expert ideas.
Gupta, S.
30
influenced by a number of factors. The concrete mix design is based on the principles of workability of fresh concrete, desired strength and durability of hardened concrete which in turn is governed by water-cement ratio law. The strength of the concrete is determined by the characteristics of the mortar, coarse aggregate, and the interface. For the same quality mortar, different types of coarse aggregate with different shape, texture, mineralogy, and strength may result in different concrete strengths. There are various types of mixes such as nominal mix, standard mix and design mix. Nominal mixes are mixes of fixed cement-aggregate ratio which ensures adequate strength. However, due to the variability of mix ingredients the nominal concrete for a given workability varies widely in strength. The nominal mixes of fixed cement-aggregate ratio (by volume) vary widely in strength and may result in under- or over-rich mixes. For this reason, the minimum compressive strength has been included in many specifications. These mixes are termed standard mixes. In designed mixes the performance of the concrete is specified by the designer but the mix proportions are determined by the producer of concrete, except that the minimum cement content can be laid down. The common method of expressing the proportions of ingredients of a concrete mix is in the terms of parts or ratios of cement, fine and coarse aggregates. For e.g., a concrete mix of proportions 1:2:4 means that cement, fine and coarse aggregate are in the ratio 1:2:4 or the mix contains one part of cement, two parts of fine aggregate and four parts of coarse aggregate. The proportions are either by volume or by mass which provides two design methods. The concrete mix design can be carried out using IS standard code or US system of units. The tests for compressive strength are generally carried out at about 7, 14 or 28 days from the date of placing the concrete. The testing at 28-days is standard and therefore essential and at other ages can be carried out, if necessary.
ANNs have been applied to many civil engineering applications with some degree of success. ANNs have been applied to geotechnical problem like prediction of settlement of shallow foundations [1]. Many researchers have used ANN in structural engineering developing various neural network models [2-14].
Artificial Neural Network (ANN)
Concrete Mix Design Using Artificial Neural Network
31
interconnections. Neural networks might be or multi layered. The single-layer neural networks present processing units of the neural networks, which take input from the outside of the networks and transmit their output to the outside of the networks; otherwise, the neural networks are considered multi layered. The basic methodology of neural networks consists of three processes: Network training, testing, and implementation. The connection weights of the neural network are adjusted through the training process, while the training effect is referred to as learning. Training of neural networks usually involves modifying connection weights by means of a learning rule. The learning process is done by giving weights and biases computed from a set of training data or by adjusting the weights according to a certain condition. In other words, neural networks learn from examples and exhibit some capability for generalization beyond the training data. Then, other testing data are used to check the generalization. The initial weights and biases joining nodes of an input layer, hidden layers, and an output layer are commonly assigned randomly. The weights and biases are changed for the output of networks to match required data values. As input data are passed through hidden layers, sigmoidal activation functions are generally used. During the training procedure, the data are selected uniformly. A specific pass is completed when all data sets have been processed. Generally, several passes are required to attain a desired level of estimation accuracy. The final sets of weights and biases comprise the long-term memory, or synapses, of respective events. Consequently, learning corresponds to determining the weights and biases associated with the connections in the networks. The back-propagation networks were used in this study. The learning mechanism of the back-propagation networks is a generalized delta rule that performs a gradient descent on the error space to minimize the total error between the actual calculated values and the desired ones of an output layer during modification of connection weights. In other words, a least mean square procedure is carried out to find the values of the connection weights that minimize the error function by using a gradient descent method.
Gupta, S.
32
between its processing units) for which the trained ANN can predict accurate values of outputs for a given set of inputs from within the range of the training data. A neural network model requires no functional relationship among the variables, as is the case with most of other regression analysis techniques. A neural network based modelling algorithm requires setting up of different learning parameters (like learning rate, momentum), the optimal number of nodes in the hidden layer and the number of hidden layers so as to have a less complex network with a relatively better generalization capability.
The use of ANN offers the following useful properties and capabilities: Non-linearity
•
Input-output mapping
•
Adaptivity
•
Contextual information
•
Uniformity of analysis and design
•
In this study, multilayer perceptron (MLP): a feed forward artificial neural network model is implemented. A large test database has been extensively surveyed and collected. It is then carefully examined to establish the input vectors and the desired output vectors. Finally, a new model is proposed based on ANN and then verified against experimental data which has been collected from different sources.
Materials used and Database
The main ingredients are given below which form a part of the input data along with fineness modulus:
Cement
•
Sand
•
Coarse Aggregates
•
Water
•
Concrete Mix Design Using Artificial Neural Network
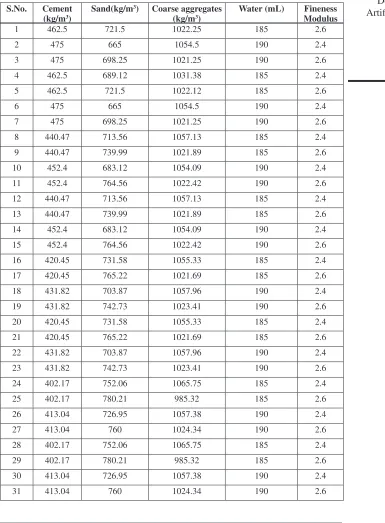
33 Table 1: Input data for the ANN modeling
S.No. Cement
(kg/m3) Sand(kg/m
3) Coarse aggregates
(kg/m3) Water (mL) ModulusFineness
1 462.5 721.5 1022.25 185 2.6
2 475 665 1054.5 190 2.4
3 475 698.25 1021.25 190 2.6
4 462.5 689.12 1031.38 185 2.4
5 462.5 721.5 1022.12 185 2.6
6 475 665 1054.5 190 2.4
7 475 698.25 1021.25 190 2.6
8 440.47 713.56 1057.13 185 2.4
9 440.47 739.99 1021.89 185 2.6
10 452.4 683.12 1054.09 190 2.4
11 452.4 764.56 1022.42 190 2.6
12 440.47 713.56 1057.13 185 2.4
13 440.47 739.99 1021.89 185 2.6
14 452.4 683.12 1054.09 190 2.4
15 452.4 764.56 1022.42 190 2.6
16 420.45 731.58 1055.33 185 2.4
17 420.45 765.22 1021.69 185 2.6
18 431.82 703.87 1057.96 190 2.4
19 431.82 742.73 1023.41 190 2.6
20 420.45 731.58 1055.33 185 2.4
21 420.45 765.22 1021.69 185 2.6
22 431.82 703.87 1057.96 190 2.4
23 431.82 742.73 1023.41 190 2.6
24 402.17 752.06 1065.75 185 2.4
25 402.17 780.21 985.32 185 2.6
26 413.04 726.95 1057.38 190 2.4
27 413.04 760 1024.34 190 2.6
28 402.17 752.06 1065.75 185 2.4
29 402.17 780.21 985.32 185 2.6
30 413.04 726.95 1057.38 190 2.4
Gupta, S.
34
Table 2: Actual Output data for modeling
S.No. 7 days Strength 14 days Strength 28 days Strength
1 27.68 32.71 38.4
2 24.66 26.68 29.88
3 27.35 28.68 35.88
4 24.75 27.66 29.77
5 27.42 34.95 39.37
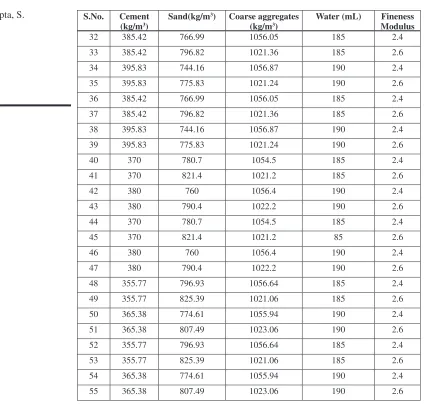
S.No. Cement
(kg/m3) Sand(kg/m
3) Coarse aggregates
(kg/m3) Water (mL) ModulusFineness
32 385.42 766.99 1056.05 185 2.4
33 385.42 796.82 1021.36 185 2.6
34 395.83 744.16 1056.87 190 2.4
35 395.83 775.83 1021.24 190 2.6
36 385.42 766.99 1056.05 185 2.4
37 385.42 796.82 1021.36 185 2.6
38 395.83 744.16 1056.87 190 2.4
39 395.83 775.83 1021.24 190 2.6
40 370 780.7 1054.5 185 2.4
41 370 821.4 1021.2 185 2.6
42 380 760 1056.4 190 2.4
43 380 790.4 1022.2 190 2.6
44 370 780.7 1054.5 185 2.4
45 370 821.4 1021.2 85 2.6
46 380 760 1056.4 190 2.4
47 380 790.4 1022.2 190 2.6
48 355.77 796.93 1056.64 185 2.4
49 355.77 825.39 1021.06 185 2.6
50 365.38 774.61 1055.94 190 2.4
51 365.38 807.49 1023.06 190 2.6
52 355.77 796.93 1056.64 185 2.4
53 355.77 825.39 1021.06 185 2.6
54 365.38 774.61 1055.94 190 2.4
Concrete Mix Design Using Artificial Neural Network
35 S.No. 7 days Strength 14 days Strength 28 days Strength
6 23.15 29.51 31.48
7 23.55 32.4 34.86
8 18.04 26.17 24.64
9 19.86 28.91 27.68
10 24.33 30.6 30.66
11 26.15 32.62 34.2
12 19.9 27.22 27.82
13 25.73 30.51 32.55
14 26.02 35.35 37.4
15 27.82 37.6 39.22
16 17.55 21.95 24.77
17 20.64 22.46 26.95
18 23.77 27.11 34.68
19 27.35 31.71 34.68
20 20 21.53 25.97
21 22.8 28.42 34.8
22 24.6 29.88 31.35
23 26 36.48 38.86
24 18.97 22.02 23.84
25 19.22 25.55 28.55
26 22.33 25.82 25.97
27 23.48 26.42 28.97
28 18.62 24.24 25.33
29 19.64 26.42 28.97
30 19.98 26.75 29.32
31 26.2 29.13 34.6
32 14.44 19.06 23.06
33 20.8 24.75 31.95
34 16.11 21.77 26.84
35 20.4 22.73 32.55
36 14.08 17.91 19.53
37 26 29.77 27.64
Gupta, S.
36
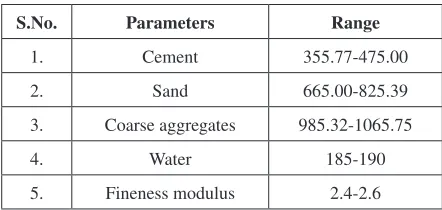
Table 3: Range of parameters in database
S.No. Parameters range
1. Cement 355.77-475.00
2. Sand 665.00-825.39
3. Coarse aggregates 985.32-1065.75
4. Water 185-190
5. Fineness modulus 2.4-2.6
S.No. 7 days Strength 14 days Strength 28 days Strength
39 17.66 23.88 28.57
40 13.91 17.93 21.82
41 21.6 21.82 24.88
42 16.11 21.77 26.84
43 20.4 22.73 32.55
44 14.08 17.91 19.53
45 26 29.77 25.64
46 15.71 18.57 25.57
47 17.66 23.88 28.57
48 15.08 20.26 24.84
49 17.13 23 28
50 17.82 23.2 25
51 24.31 27.57 28.9
52 13.84 17.8 25.6
53 15.66 20.4 29.3
54 16.91 20.13 25.97
55 19.57 29.46 29.77
Application of ANN
Concrete Mix Design Using Artificial Neural Network
37
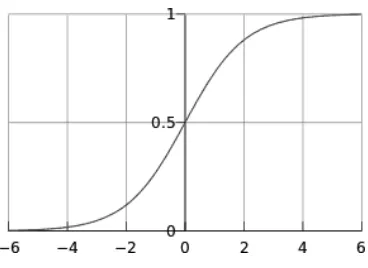
a mathematical function having an “S” shape. Often, sigmoid function refers to the special case of the logistic function shown below (Fig. 1) and defined by the formula:
S (t) = 1 / (1+e-t)
The procedure for determining the output from the inputs is as given: 1. Sum up weighted inputs, i.e.
IN
Nodj = ∑ (Wij xi) i=1
Where; Nodj is summation for jth-hidden node, IN is total number of input nodes,
Wij is connection weight ith input and jth hidden node, xi is normalized input at ith input node.
2. Transform the weighted input: Outj = 1 / (1+ e -Nodj )
Where; Outj is output from jth hidden node.
3. Sum up the hidden node outputs: HN
Nodk = ∑ (Wjk Outj)k j=1
Where; Nodk is summation for kth output node, HN is total number of hidden nodes,
Wjk is connection weight between jth hidden and kth output node.
Gupta, S.
38
4. Transform the weighted sum: Outk =1 / (1+ e -Nodj)
Where; Outk is output at kth output node.
Back propagation method of training of ANN has been done. From a desired output, the network learns from many inputs. It is a supervised learning method, and is a generalization of the delta rule. The learning rate is a common parameter in many of the learning algorithms, and affects the speed at which the ANN arrives at the minimum solution. In back propagation, the learning rate is analogous to the step-size parameter from the gradient-descent algorithm. The momentum parameter is used to prevent the system from converging to a local minimum or saddle point. A high momentum parameter can also help to increase the speed of convergence of the system. The values of learning rate (L) and momentum (M) used in the study are 0.2 and 0.1 respectively. The training time (T) for each network is 400.
The normalization of the data had been done by using the software WEKA used in carrying out the ANN analysis. In the pre-process, the minimum, maximum, mean and standard deviation for each feature is computed and used in the sigmoidal function transformation. This maintains the resolution of most values that are within a standard deviation of the mean. Thus, it puts the normalized data in a range of 0 to 1. The cross-validation technique with 20 folds has been carried out which is a standard tool in analytics and is an important feature for helping one developed and fine-tune the data mining models.
results and Analysis
The acceptance or rejection of the model developed is determined by its ability to predict the 7, 14 and 28 days compressive strength of concrete mix used. The correlation coefficient (Cc),, root mean square error (RMSE), and mean
absolute error (MAE) is used to judge the performance of the neural network approach in predicting the results. Since the neural networks are trained on actual test data, they are trained to deal with inherent noisy or imprecise data. As new data become available, the neural network model can be readily updated by retraining with patterns which include these new data.
Concrete Mix Design Using Artificial Neural Network
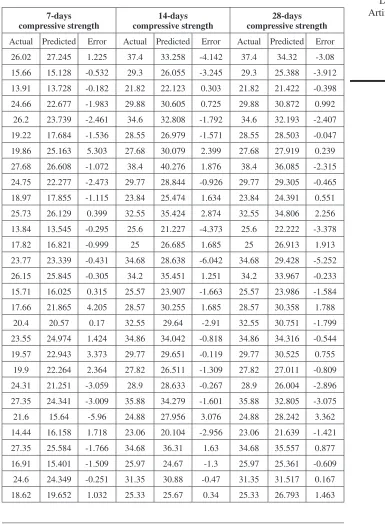
39 Table 4: Actual v/s Predicted values with errors for 7, 14 and 28 days compressive strength.
7-days
compressive strength compressive strength14-days compressive strength28-days Actual Predicted Error Actual Predicted Error Actual Predicted Error
26.02 27.245 1.225 37.4 33.258 -4.142 37.4 34.32 -3.08 15.66 15.128 -0.532 29.3 26.055 -3.245 29.3 25.388 -3.912 13.91 13.728 -0.182 21.82 22.123 0.303 21.82 21.422 -0.398 24.66 22.677 -1.983 29.88 30.605 0.725 29.88 30.872 0.992
26.2 23.739 -2.461 34.6 32.808 -1.792 34.6 32.193 -2.407 19.22 17.684 -1.536 28.55 26.979 -1.571 28.55 28.503 -0.047 19.86 25.163 5.303 27.68 30.079 2.399 27.68 27.919 0.239 27.68 26.608 -1.072 38.4 40.276 1.876 38.4 36.085 -2.315 24.75 22.277 -2.473 29.77 28.844 -0.926 29.77 29.305 -0.465 18.97 17.855 -1.115 23.84 25.474 1.634 23.84 24.391 0.551 25.73 26.129 0.399 32.55 35.424 2.874 32.55 34.806 2.256 13.84 13.545 -0.295 25.6 21.227 -4.373 25.6 22.222 -3.378
17.82 16.821 -0.999 25 26.685 1.685 25 26.913 1.913
23.77 23.339 -0.431 34.68 28.638 -6.042 34.68 29.428 -5.252 26.15 25.845 -0.305 34.2 35.451 1.251 34.2 33.967 -0.233 15.71 16.025 0.315 25.57 23.907 -1.663 25.57 23.986 -1.584 17.66 21.865 4.205 28.57 30.255 1.685 28.57 30.358 1.788
20.4 20.57 0.17 32.55 29.64 -2.91 32.55 30.751 -1.799 23.55 24.974 1.424 34.86 34.042 -0.818 34.86 34.316 -0.544 19.57 22.943 3.373 29.77 29.651 -0.119 29.77 30.525 0.755
19.9 22.264 2.364 27.82 26.511 -1.309 27.82 27.011 -0.809 24.31 21.251 -3.059 28.9 28.633 -0.267 28.9 26.004 -2.896 27.35 24.341 -3.009 35.88 34.279 -1.601 35.88 32.805 -3.075 21.6 15.64 -5.96 24.88 27.956 3.076 24.88 28.242 3.362 14.44 16.158 1.718 23.06 20.104 -2.956 23.06 21.639 -1.421 27.35 25.584 -1.766 34.68 36.31 1.63 34.68 35.557 0.877 16.91 15.401 -1.509 25.97 24.67 -1.3 25.97 25.361 -0.609
Gupta, S.
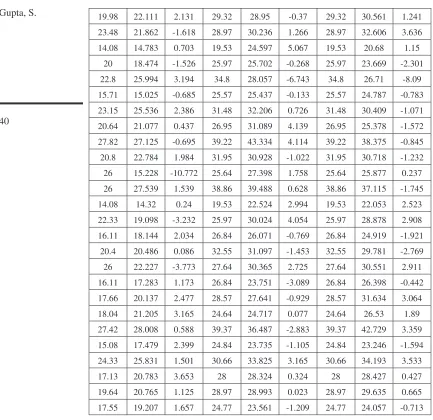
40
19.98 22.111 2.131 29.32 28.95 -0.37 29.32 30.561 1.241 23.48 21.862 -1.618 28.97 30.236 1.266 28.97 32.606 3.636 14.08 14.783 0.703 19.53 24.597 5.067 19.53 20.68 1.15
20 18.474 -1.526 25.97 25.702 -0.268 25.97 23.669 -2.301 22.8 25.994 3.194 34.8 28.057 -6.743 34.8 26.71 -8.09 15.71 15.025 -0.685 25.57 25.437 -0.133 25.57 24.787 -0.783 23.15 25.536 2.386 31.48 32.206 0.726 31.48 30.409 -1.071 20.64 21.077 0.437 26.95 31.089 4.139 26.95 25.378 -1.572 27.82 27.125 -0.695 39.22 43.334 4.114 39.22 38.375 -0.845 20.8 22.784 1.984 31.95 30.928 -1.022 31.95 30.718 -1.232 26 15.228 -10.772 25.64 27.398 1.758 25.64 25.877 0.237 26 27.539 1.539 38.86 39.488 0.628 38.86 37.115 -1.745 14.08 14.32 0.24 19.53 22.524 2.994 19.53 22.053 2.523 22.33 19.098 -3.232 25.97 30.024 4.054 25.97 28.878 2.908 16.11 18.144 2.034 26.84 26.071 -0.769 26.84 24.919 -1.921 20.4 20.486 0.086 32.55 31.097 -1.453 32.55 29.781 -2.769 26 22.227 -3.773 27.64 30.365 2.725 27.64 30.551 2.911 16.11 17.283 1.173 26.84 23.751 -3.089 26.84 26.398 -0.442 17.66 20.137 2.477 28.57 27.641 -0.929 28.57 31.634 3.064 18.04 21.205 3.165 24.64 24.717 0.077 24.64 26.53 1.89 27.42 28.008 0.588 39.37 36.487 -2.883 39.37 42.729 3.359 15.08 17.479 2.399 24.84 23.735 -1.105 24.84 23.246 -1.594 24.33 25.831 1.501 30.66 33.825 3.165 30.66 34.193 3.533
17.13 20.783 3.653 28 28.324 0.324 28 28.427 0.427
19.64 20.765 1.125 28.97 28.993 0.023 28.97 29.635 0.665 17.55 19.207 1.657 24.77 23.561 -1.209 24.77 24.057 -0.713
Table 5: Summary of the coefficients for ANN models
S.No. Parameter Correlation coefficient Mean absolute error square errorroot mean
1 7-days compressive strength 0.8926 1.8111 2.286
2 14-days compressive strength 0.8540 1.8512 2.4848
Concrete Mix Design Using Artificial Neural Network
41
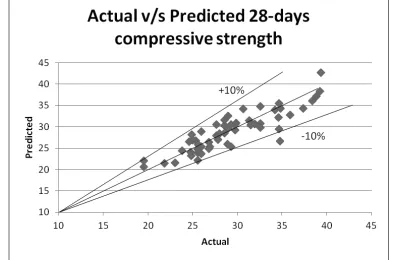
The results suggest that most of the points are lying within ±10% of the line of perfect agreement, which suggest that neural network, can effectively be used to predict the strengths.
Figure 2: Actual v/s Predicted 7-days compressive strength
Figure 3: Actual v/s Predicted 14-days compressive strength
Gupta, S.
42
CoNCLUSIoNS
Concrete is a highly complex material, and prediction of the accurate compressive strength of concrete is quite a difficult task to model. The proposed ANN Artificial intelligence models will save time, reduce the waste of material and the design cost. In the study, Artificial intelligence controller was proposed for determination of the Compressive strengths at various ages 7, 14 and 28 days. The graphs show a marginal difference between the actual and predicted values. This difference is acceptable as the method is approximate. From the end user (engineers) point of view, outcome of the model is significant on following counts; it provides a way to capture inherent vagueness in the design. It offers flexibility for the mix design expert to decide appropriate value for parameters like 7, 14 and 28 compressive strength. Successful prediction of the outputs was done by all the methods, which indicated that ANN could be useful modeling tool for engineers and research scientists in the area of cement and concrete.
The correlation coefficients (Cc) for 7, 14 and 28 days is 0.8926, 0.8540 and
0.8787 respectively. The ANN model helps to capture experimental data and to use it expeditiously during the design of fresh batches of trial mixes. The analysis demonstrates the feasibility of using neural networks for capturing non-linear interactions between various parameters in complex civil engineering systems. Thus, it can be concluded that the application of ANN is more user-friendly and more explicit model can be made which help the concrete industry to avoid the risk of faulty or deficient concrete that often entails durability and safety problems.
reFereNCeS
[1] Shigdi A, Gracia LA. Parameter estimation in ground-water hydrology using artificial neural networks, Journal of Computer and Civil Engineering, 17(4) (2003) 281–289.
http://dx.doi.org/10.1061/(ASCE)0887-3801(2003)17:4(281)
[2] Rogers JL. Simulating structural analysis with neural network. Journal of Computer and Civil
Engineering, 8(2) (1994) 252–265.
http://dx.doi.org/10.1061/(ASCE)0887-3801(1994)8:2(252)
[3] Kasperkiewicz J, Rach J, Dubrawski A. HPC strength prediction using artificial neural network,
Journal of Computer and Civil Engineering 9(4) (1995) 279–284.
http://dx.doi.org/10.1061/(ASCE)0887-3801(1995)9:4(279)
[4] Oh JW, Kim JT, Lee GW. Application of neural networks for proportioning of concrete mixes.
ACI Material Journal, 96(1) (1999) 61–67. http://dx.doi.org/10.14359/429
[5] Lai S, Serra M. Concrete strength prediction by means of neural network. Construction Building
Concrete Mix Design Using Artificial Neural Network
43
[6] Yeh I-Cheng. Modeling concrete strength using augment-neuron network. Journal of Material in
Civil Engineering, 10(4) (1998). http://dx.doi.org/10.1061/(ASCE)0899-1561(1998)10:4(263)
[7] Yeh I-Cheng. Modeling of strength of high-performance concrete using artificial neural networks. Cem Concrete Research, 28(12) (1998) 1797–1808.
http://dx.doi.org/10.1016/S0008-8846(98)00165-3
[8] Yeh I-Cheng. Design of high-performance concrete mixture using neural networks and nonlinear programming. Journal of Computer and Civil Engineering, 13(1) (1999).
http://dx.doi.org/10.1061/(ASCE)0887-3801(1999)13:1(36)
[9] Sebastia M, Olmo IF, Irabien A. Neural network prediction of unconfined compressive strength of coal fly ash–cement mixtures. Cem Concrete Research, 33 (2003) 1137–1146.
http://dx.doi.org/10.1016/S0008-8846(03)00019-X
[10] Kim JI, Kim DK, Feng MQ, Yazdani F. Application of neural networks for estimation of concrete strength. Journal of Material in Civil Engineering, 16(3) (2004) 257–264.
http://dx.doi.org/10.1061/(ASCE)0899-1561(2004)16:3(257)
[11] Dias WPS, Pooliyadda SP. Neural networks for predicting properties of concretes with admixtures. Construction Building Material, 15 (2001) 371–379.
http://dx.doi.org/10.1016/S0950-0618(01)00006-X
[12] Hong-Guang N, Ji-Zong W. Prediction of compressive strength of concrete by neural networks.
Cem Concrete Research, 3(8) (2000) 1245–1250.
http://dx.doi.org/10.1016/S0008-8846(00)00345-8
[13] Ren LQ, Zhao ZY. An optimal neural network and concrete strength modeling. Journal of
Advance Engineering Software, 33 (2002) 117–130.
http://dx.doi.org/10.1016/S0965-9978(02)00005-4