Biojournal of Science and Technology
Research Article
Measuring Intensity of Disparity of Utility Infrastructure
Development in Bangladesh
Dr Kazi Md. Fazlul Haq
*1, Md. Abu Said
1Department of Geography and Environment,
2Geography and Environment, Govt. Azizul Haque College, Bogra. 3Business Administration, Daffodil International University, Dhaka.
*Corresponding author Dr Kazi Md. Fazlul Haq
Department of Geography and Environment, University of Dhaka.
Published: 12-09-2016
Biojournal of Science and Technology Academic Editor: Editor-in-Chief
This is an Open Access article distributed under the terms of the (http://creativecommons.org/licenses/by/4.0
reproduction in any medium, provided the original work is properly cited.
Abstract
The article reflects the intensity of disparity in utility infrastructure development in Bangladesh. The disparity in utility infrastructure development remains in an alarming zone inspite of having considerable concern of government and development relat
techniques, the paper examines the inter
infrastructures. The paper also finds the intensity of disparity in sense of the quantity of the exist infrastructure services where the Gini Index shows it mathematically and the Lorenz Curves show it graphically. The paper concludes with the Gini Index and its implications in regional planning as well as the policy recommendations that might provide p
opportunities to alleviate regional disparity.
Keywords:
Gini Index, Regional planing, Regional disparity
Biojournal of Science and Technology
Measuring Intensity of Disparity of Utility Infrastructure
Development in Bangladesh
Md. Abu Said
2, Sara Tasneem
3Department of Geography and Environment, University of Dhaka. Geography and Environment, Govt. Azizul Haque College, Bogra. Business Administration, Daffodil International University, Dhaka.
Department of Geography and Environment, University
Received: 15-08-2016 Biojournal of Science and Technology Vol.4:2016 Accepted: 10-09-2016 Article no: m160000
This is an Open Access article distributed under the terms of the Creative Commons Attribution License
http://creativecommons.org/licenses/by/4.0 ), which permits unrestricted use, distribution, and reproduction in any medium, provided the original work is properly cited.
The article reflects the intensity of disparity in utility infrastructure development in Bangladesh. The disparity in utility infrastructure development remains in an alarming zone inspite of having considerable concern of government and development related authorities. Using the Gini Index and Lorenz Curve techniques, the paper examines the inter-district disparity in developing the selected four utility infrastructures. The paper also finds the intensity of disparity in sense of the quantity of the exist infrastructure services where the Gini Index shows it mathematically and the Lorenz Curves show it graphically. The paper concludes with the Gini Index and its implications in regional planning as well as the policy recommendations that might provide policy makers with the possible ways of finding the opportunities to alleviate regional disparity.
Regional planing, Regional disparity.
Measuring Intensity of Disparity of Utility Infrastructure
6 6
Creative Commons Attribution License ), which permits unrestricted use, distribution, and
@2015, GreenNetPub Biojournal of Science and Technology P a g e | 2 INTRODUCTION
In many situations, the provision of regional infrastructure can act as a catalyst for the generation of local agglomeration economies, because infrastructure can be regarded as a local non-traded input (Marshall 1920). Despite considerable concern by the government, regional disparities remain a persistent and troubling feature of Bangladesh’s economy. A very close association exists in Bangladesh between regional utility infrastructure endowment and broad levels of socio-economic development. Distribution of the utility infrastructure development is not even all over the country. In all the cases (drinking water supply, sanitation, electricity, and roads and highways) it is found that most of the north-western, northern, coastal and the hilly districts are less developed and have some drawbacks in developing utility infrastructure. But the districts surrounding the capital are in better status in relation to the utility infrastructure development (Haq & Said, 2009). Bangladesh needs to embark in infrastructure development for its economic development and stability of its economy. Utility infrastructure has a key role to play in providing best value, innovation and continuity through all development stages of our economy. Electricity and roads and highways have the highest importance in this regard. Understanding this, government has given emphasis on these two. Presently Bangladesh has the capacity of producing 8625 MW and government has a target to produce 14084 Megawatt in 2016 whereas the demand of that time will be 11405 MW (GoB, 2012). Same source mentions about 21272 km roads and highways in 2012 whereas the number was 20799 km in 2001. Bangladesh government has given emphasize on social infrastructure development allocating 23.17 % of the total budget of 2013-2014 fiscal year. 8.66 % and 5.1% of the allocation are given in communication infrastructure and power sector respectively. In the budget of 2013-2014 Fiscal Year, the power and energy sector has been given the highest priority. Still all these are appeared to be not enough for
alleviating the disparity in infrastructure development in Bangladesh.
OBJECTIVES
The objective of the present study is to find out the intensity of disparity in selected utility infrastructure; viz., drinking water supply, sanitation, electricity and roads and highways in general. And to find out the black hole of the development states of the country’s infrastructures in particular.
METHODOLOGY
Analysis has been done applying Lorenz curve and Gini coefficient/index relying on the secondary data of 2001. Gini index has been applied as one of the main techniques of the present disparity study of utility infrastructures of the country. Bahauddin (1989) measure Gini Index for the certain physical facilities. Gini index is used in the income disparities of the world as well as USA. From that USA is proved to be more unequal in income than the European countries. This is the technique by which disparity in the development can be detected. With that analysis, special actions can be taken for the deprived areas for their sound development.
@2015, GreenNetPub Biojournal of Science and Technology P a g e | 3
now a day it’s well used in regional planning. Lorenz curve is constructed for the present analysis by plotting the cumulative percentage of population of concern districts on (X) horizontal axis and cumulative percentage of infrastructures on the (Y) vertical axis. The classification of the data is performed on the basis of the ascending order of Location Quotient (LQ) values.
The Gini coefficient is a summary statistic of the Lorenz curve and a measure of inequality in a population which is also a measure of statistical dispersion developed by the Italian statistician Corrado Gini 1912. The vertical axis measures of the percentage of income going to income recipients, who are arrayed in percentiles on the horizontal axis. Income recipients are ordered from the poorest to the richest, moving from left to right. This is well noticed in the table-1.
Table-1: Meaning of the Gini values
Gini Value Meaning
<0.1 There is an artificial background for leveling
0.1-0.2 Though considerably equal, there is an anxiety to obstruct the effort to the improvement 0.2-0.3 Usual distribution type that exists in general in society
0.3-0.4 Though there are some difference, there is also a desirable respect in the improvement through competition
0.4-0.5 The difference is serious
>0.5 The improvement is required except under special circumstances
Source:www.nihonkaigaku.org/ham/eacoex/100econ/120doms/122dist/1224inc/ gini/e_gini.html
DISPARITY IN ELECTRICITY SUPPLY
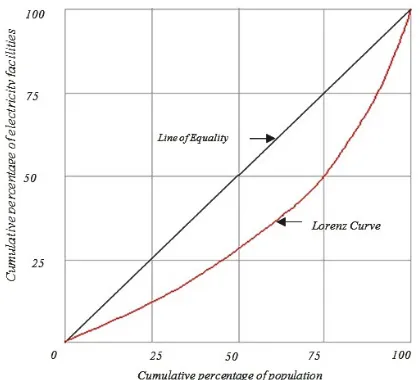
Disparity in electricity supply in Bangladesh is well depicted in the Fig.-1 which shows that the first 25 percent population of the country has the electricity facilities less than 10 percent. The second 25 percent population has slightly higher than the first 25. This group of people has about 17 percent of total electricity. Third 25 percent population enjoys about 25 percent facilities of electricity and last group enjoys 48 percent of this facilities.
It is also well noticed that last 6 percent population enjoys 18 percent of electricity facilities. So here the Lorenz curve is showing a considerable disparity in electricity supply facilities of the country.
Figure 1. Disparity in Electricity Supply in Bangladesh
DISPARITY IN ROADS AND HIGHWAYS
@2015, GreenNetPub Biojournal of Science and Technology P a g e | 3
country and first 50 percent population has 36 percent of these facilities. But third 25 percent population has about 24 percent and the last 25 percent has about 40 percent of the facilities.
Figure 2. Disparity in Roads and Highways Development in Bangladesh
Only the third 25 percent population has the normal facilities for the roads and highways but others have not. So the disparities in roads and highways for the country is well remarked and this should be taken seriously for the future planning.
DISPARITY IN SANITATION
Disparity status in sanitation facilities of the country is presented in Fig.-3. According to the presented graph, the first 25 percent population has about 12 percent of sanitation facilities and this can be noted as the most deprived group of population for the sanitation facilities. The next 25 percent has about 18 percent of sanitation facilities and the third 25 percent has about 30 percent whereas last or highly facilitated rich last group enjoys 40 percent of the facilities. It is also well noted here that the last 25 percent of population of the country enjoys the sanitation facilities higher than the first 50 percent of the total population.
Figure 3. Disparity in Sanitation in Bangladesh
DISPARITY IN DRINKING WATER SUPPLY
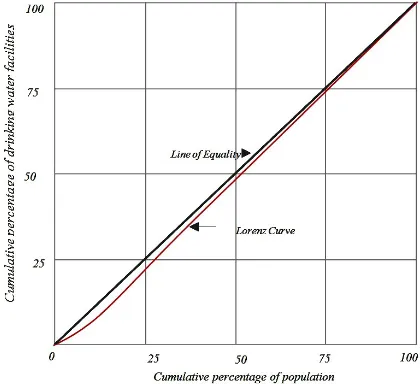
Disparity in drinking water supply (Fig.-4) depicts that that the first 25 percent population has about 22 percent, second 25 percent has about 26 percent, third 25 percent enjoys 25 percent and the last 25 percent population has an access to 27 percent of drinking water facilities. So the disparity is almost absent in drinking water supply scenario of the country.
@2015, GreenNetPub Biojournal of Science and Technology P a g e | 4
From all of the Lorenz curve analysis; it is notified that the disparity is highest in electricity facilities and minimal in drinking water supply of the country.
GINI COEFFICIENT/ INDEX
The Gini coefficient/ index include the calculation of Location Quotient (LQ), Percentage of population of a district, Percentage of specific utility facility and the cumulative percentages of
them. Twenty seven districts of Bangladesh have the score of LQ less than 0.75 for sanitation infrastructure (Table-2). In this data table it is well noted that 36.58 % population falls in this category and 19.62 % of population have the sanitation facilities in this group.
Table-2: The cumulative percentages of population & sanitation development of districts having LQ value less than 0.75
Name of the
District LQ
Population Sanitation
Total % Cumulative % Facilitated % Cumulative %
Thakurgaon 0.23 1,199,800 0.99 0.99 112540 0.24 0.24
Bandarban 0.26 280,520 0.23 1.22 29060 0.06 0.3
Gaibandha 0.33 2,109,420 1.74 2.96 269700 0.57 0.87
Khagrachari 0.36 490,580 0.4 3.36 66420 0.14 1.01
Nilphamari 0.36 1,547,080 1.28 4.64 216620 0.46 1.47
Nawabganj 0.38 1,414,120 1.17 5.81 210420 0.45 1.92
Madaripur 0.41 1,111,100 0.92 6.73 177620 0.38 2.3
Netrokona 0.44 1,945,420 1.6 8.33 327500 0.69 2.99
Naogaon 0.44 2,366,960 1.95 10.28 410140 0.88 3.87
Rangpur 0.46 2,483,580 2.05 12.33 454940 0.96 4.83
Dinajpur 0.46 2,620,320 2.16 14.49 463000 0.98 5.81
Rangamati 0.49 493,720 0.41 14.9 95920 0.21 6.02
Joypurhat 0.56 831,740 0.69 15.59 180000 0.38 6.4
Sunamganj 0.56 1,965,240 1.62 17.21 441260 0.93 7.33
Jamalpur 0.56 2,088,060 1.72 18.93 465340 0.99 8.32
Mymenshing 0.56 4,424,240 3.65 22.58 954040 2.02 10.34
Meherpur 0.59 584,240 0.48 23.06 136880 0.29 10.63
Magura 0.59 818,900 0.68 23.74 187520 0.41 11.04
Chuadanga 0.59 997,420 0.82 24.56 231800 0.49 11.53
Patuakhali 0.62 1,431,460 1.18 25.74 340860 0.72 12.25
Jhenaidah 0.62 1,556,000 1.28 27.02 367120 0.78 13.03
Sirajganj 0.64 2,660,880 2.19 29.21 658700 1.39 14.42
Panchagarh 0.67 834,320 0.69 29.9 216020 0.46 14.88
Pabna 0.67 2,148,000 1.77 31.67 556660 1.18 16.06
Bhola 0.72 1,688,300 1.39 33.06 471140 1 17.06
Habiganj 0.72 1,737,180 1.43 34.49 481720 1.02 18.08
@2015, GreenNetPub Biojournal of Science and Technology P a g e | 3
Thirteen districts of the country have the location quotient for sanitation ranging from 0.75 to 1.00. This group of population accounts 16.94 % of total population of the country and 14.64 % sanitation facilitated population of the country falls in this group (Table-3).
Table-3: Districts having LQ value from 0.75 to 1.00 Name of the
District LQ
Population Sanitation
Total % Cumulative % Facilitated % Cumulative %
Lalmonirhat 0.77 1,097,480 0.9 0.9 324300 0.67 0.67
Cox's Bazar 0.77 1,727,840 1.42 2.32 521380 1.1 1.77
Natore 0.79 1,506,940 1.24 3.56 469400 1 2.77
Sherpur 0.82 1,258,480 1.04 4.6 399400 0.85 3.62
Kurigram 0.85 1,757,180 1.45 6.05 576820 1.22 4.84
Bogra 0.85 2,964,980 2.45 8.5 977100 2.07 6.91
Rajbari 0.87 945,020 0.78 9.28 325440 0.67 7.58
Moulavibazar 0.87 1,594,440 1.32 10.6 541280 1.14 8.72
Bagerhat 0.9 1,485,380 1.22 11.82 519440 1.1 9.82
Rajshahi 0.9 2,227,640 1.84 13.66 772680 1.64 11.46
Satkhira 0.95 1,830,520 1.51 15.17 680380 1.44 12.9
Shariatpur 0.97 1,072,440 0.88 16.05 406400 0.86 13.76
Barguna 0.97 1,081,620 0.89 16.94 415960 0.88 14.64
Location quotients (LQ) for sanitation ranging from 1.00-1.50 are found in 17 districts (Table-4) having population of 31.33 % and the percentages of population having sanitary latrine facilities are 39.26 %.
Table-4: The cumulative percentages of population & sanitation development of districts having LQ values from 1.00 to 1.50
Name of the
District LQ
Population Sanitation
Total % Cumulative % Facilitated % Cumulative %
Jessore 1 2,420,240 2 2 933040 1.98 1.98
Khustia 1.03 1,723,320 1.42 3.42 686980 1.46 3.44
Tangail 1.03 3,226,160 2.66 6.08 1296740 2.75 6.19
Manikganj 1.08 1,290,760 1.06 7.14 539480 1.14 7.33
Narail 1.1 691,360 0.57 7.71 295608 0.63 7.96
Norshingdi 1.1 1,873,180 1.54 9.25 807720 1.71 9.67
Noakhali 1.15 2,537,320 2.09 11.34 1143980 2.42 12.09
Gopalganj 1.18 1,142,400 0.94 12.28 525140 1.11 13.2
Lakshmipur 1.18 1,475,660 1.21 13.49 673880 1.43 14.63
Faridpur 1.18 1,709,840 1.41 14.9 784820 1.66 16.29
Sylhet 1.18 2,466,080 2.03 16.93 1146080 2.43 18.72
@2015, GreenNetPub Biojournal of Science and Technology P a g e | 4
Brahmanbaria 1.28 2,348,160 1.94 19.55 1169880 2.48 22.05
Chandpur 1.41 2,215,000 1.83 21.38 1221080 2.59 24.64
Munshiganj 1.46 1,264,700 1.04 22.42 724540 1.53 26.17
Comilla 1.46 4,539,000 3.74 26.16 2592360 5.49 31.66
Chittagong 1.46 6,276,380 5.17 31.33 3590640 7.6 39.26
Table-5 shows the LQ value of more than 1.5 where 15.15 % of the total population of the country is counted and sanitary latrine facilitated population is 26.48 % in this group. Only seven districts fall in this group. This may be termed as the rich group both from Location Quotient and Percentages of population of sanitary latrine
facilitated. Only 15 % population of the country has a 27 % of sanitary latrine facilities. So this group can be noted as the rich group. But the number of districts of this group is not higher. This makes a less disparity in the final result.
Table-5: The cumulative percentages of population & sanitation development of districts having LQ values more than 1.50
Name of the District LQ
Population Sanitation
Total % Cumulative % Facilitated % Cumulative %
Gazipur 1.51 1,960,100 1.62 1.62 1163180 2.46 2.46
Narayanganj 1.51 2,088,240 1.72 3.34 1234920 2.62 5.08
Barisal 1.51 2,282,680 1.88 5.22 1352720 2.87 7.95
Khulna 1.51 2,300,246 1.9 7.12 1366500 2.91 10.86
Jhalokati 1.56 685,660 0.57 7.69 414980 0.88 11.74
Feni 1.69 1,178,940 0.98 8.67 774160 1.64 13.38
Dhaka 2.03 7,864,540 6.48 15.15 6202860 13.1 26.48
Table-6 reveals that the value of the Gini index is very lower than 0.1. So the disparity among the districts for the sanitary latrine system is relaxed. But the situation of overall development of the sanitation in the districts is not satisfactory. Most of the districts of the country have lower sanitation development that should be improved.
Table-6: Gini coefficient/ index for Sanitation on the basis of population.
Group by LQ % of
population(b)
% of
Sanitation Facility ( c )
Cumulative % of Sanitation Facility (a+c)
Paired Sums {a+(a+c)}
Twice the
Trapezoid Area b{a+(a+c)}
<0.75 36.58 19.62 19.62 19.62 717.6996
0.75-1.00 16.94 14.64 34.26 53.88 912.7272
1.00-1.5 31.33 39.26 73.52 127.4 3991.442
>1.5 15.15 26.48 100 227.4 3445.11
@2015, GreenNetPub Biojournal of Science and Technology P a g e | 3
G= E - b{a+(a+c)} / E Here, G= Gini value = 10000-9066.9788 / 10000 E = Areas of the Square = 0.0933
Table-7 reveals the gini index value for other selected utility infrastructure of the country. From the table it is well noted that the values of the Gini for the selected utility infrastructures are less than 0.2. The Gini for the electricity supply (0.166) is highest here of the four infrastructures. This indicates that the distribution is considerably equal but there is an anxiety to obstruct the effort to the improvement. The distribution seems to be equal but is not sufficient for the development of the society. In the roads and Highways, the Gini is almost same to the electricity. This also can be considered as the same class of the standards of the Gini index. This seem to be the equal in distribution, but should be improved the service for the betterment of the society. The roads and highways data is based on the areas of study unit that may affect the actual result of the study.
Table-7: Gini coefficient/index for the selected utility infrastructures
Names of Utility
Infrastructures Value of Gini Index Electricity Supply 0.166
Sanitation Facilities 0.093 Roads & Highways 0.132 Drinking Water Supply 0.007
Sanitation is another important utility infrastructure which gains a Gini index of 0.093 that is lower than 0.1. So this has a tendency in leveling the service all over the country.
CONCLUSION
Electricity supply as a utility infrastructure of the country is well distributed in the sense of disparity but the value of Gini index suggests developing the condition of electricity supply in the country. In
sanitation disparity is not severe but overall scenario should be improved. Distribution in roads and highway is higher in relation to the present criteria but not severe. Drinking water supply has the lowest disparity among the four. It has almost even distribution among the districts.
From the discussion it can be said that the disparity in these infrastructural distribution is not severe in the districts of Bangladesh. But all of these services should be improved both in quantity and quality.
REFERENCES
1. Bahauddin, Md. “Spatial distribution of physical facilities in Bangladesh”, an unpublished MURP thesis, Department of URP, BUET, Dhaka, 1989.
2. Bhattacharya N. and Coondoo D.
Collection and Analysis of Survey Data on
Income and Expenditure, Statistical
institute for Asia and the Pacific, Tokyo, 1992.
3. Dagum, C. "The Generation and Distribution of Income, the Lorenz Curve and the Gini Ratio." Écon. Appl.33, 327-367, 1980.
4. GoB. Bangladesh Economic Review, Ministry of Finance, Government of the People’s Republic of Bangladesh, 2012. 5. Haq, Kazi Md. Fazlul and Saeed, Md.
Abu. “Regional disparity in utility infrastructure development in Bangladesh.” Journal of the Bangladesh
National Geographical Association, Vol.
37. Nos. 1&2, 2009.
6. Marshall, A. Principles of economics, 8th ed. Macmillan, London, 1920.
7. www.nihonkaigaku.org/ham/eacoex/100ec