A Study of 3D CAD Model and Feature Analysis for Casting Object
Rashiqah Rashli
1*, Zuliani Zulkoffli
1, Elmi Abu Bakar
2and Mohd Shukri Soaid
21
School of Mechanical Engineering, University Science Malaysia, Malaysia. 2
School of Aerospace Engineering, University Science Malaysia, Malaysia. Received 29 December 2011; received in revised form 30 January 2012; accepted 29 February 2012
Abstract
When dealing with computer vision inspection testing parts in production line, the appearance of noise such as dust and inconsistent light distribution should be consider for further analysis on the parts image. In this paper, shape representation model using feature vector and Fourier descriptor were presented on the 3D CAD model image with the aim to gain the shape feature analysis for casting object. By adding light and salt & pepper noise on the CAD model image, the predicted database was compared to its original CAD image. In feature vector method, calculation on its Similarity, Correlation, Matching black and white points was carried out. Results observation show similarity of feature vector method performs 68% accuracy for light noise appearance, while correlation method performs 98% accuracy on disturbance of salt & pepper noise. Fourier Descriptor used to present the pose estimation of images on CCW and CW direction. Result shows matching sets similarity is value high since the dissimilarity value keeps below 0.3 and achieve few similar points in certain position. Thus, it is sufficient for casting object by implementing feature vector method which were very useful in analyze the noise on the image while pose estimation position described by Fourier Descriptor function.
Keywords: inspection, noise, shape representation, 3D CAD model image
1.
Introduction
Nowadays, there is a growing interest of creating images in digital form. Much attention had been attracted in exploring for images using shape features. Shape representation plays an important role in many areas of computer vision and pattern recognition. Character recognition, contour matching for medical imaging 3-D reconstruction, industrial inspection and many other visual tasks can be achieved by shape recognition. There are many shape representation and description techniques in the literature. However in general there are two basic approaches for shape representation: by contours and by regions. Examples of region based shape representation are octrees, quadtrees, skeletons and morphology decomposition. Vectors, signal, chain code and run length are contour based shape representation methods [1]. Yet, only a few methods of contour based methods had been clarify and studied in this research. The best method in representing the shape of 3D casting object is selected based on its performance.
In previous literature, shape representation seems commonly for effective ways to confine the quintessence of the shape features which make it simpler for a shape to be stored, transmitted, compared against, and recognized where it is independent of translation, rotation, and scaling of the shape. [2]
*Corresponding author. E-mail address: [email protected]
According to Seongok Kim in [3], a powerful shape representation must satisfy several criteria, including:
(1) Efficiency: simplicity and compactness.
(2) Accuracy: accurate and complete reconstruction.
(3) Effectiveness: suitability for shape analysis and shape recognition.
Luciano and Roberto in [3] classified shape representation in two categories which are boundary-based or known as contour based and region based.
SHAPE REPRESENTATION
CONTOURS
PARAMETRIC CONTOUR SET OF CONTOUR POINTS
•Vectors (x(t), y(t))
•Complex Signal u(t) = x(t)+jy(t) •Chain- Codes
•Run-Lengths
REGIONS
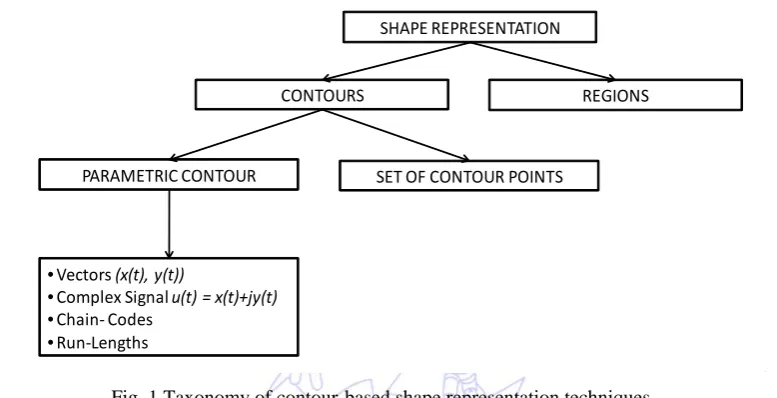
Fig. 1 Taxonomy of contour-based shape representation techniques
In contour-based, objects are represented in terms of their external characteristics (i.e. the pixels along the object boundary), while in region-based, shape features are extracted from the whole shape region (i.e. the pixels contained in the region). Under contour-based category, it is further divided into two methods which are parametric contour and set of contour points and it is shown as in the Fig. 1. As illustrated in Fig. 1, the proposed taxonomy divides the contour-based approach into the following two classes:
(1) Parametric contours: the shape outline is represented as a parametric curve, thus implying the sequential order along it.
(2) Set of contour points: the shape outline is simply represented as a set of points, without any special order among it. [3]
Based on above consideration the vectors and complex signal from parametric contours of contour-based approach is selected to study the effect of lighting and occurrence of dust and also the analysis of rotational of 3D casting objects.
2.
Methods and Approach
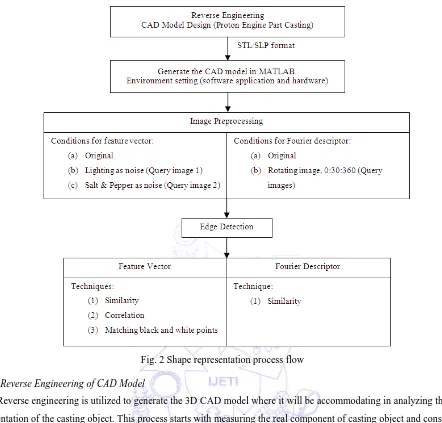
Fig. 2 Shape representation process flow
2.1. Reverse Engineering of CAD Model
Reverse engineering is utilized to generate the 3D CAD model where it will be accommodating in analyzing the shape representation of the casting object. This process starts with measuring the real component of casting object and constructing the CAD drawing via exploiting the Solid Work software. Subsequent to the complete CAD model drawing as shown in the Fig. 3, it then will be saved in STL or SLP format to facilitate the 3D CAD drawing rendering in the MATLAB platform.
Fig. 3 Reverse engineering process
2.2. Generate CAD Model in MATLAB
Preprocessing process. The result from this process and the overall process is shown in Fig. 4. From here, we get two conditions of image which are without lighting image where we used as an original image without added any characteristics to it and with lighting image as query image 1 where we add lighting source to it to enlighten the hidden features such as the inside curvature as can be seen in Fig. 4 below.
Fig. 4 Image rendering process
2.3. Image Preprocessing
Miljkovic in [4] defines image preprocessing as the term for operations on images at the lowest level of abstraction whose aim is an improvement of the image data that suppress undesired distortions or enhances some image features important for further processing.
There are three conditions image preprocessing analysis phases that been proposed for feature vector and two conditions for Fourier descriptor which shown in Fig. 5 and illustration is briefly explained as follow.
Fig. 5 Salt & Pepper
Conditions for feature vector:
(2) Lighting as noise (Query image 1): Lighting is added to the image. During projection, the parameter of lighting angle for illumination is set so that, lighting will produce shadows to the image and it affects the quality of the image and the edge detection. The result of this image will be compared with the original image.
(3) Salt & Pepper as noise (Query image 2): Salt & Pepper is added to the image as noise to symbolize the occurrence of dust or flaws in the real life. Fig. 5 below shows the gray level image that had been added Salt & Pepper as noise which is stated as Query image 2 and its histogram graph along gray level from 0 to 255 which enlighten between the object and Salt & Pepper noise where the middle line represents the Salt & Pepper noise while the right hand side line represents the object.
Conditions for Fourier descriptor:
(a) Original: This original image is the same image that is used in feature vector.
(b) Rotating images: Original image is being manipulated by rotating the image for every 30 degree from 0 degree to 360 degree to get the query images.
Fig. 6 illustrates the overall image preprocessing flow which consists of image conversion, image filtering and gray level image. In image conversion, the original image is either being added up with light source or Salt & Pepper before it is use in feature vector technique or being rotated for every 30 degree from 0 degree to 360 degree for the use of Fourier descriptor. Then the all three image will be converting to gray level image and lastly the image will be filtered to remove the unwanted noise within the image before it goes to the next process which is edge detection.
Fig. 6 Image preprocessing flow
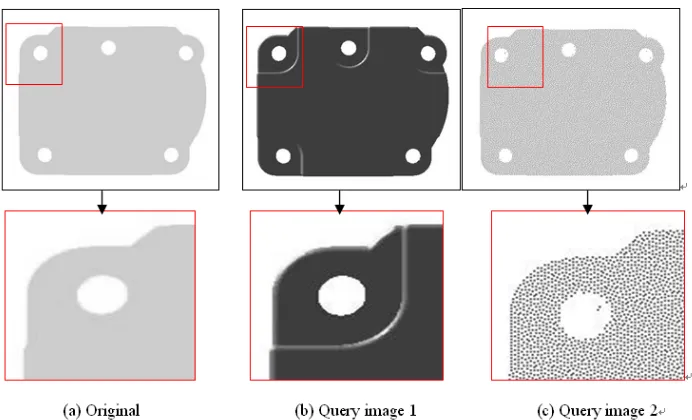
Fig. 7 shows the three conditions gray level image after filtering process. Those noises as can be seen in Fig. 7 (b) and (c) will be removed or filtered to see the comparison between the query images with the original image by using matching of black and white points, similarity and correlation.
From Fig. 7 it can be clearly seen there are noise arise at query image 1 and 2. Where at query image 1, lighting will disrupt the quality of the image, where the edges inside are also included in the image. This is because the occurrence of shadow that exposes the curvature and fillet of the part. While for query image 2 there is a point or unwanted noise inside the circle and the circle is not an even circle due to Salt & Pepper as noise had been added to the original image. Although in this step the noise is actually had been filtered out for query images, it seems that the noise is still exist and it means that it is not completely been filtered. Further and advance filtering and image preprocessing process need to be done to the image in order to filter all the unwanted noise.
2.4. Edge Detection
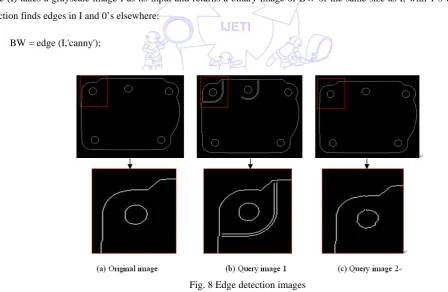
According to Hong and Asher in [5], edge detection is an essential tool used to obtain information from the frames as a precursor step to feature extraction and object segmentation in most image processing applications. This process distinguishes the edges of an object and boundaries between objects and the background in the image. There are numerous methods that are able to use in perceiving the edge in MATLAB, however, Canny Edge Detection had been chosen and implement. The Canny algorithm uses an optimal edge detector based on a set of criteria which include finding the most edges by minimizing the error rate, marking edges as closely as possible to the actual edges to maximize localization, and marking edges only once when a single edge exists for minimal response [6]. The algorithm used in Canny Edge Detection is shown as follows where BW = edge (I) takes a grayscale image I as its input and returns a binary image of BW of the same size as I, with 1’s where the function finds edges in I and 0’s elsewhere:
BW = edge (I,'canny');
Fig. 8 Edge detection images
2.5. Feature Vector
Feature vector is n-dimensional vector of numerical features that represent some object in pattern recognition and machine learning. Since, representation facilitates processing and statistical analysis, numerical representation of object is required in many algorithms in machine learning. Here, the shape is represented in the complex coordinates of the complete boundary where it can be expressed as follows:
(1)
Let consider P is the number of points (white points) in edge detection of the shape, k = 0, 1, 2... P-1which is periodic with P. Fig. 9 shows the fundamental of coordinate system of an edge which represents by black points shape on xy-plane where x-axis as real axis, while y-axis as imaginary axis of a sequence in a complex numbers. This is opposing to our research where we used white points that are connecting and produce an outline or edge as seems in Fig. 8 with the black background.
Fig. 9 Coordinate system
The data that comes from feature vector will be matched by three matching techniques. Those techniques will be compared and analyzed and the techniques are:
(1) Similarity: Shape matching using Euclidean Distance is used in this technique. The distance between vectors M (original image) and N (query image 1 or 2) is defined as follows:
(2)
(2) Correlation: Assuming that the original image as X and query image as Y, the correlation between vectors X and Y are defined as follows:
(3)
where μMand μN are the means of M and N respectively, and σMand σN are the standard deviations of M and N. Here mean and standard deviation is further defined as follows:
or (4)
(3) Matching black and white points: This method is based on matching data between white and black points for original image and query image. The white points is the points that represents the outline or the edge of the shape and the black points represents the background of the image as can be seen in Fig.8 before. The percentage matched data is calculated as follows where total data is the total white points:
(6)
The matching black and white points are exemplified further in Fig. 10 below. This concept is run using the MATLAB software in order to obtain the total matched percentage.
Initialize of different variables used
matched_data = 0; white_points = 0; black_points = 0;
Differentiate black and white points
for a = 1:1:size(a) for b = 1:1:size(b) if(pic1(a,b)==0)
white_points = white_points+1; else
black_points = black_points+1; end
end end
Differentiate white points in the two images
for i = 1:1:size(i) for j = 1:1:size(j)
if(pic1(i,j)==0)&&(pic2(i,j)==0) matched_data = matched_data+1; end
end end
Fig. 10 Matching black and white concepts
Fig. 11 Size of image
The size of the image is standardized for all three images used in this research in order to accurately match the points between them. Fig. 11 portray the size of the image that had been selected where a and i represents the length of the image while b and j represents the width of the image.
2.6. Fourier Descriptors
The discrete Fourier transform of s(k) from equation (1) gives
(7)
For u=0, 1, 2… N-1. The complex coefficients a(u) are called Fourier descriptors of the boundary. Applying inverse Fourier transform to a(u) restores s(k); For k=0, 1, 2… N-1. The restored pixel values are exactly the same as the ones that started with [8].
(8)
The data that comes from Fourier descriptor will be matched and analyzed by using only similarity technique via implementing Euclidean distance as been explained before. Moreover, original image is studied only based on its rotation and translation image. This is because Fourier descriptor cannot be dealt with disjoint shape where single close boundary may not be available where it occur in query image 1 and 2 as shown in Fig. 6 (b) and (c). Due to the scenario, original image is being manipulate by rotating the image for every 30 degree from 0 degree to 360 degree to get the query images and those query images are been matched with 0 degree (original) image.
3.
Experimental Results
In this section, the results for 3D casting object is analyzed by using Feature Vector and Fourier Descriptor. Feature vector is used to study which is the best techniques that can be used with the existence noise from lighting and Salt & Pepper which symbolize dust or defect in the real life. While Fourier descriptor is used to study invariance property against image transformation.
3.1. Feature Vector
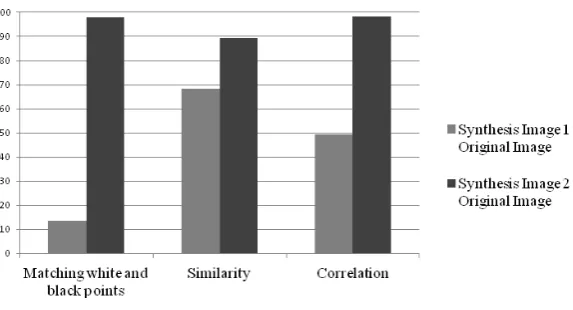
From Fig. 12, it is noticed that Synthesis Image 2 (Salt & Pepper as noise) is performed significant matching result for the part casting to the Original Image compared to Synthesis Image 1 (lighting as noise). Though, preprocessing algorithm can enhance the image quality by filtering the Salt & Pepper noise, the shadow occurrence from lighting makes it difficult to be completely removed or filtered. Further process need to be done to the Synthesis Image 1 to confiscate the shadow so that the fillet and curvature edges won’t be detected.
In the other way of comparison which is between the methods of feature vector, it can be stated that correlation is the best method of matching that can be used for adding Salt & Pepper as noise while for adding light as noise; it seems similarity method is the best choice since it gives the 97.86% of matching. This is because similarity method is only considered the region that consists of white (edge) points, whereas correlation and matching white and black points consider the whole image to be matched. Similarity gives the best solution in comparison between Synthesis image 1 and Original Image, because it only considers the region of the white points and there is no white point outside the edges. While for the Synthesis 2 and Original Image, it is not the best solution possibly because there is still Salt & Pepper noise outside the region which is not completely filtered. But after all, it can be said that similarity is the best technique seems it gives smallest difference between two matching results which is 20.92% as shown in the Table 1. This proven that similarity is the only technique that can be depend on.
Table 1 Feature vector result
Comparison Query Image 1 with
Original Image
Query Image 2 with
Original Image
Difference (Δ)
(1) Similarity 68.35 89.27 20.92
(2) Correlation 49.40 98.28 48.88
(3) Matching white and
black points 13.68 97.86 84.18
3.2. Fourier Descriptor
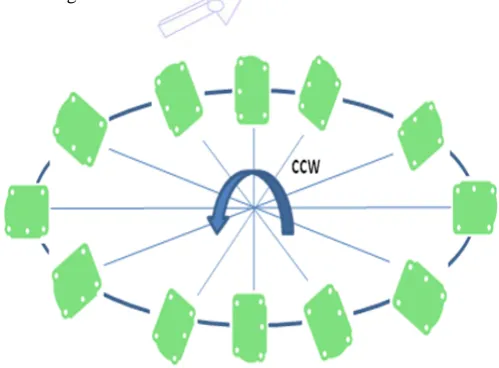
Fig. 13 shows the shapes of part casting when being rotated in counter clockwise (CCW) direction for every 30o from 0o to 360o. Each of the images will go through Fourier descriptor method process to describe the shape of the object in frequency domain. Details of the pose rotated shape in Fig. 13, here let consider the CCW direction and CW direction into consideration in Fig. 14. From pose changes, it can be seen that the matching sets similarity is value high since the dissimilarity value keeps below 0.3. Example, if we refer to pose 0 and 360 against the original pose (start point) values in figure, the similarity perform 0 (Euclid distance) represent the perfect matching in feature vector. The CW and CCW direction pose present the same tendency of pose change of our model.
Fig. 14 Euclidean distance result
4.
Discussion
It can be distinguished that, Fourier descriptor is more efficient method if compared to feature vector. This is because it can achieve the invariance property against image transformation including scale, translation and rotation. However, the disadvantage of this method, it cannot deal with disjoint shapes where single closed boundary may not be available.
While for feature vector, it can’t be used in invariance property against image transformation which consists of different scale, translation and rotation yet this method can be dealt with disjoint shapes where single closed boundary may not be available.
In evaluating the matching techniques, similarity gives remarkable result if differentiate to the matching black and white points and correlation technique. This is because similarity is using Euclidean distance which brings a few advantages compared to matching black and white points and correlation. Euclidean distance is sensitive to variations in intensity, but not very sensitive to variations in hue and saturation. The images that had been used in matching is an edge image, where it is low in intensity, so it is not a problem to apply and gives a good result in using Euclidean distance for similarity and that is why similarity gives the best matching result.
5.
Conclusion
descriptor where it brings an advantage to feature vector. While for Fourier descriptor, it can achieve the invariance property against image transformation where feature vector is not sufficient.
It can be conclude that, similarity is the best matching technique since it only consider edges point and with implementation of Euclidean distance in Fourier descriptor by remains the dissimilarity value below 0.3, it shows that variations in hue and saturation does not really effect the result since the Euclidean distance is not very too sensitive to it. Thus, feature vector and Fourier descriptor were very useful in representing shape of part casting object while similarity is the best matching technique in analyzing noise and pose estimation of casting object.
References
[1] D. S. Zhang and G. Lu, “Review of shape representation and description techniques, ” Pattern Recognition, vol. 37, pp. 1-19, Jan. 2004.
[2] Nbhan D. Salih , David Chek Ling Ngo, “A Novel Method for Shape Representation,” GVIP 05 Conference, CICC, Cairo, Egypt, Dec 2005, pp. 457-460.
[3] Luciano da Fontoura Costa and Roberto Marconde Cesar Jr, Shape classification and analysis, 2nd ed. U.S.A: CRC Press, 2009.
[4] Olga Miljkovic, “Image preprocessing tool,” Kragujevac J. Math., vol. 32, pp. 97-107, 2009.
[5] Hong Shan Neoh and Asher Hazanchuk, “Adaptive Edge Detection for Real-Time Video Processing using FPGAs,” Global Signal Processing Expo and Conference, Sep. 2004.
[6] Canny J., “A computational approach to Edge detection,” IEEE Trans. Pattern Analysis and Machine Intelligence, vol. PAMI-8, pp. 679-698, Nov. 1986.
[7] Rafael C. Gonzalez, Richard E. Woods and Steven L. Eddins, Digital Image Processing using MATLAB, U.S.A: Prentice Hall Press, 2007.
[8] Elmi Abu Bakar, Tetsuo Miyake, Zhong Zhang and Takashi Imamura, “3D CAD models and its feature similarity,” International Journal of Signal Processing, vol. 5, pp. 259-263, Sep. 2009.
[9] Nobuyuki Otsu, “A threshold selection method from gray-level histogram,” Signal Processing & Analysis, vol. SMC-9, pp. 62-66, Jan. 1979.
[10]Stephen M.Smith and J.Michael Brady, “SUSAN - A new approach to low level image processing” International Journal of Computer Vision, vol. 23, pp. 45-78, May 1997.
[11]Feng Zhao, Qingming Huang and Wen Gao, “Image matching by normalized cross-correlation” International Conference on Acoustics, Speech, and Signal Processing, vol.5, pp.729-732, May 2006.
[12]Nikos K. Logothetis, Jon Pauls
[13]W. Fortsner “A Feature Based Correspondence Algorithm for Image Matching,” International Archives of Photogrammetry, press paper Internet Service Provider Communication III, 1986.
and Tomaso Poggio “Shape representation in the inferior temporal cortex of monkeys,” Current Biology, vol. 5, pp. 552-563, May 1995.